Zip Codes with the Highest Percentage of Population with a Degree in Liberal Arts and History in Franklin, TN
RELATED REPORTS & OPTIONS
Liberal Arts and History
Franklin
Compare Zip Codes
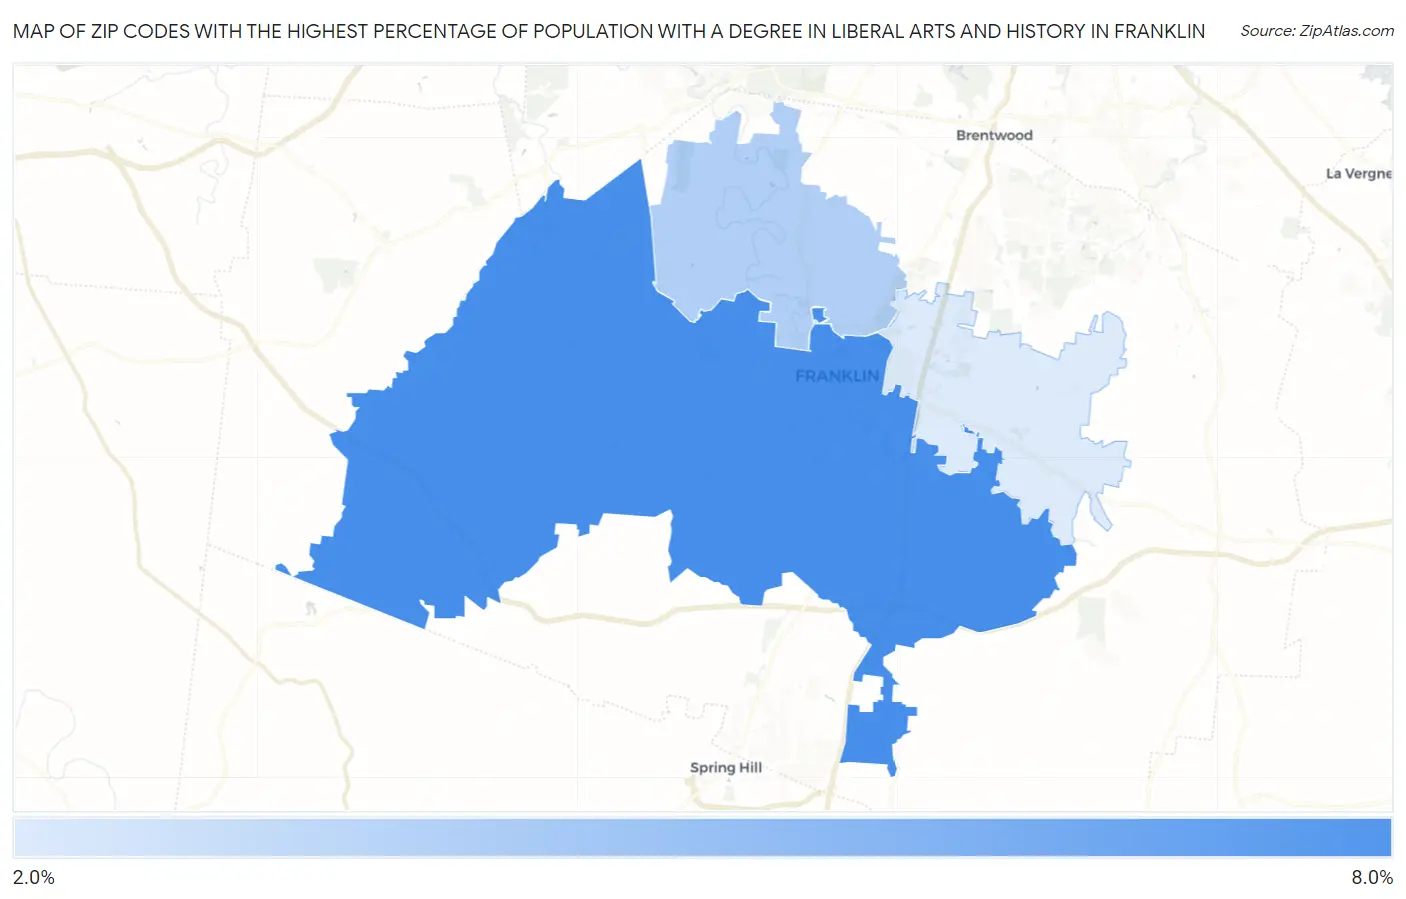
Map of Zip Codes with the Highest Percentage of Population with a Degree in Liberal Arts and History in Franklin
2.9%
6.6%
Zip Codes with the Highest Percentage of Population with a Degree in Liberal Arts and History in Franklin, TN
| Zip Code | % Graduates | vs State | vs National | |
| 1. | 37064 | 6.6% | 4.9%(+1.75)#143 | 4.9%(+1.76)#7,090 |
| 2. | 37069 | 4.0% | 4.9%(-0.846)#300 | 4.9%(-0.840)#14,649 |
| 3. | 37067 | 2.9% | 4.9%(-1.93)#366 | 4.9%(-1.93)#18,536 |
1
Common Questions
What are the Top Zip Codes with the Highest Percentage of Population with a Degree in Liberal Arts and History in Franklin, TN?
Top Zip Codes with the Highest Percentage of Population with a Degree in Liberal Arts and History in Franklin, TN are:
What zip code has the Highest Percentage of Population with a Degree in Liberal Arts and History in Franklin, TN?
37064 has the Highest Percentage of Population with a Degree in Liberal Arts and History in Franklin, TN with 6.6%.
What is the Percentage of Population with a Degree in Liberal Arts and History in Franklin, TN?
Percentage of Population with a Degree in Liberal Arts and History in Franklin is 5.1%.
What is the Percentage of Population with a Degree in Liberal Arts and History in Tennessee?
Percentage of Population with a Degree in Liberal Arts and History in Tennessee is 4.9%.
What is the Percentage of Population with a Degree in Liberal Arts and History in the United States?
Percentage of Population with a Degree in Liberal Arts and History in the United States is 4.9%.