Zip Codes with the Highest Percentage of Population Employed in Security & Protection in Franklin, TN
RELATED REPORTS & OPTIONS
Security & Protection
Franklin
Compare Zip Codes
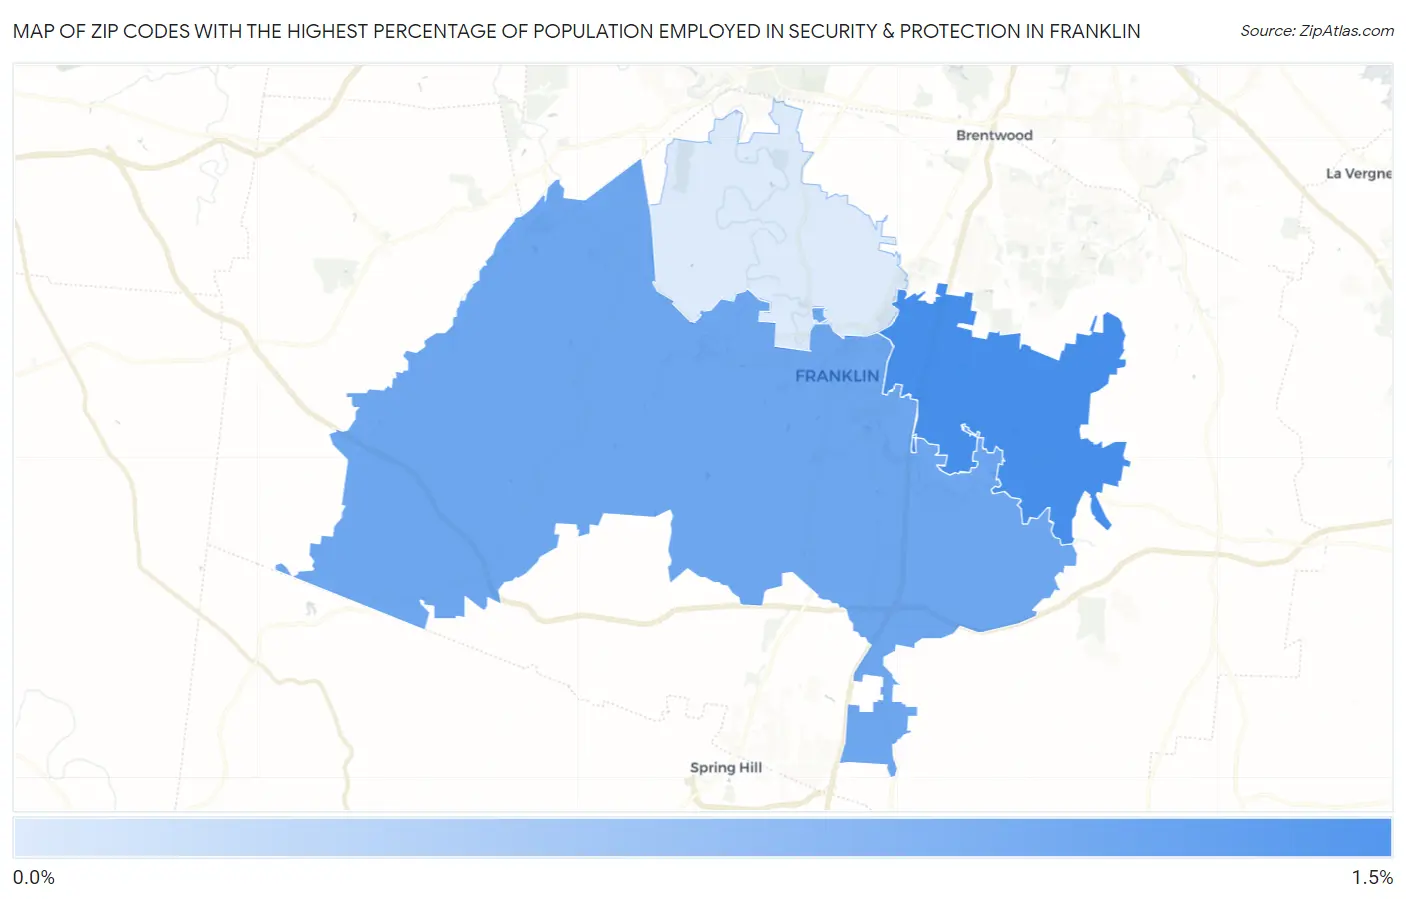
Map of Zip Codes with the Highest Percentage of Population Employed in Security & Protection in Franklin
0.50%
1.2%
Zip Codes with the Highest Percentage of Population Employed in Security & Protection in Franklin, TN
| Zip Code | % Employed | vs State | vs National | |
| 1. | 37067 | 1.2% | 2.1%(-0.939)#376 | 2.1%(-0.994)#18,855 |
| 2. | 37064 | 0.98% | 2.1%(-1.11)#401 | 2.1%(-1.17)#20,213 |
| 3. | 37069 | 0.50% | 2.1%(-1.59)#465 | 2.1%(-1.65)#23,231 |
1
Common Questions
What are the Top Zip Codes with the Highest Percentage of Population Employed in Security & Protection in Franklin, TN?
Top Zip Codes with the Highest Percentage of Population Employed in Security & Protection in Franklin, TN are:
What zip code has the Highest Percentage of Population Employed in Security & Protection in Franklin, TN?
37067 has the Highest Percentage of Population Employed in Security & Protection in Franklin, TN with 1.2%.
What is the Percentage of Population Employed in Security & Protection in Franklin, TN?
Percentage of Population Employed in Security & Protection in Franklin is 1.2%.
What is the Percentage of Population Employed in Security & Protection in Tennessee?
Percentage of Population Employed in Security & Protection in Tennessee is 2.1%.
What is the Percentage of Population Employed in Security & Protection in the United States?
Percentage of Population Employed in Security & Protection in the United States is 2.1%.