Zip Codes with the Highest Percentage of Population Employed in Administrative & Support Services in Franklin, TN
RELATED REPORTS & OPTIONS
Administrative & Support Services
Franklin
Compare Zip Codes
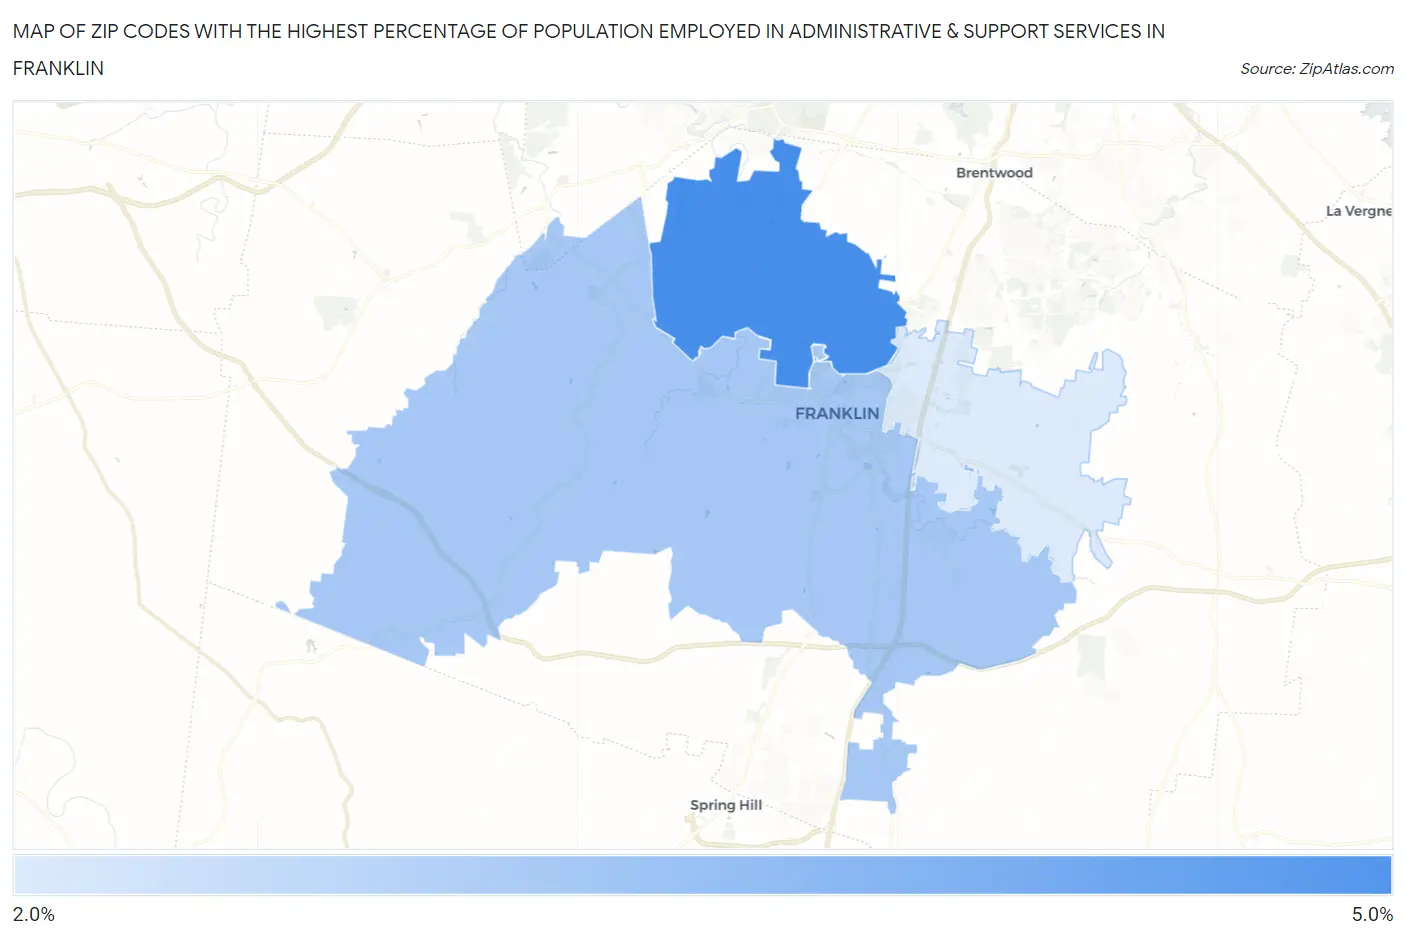
Map of Zip Codes with the Highest Percentage of Population Employed in Administrative & Support Services in Franklin
2.3%
4.7%
Zip Codes with the Highest Percentage of Population Employed in Administrative & Support Services in Franklin, TN
| Zip Code | % Employed | vs State | vs National | |
| 1. | 37069 | 4.7% | 4.4%(+0.382)#162 | 4.1%(+0.585)#7,924 |
| 2. | 37064 | 3.2% | 4.4%(-1.13)#313 | 4.1%(-0.923)#14,328 |
| 3. | 37067 | 2.3% | 4.4%(-2.02)#409 | 4.1%(-1.82)#19,027 |
1
Common Questions
What are the Top Zip Codes with the Highest Percentage of Population Employed in Administrative & Support Services in Franklin, TN?
Top Zip Codes with the Highest Percentage of Population Employed in Administrative & Support Services in Franklin, TN are:
What zip code has the Highest Percentage of Population Employed in Administrative & Support Services in Franklin, TN?
37069 has the Highest Percentage of Population Employed in Administrative & Support Services in Franklin, TN with 4.7%.
What is the Percentage of Population Employed in Administrative & Support Services in Franklin, TN?
Percentage of Population Employed in Administrative & Support Services in Franklin is 2.7%.
What is the Percentage of Population Employed in Administrative & Support Services in Tennessee?
Percentage of Population Employed in Administrative & Support Services in Tennessee is 4.4%.
What is the Percentage of Population Employed in Administrative & Support Services in the United States?
Percentage of Population Employed in Administrative & Support Services in the United States is 4.1%.