Zip Codes with the Highest Percentage of Population Employed in Architecture & Engineering in Franklin, TN
RELATED REPORTS & OPTIONS
Architecture & Engineering
Franklin
Compare Zip Codes
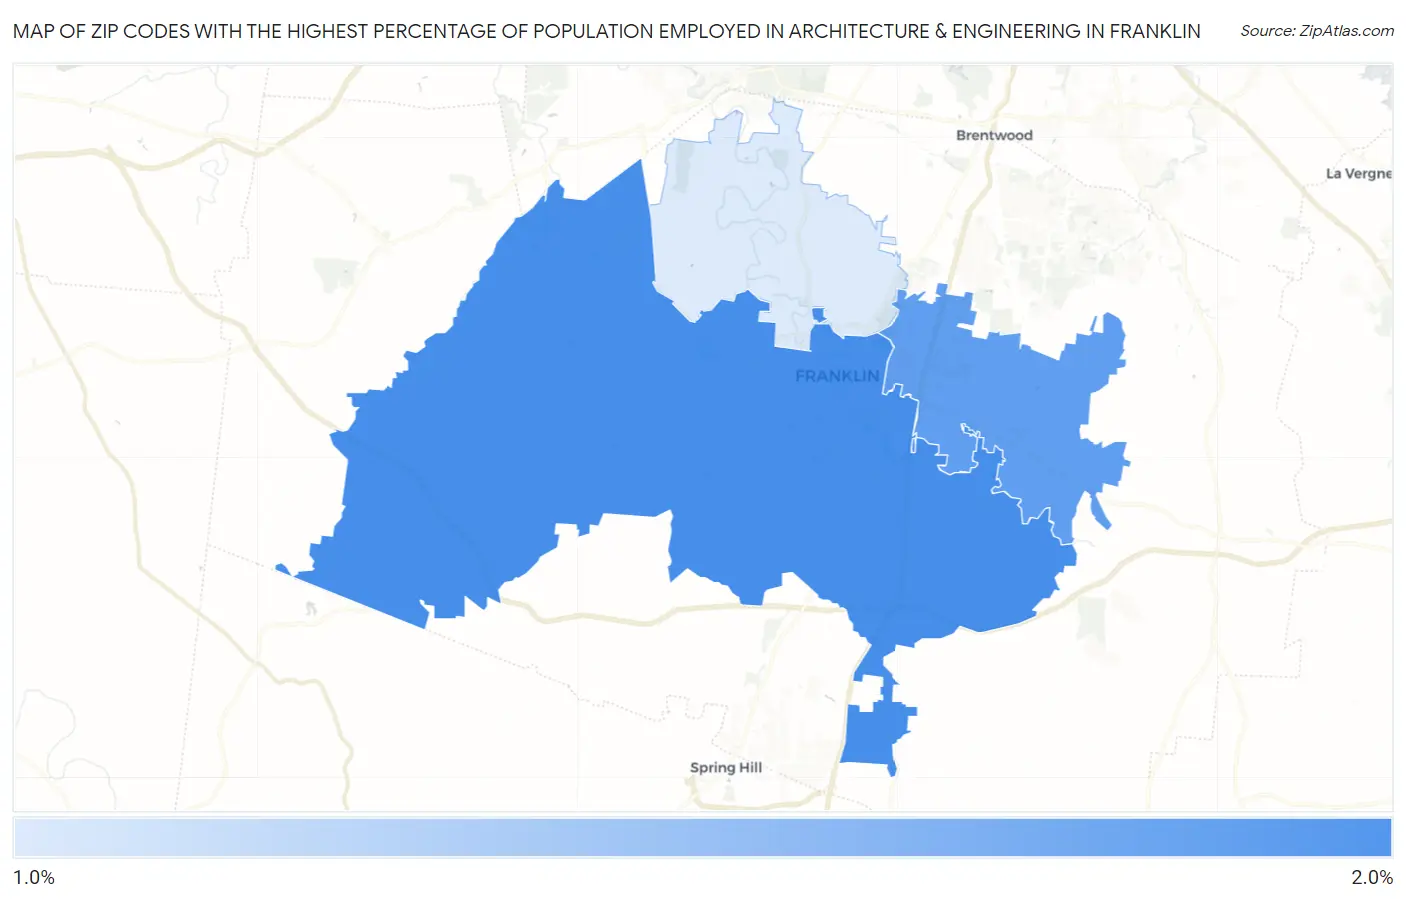
Map of Zip Codes with the Highest Percentage of Population Employed in Architecture & Engineering in Franklin
1.4%
1.8%
Zip Codes with the Highest Percentage of Population Employed in Architecture & Engineering in Franklin, TN
| Zip Code | % Employed | vs State | vs National | |
| 1. | 37064 | 1.8% | 1.7%(+0.160)#197 | 2.1%(-0.321)#10,677 |
| 2. | 37067 | 1.8% | 1.7%(+0.088)#207 | 2.1%(-0.394)#11,099 |
| 3. | 37069 | 1.4% | 1.7%(-0.260)#259 | 2.1%(-0.741)#13,533 |
1
Common Questions
What are the Top Zip Codes with the Highest Percentage of Population Employed in Architecture & Engineering in Franklin, TN?
Top Zip Codes with the Highest Percentage of Population Employed in Architecture & Engineering in Franklin, TN are:
What zip code has the Highest Percentage of Population Employed in Architecture & Engineering in Franklin, TN?
37064 has the Highest Percentage of Population Employed in Architecture & Engineering in Franklin, TN with 1.8%.
What is the Percentage of Population Employed in Architecture & Engineering in Franklin, TN?
Percentage of Population Employed in Architecture & Engineering in Franklin is 1.8%.
What is the Percentage of Population Employed in Architecture & Engineering in Tennessee?
Percentage of Population Employed in Architecture & Engineering in Tennessee is 1.7%.
What is the Percentage of Population Employed in Architecture & Engineering in the United States?
Percentage of Population Employed in Architecture & Engineering in the United States is 2.1%.