Zip Codes with the Highest Percentage of Population Employed in Life, Physical & Social Science in Franklin, TN
RELATED REPORTS & OPTIONS
Life, Physical & Social Science
Franklin
Compare Zip Codes
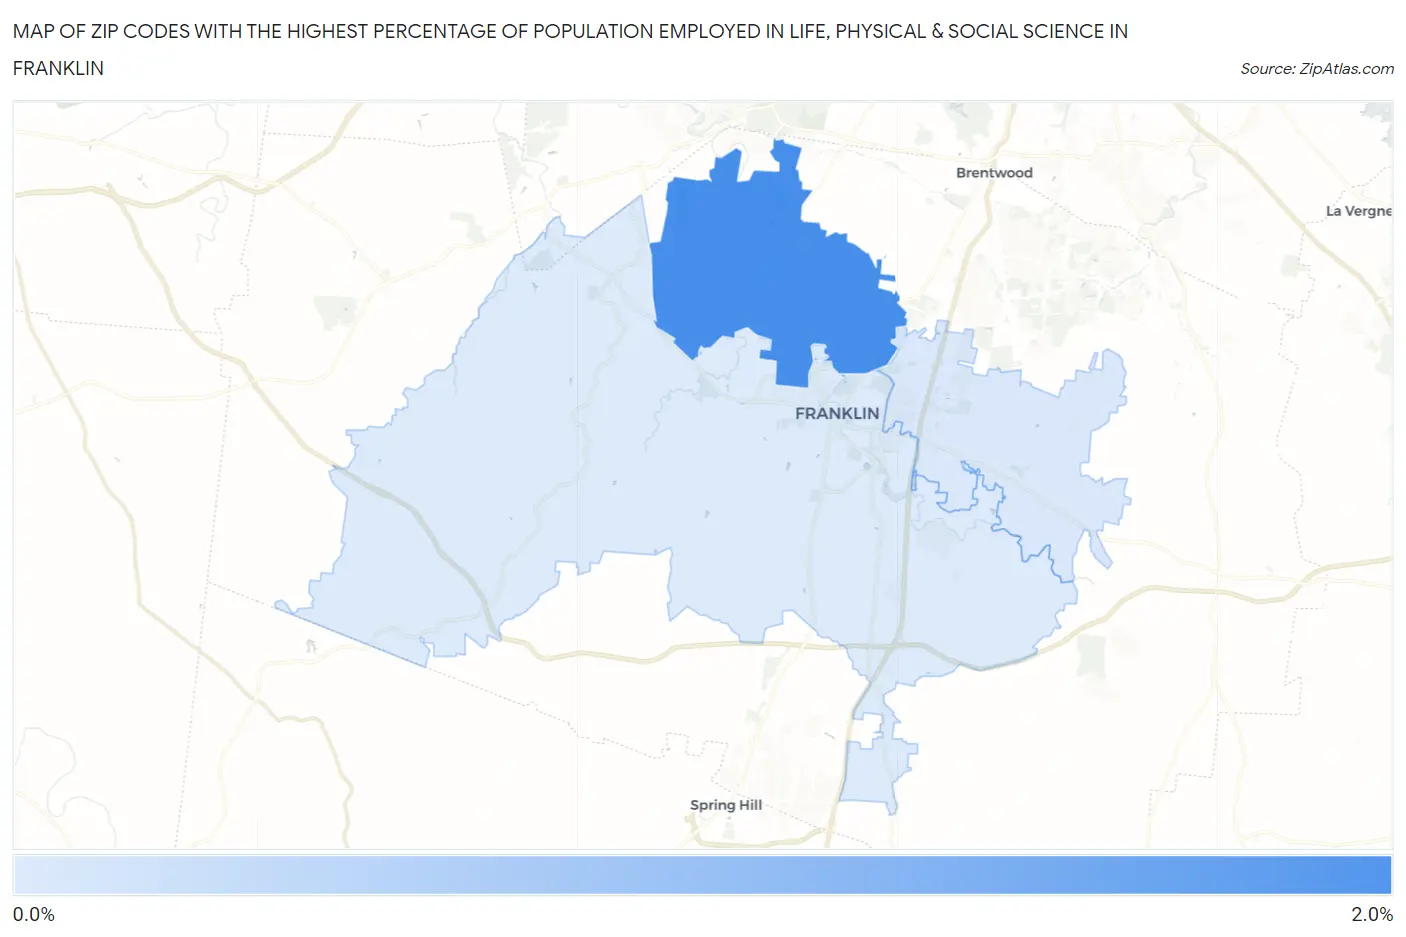
Map of Zip Codes with the Highest Percentage of Population Employed in Life, Physical & Social Science in Franklin
0.95%
1.9%
Zip Codes with the Highest Percentage of Population Employed in Life, Physical & Social Science in Franklin, TN
| Zip Code | % Employed | vs State | vs National | |
| 1. | 37069 | 1.9% | 0.83%(+1.12)#54 | 1.1%(+0.857)#3,837 |
| 2. | 37067 | 0.96% | 0.83%(+0.131)#152 | 1.1%(-0.129)#9,389 |
| 3. | 37064 | 0.95% | 0.83%(+0.120)#155 | 1.1%(-0.140)#9,482 |
1
Common Questions
What are the Top Zip Codes with the Highest Percentage of Population Employed in Life, Physical & Social Science in Franklin, TN?
Top Zip Codes with the Highest Percentage of Population Employed in Life, Physical & Social Science in Franklin, TN are:
What zip code has the Highest Percentage of Population Employed in Life, Physical & Social Science in Franklin, TN?
37069 has the Highest Percentage of Population Employed in Life, Physical & Social Science in Franklin, TN with 1.9%.
What is the Percentage of Population Employed in Life, Physical & Social Science in Franklin, TN?
Percentage of Population Employed in Life, Physical & Social Science in Franklin is 0.89%.
What is the Percentage of Population Employed in Life, Physical & Social Science in Tennessee?
Percentage of Population Employed in Life, Physical & Social Science in Tennessee is 0.83%.
What is the Percentage of Population Employed in Life, Physical & Social Science in the United States?
Percentage of Population Employed in Life, Physical & Social Science in the United States is 1.1%.