Zip Codes with the Highest Percentage of Population Employed in Installation, Maintenance & Repair in Franklin, TN
RELATED REPORTS & OPTIONS
Installation, Maintenance & Repair
Franklin
Compare Zip Codes
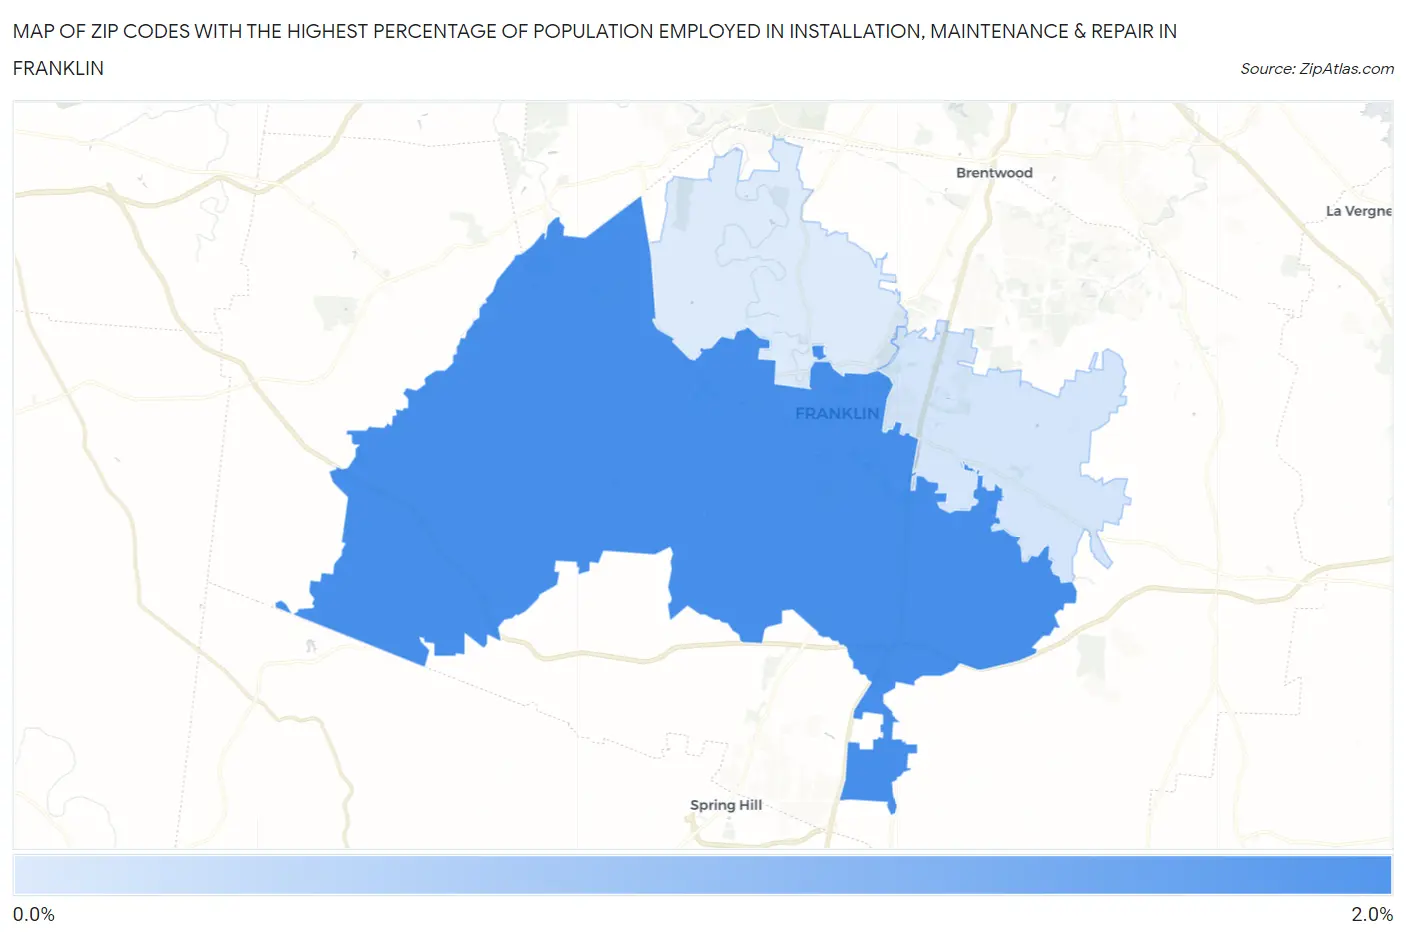
Map of Zip Codes with the Highest Percentage of Population Employed in Installation, Maintenance & Repair in Franklin
0.66%
1.7%
Zip Codes with the Highest Percentage of Population Employed in Installation, Maintenance & Repair in Franklin, TN
| Zip Code | % Employed | vs State | vs National | |
| 1. | 37064 | 1.7% | 3.3%(-1.63)#483 | 3.1%(-1.39)#23,424 |
| 2. | 37067 | 0.73% | 3.3%(-2.58)#535 | 3.1%(-2.34)#26,696 |
| 3. | 37069 | 0.66% | 3.3%(-2.65)#539 | 3.1%(-2.41)#26,884 |
1
Common Questions
What are the Top Zip Codes with the Highest Percentage of Population Employed in Installation, Maintenance & Repair in Franklin, TN?
Top Zip Codes with the Highest Percentage of Population Employed in Installation, Maintenance & Repair in Franklin, TN are:
What zip code has the Highest Percentage of Population Employed in Installation, Maintenance & Repair in Franklin, TN?
37064 has the Highest Percentage of Population Employed in Installation, Maintenance & Repair in Franklin, TN with 1.7%.
What is the Percentage of Population Employed in Installation, Maintenance & Repair in Franklin, TN?
Percentage of Population Employed in Installation, Maintenance & Repair in Franklin is 1.2%.
What is the Percentage of Population Employed in Installation, Maintenance & Repair in Tennessee?
Percentage of Population Employed in Installation, Maintenance & Repair in Tennessee is 3.3%.
What is the Percentage of Population Employed in Installation, Maintenance & Repair in the United States?
Percentage of Population Employed in Installation, Maintenance & Repair in the United States is 3.1%.