Zip Codes with the Highest Percentage of Population Employed in Accommodation & Food Services in Franklin, TN
RELATED REPORTS & OPTIONS
Accommodation & Food Services
Franklin
Compare Zip Codes
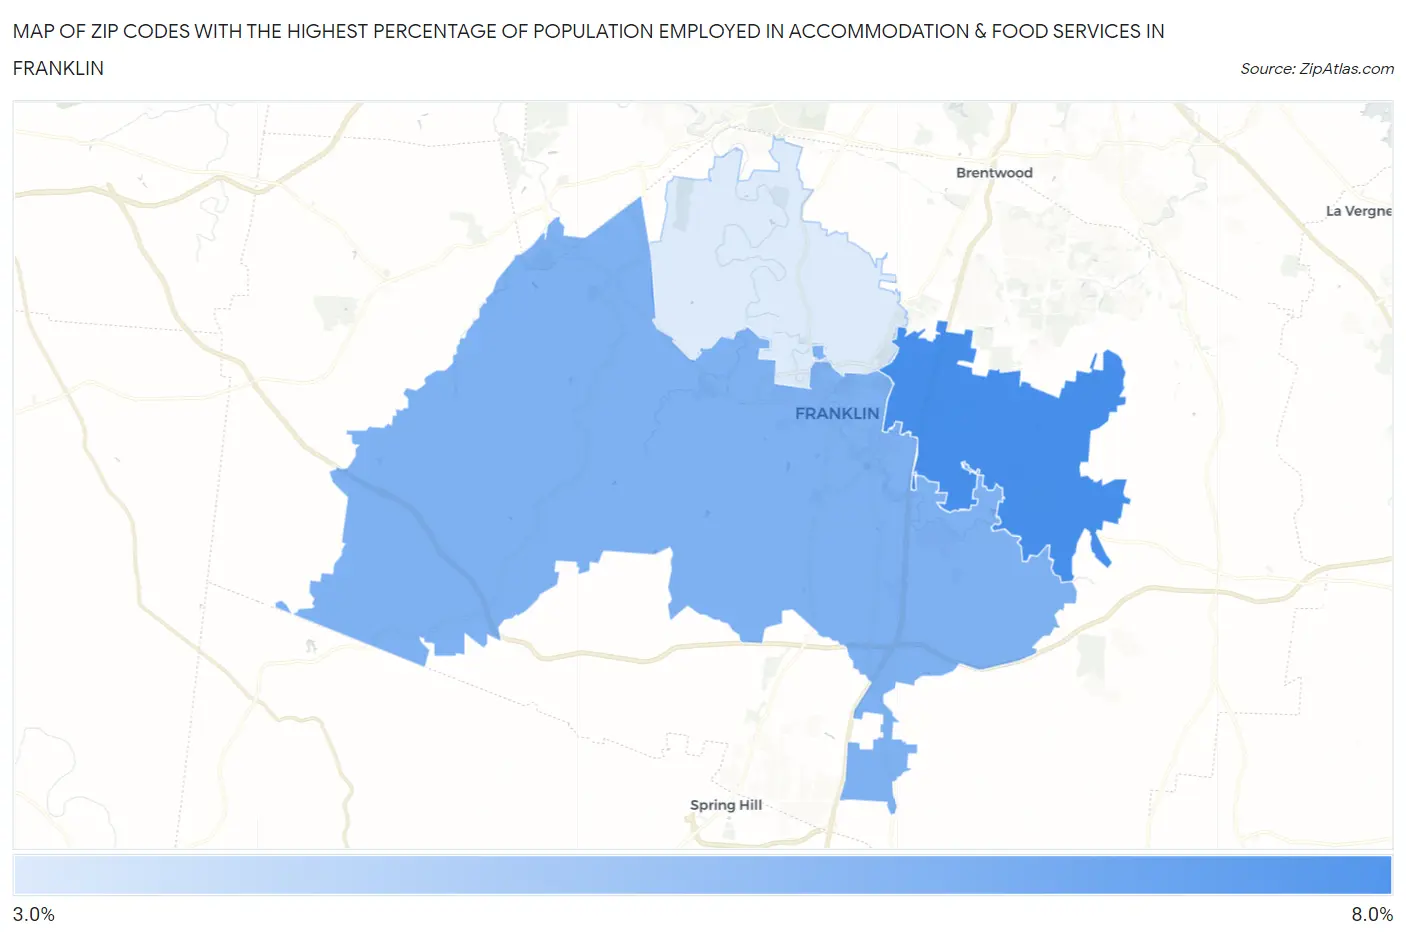
Map of Zip Codes with the Highest Percentage of Population Employed in Accommodation & Food Services in Franklin
3.4%
7.2%
Zip Codes with the Highest Percentage of Population Employed in Accommodation & Food Services in Franklin, TN
| Zip Code | % Employed | vs State | vs National | |
| 1. | 37067 | 7.2% | 7.4%(-0.212)#217 | 6.9%(+0.299)#9,858 |
| 2. | 37064 | 5.8% | 7.4%(-1.62)#312 | 6.9%(-1.11)#14,159 |
| 3. | 37069 | 3.4% | 7.4%(-4.04)#463 | 6.9%(-3.52)#22,220 |
1
Common Questions
What are the Top Zip Codes with the Highest Percentage of Population Employed in Accommodation & Food Services in Franklin, TN?
Top Zip Codes with the Highest Percentage of Population Employed in Accommodation & Food Services in Franklin, TN are:
What zip code has the Highest Percentage of Population Employed in Accommodation & Food Services in Franklin, TN?
37067 has the Highest Percentage of Population Employed in Accommodation & Food Services in Franklin, TN with 7.2%.
What is the Percentage of Population Employed in Accommodation & Food Services in Franklin, TN?
Percentage of Population Employed in Accommodation & Food Services in Franklin is 6.5%.
What is the Percentage of Population Employed in Accommodation & Food Services in Tennessee?
Percentage of Population Employed in Accommodation & Food Services in Tennessee is 7.4%.
What is the Percentage of Population Employed in Accommodation & Food Services in the United States?
Percentage of Population Employed in Accommodation & Food Services in the United States is 6.9%.