Zip Codes with the Highest Percentage of Population Employed in Health Diagnosing & Treating in Pottstown, PA
RELATED REPORTS & OPTIONS
Health Diagnosing & Treating
Pottstown
Compare Zip Codes
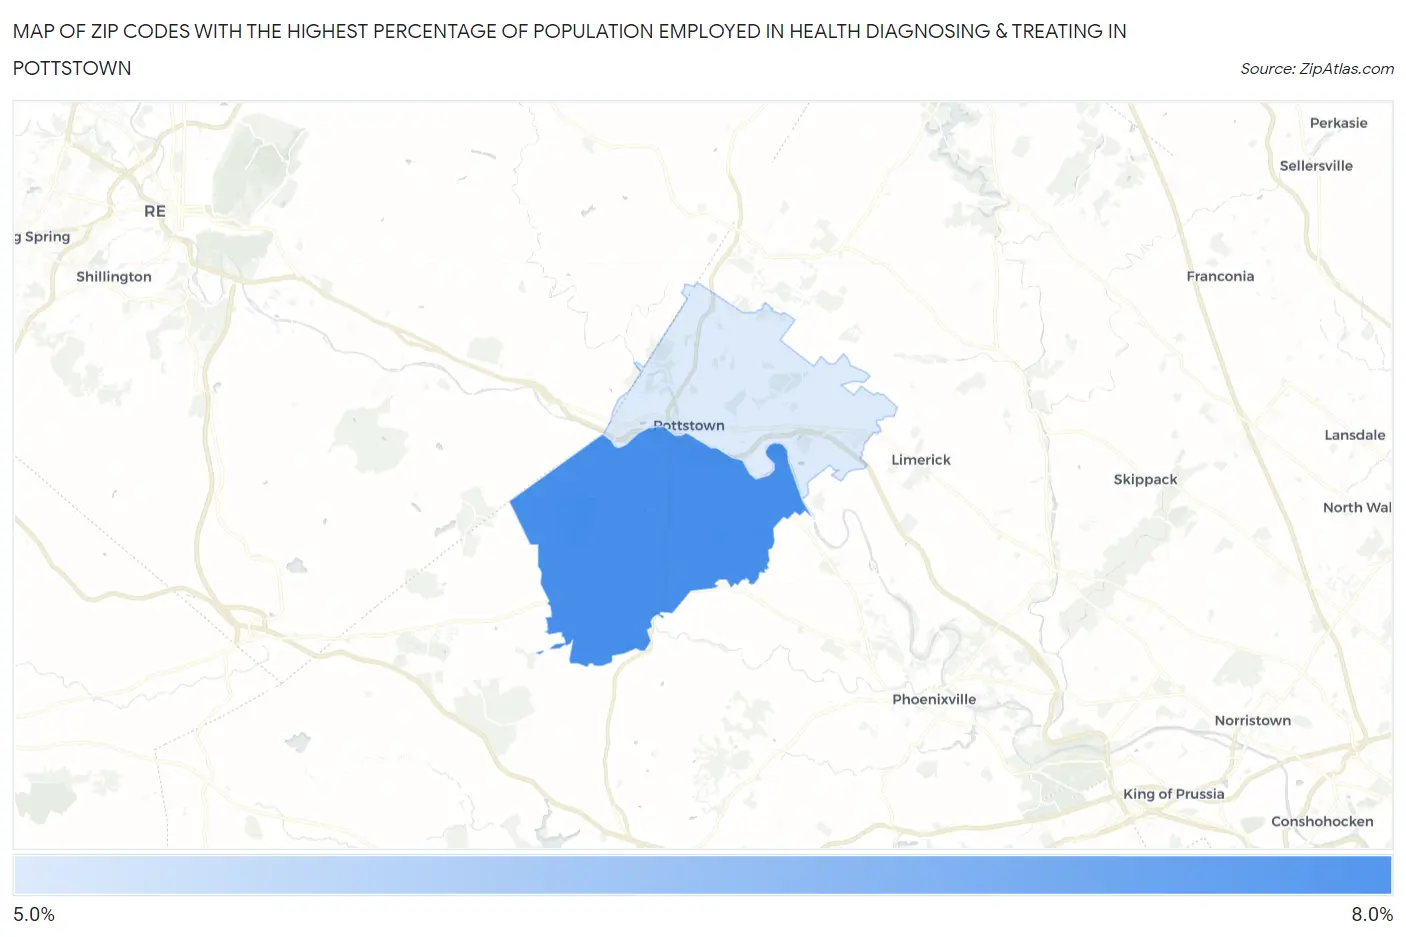
Map of Zip Codes with the Highest Percentage of Population Employed in Health Diagnosing & Treating in Pottstown
5.2%
6.5%
Zip Codes with the Highest Percentage of Population Employed in Health Diagnosing & Treating in Pottstown, PA
| Zip Code | % Employed | vs State | vs National | |
| 1. | 19465 | 6.5% | 7.4%(-0.867)#852 | 6.2%(+0.239)#12,080 |
| 2. | 19464 | 5.2% | 7.4%(-2.15)#1,126 | 6.2%(-1.04)#16,929 |
1
Common Questions
What are the Top Zip Codes with the Highest Percentage of Population Employed in Health Diagnosing & Treating in Pottstown, PA?
Top Zip Codes with the Highest Percentage of Population Employed in Health Diagnosing & Treating in Pottstown, PA are:
What zip code has the Highest Percentage of Population Employed in Health Diagnosing & Treating in Pottstown, PA?
19465 has the Highest Percentage of Population Employed in Health Diagnosing & Treating in Pottstown, PA with 6.5%.
What is the Percentage of Population Employed in Health Diagnosing & Treating in Pennsylvania?
Percentage of Population Employed in Health Diagnosing & Treating in Pennsylvania is 7.4%.
What is the Percentage of Population Employed in Health Diagnosing & Treating in the United States?
Percentage of Population Employed in Health Diagnosing & Treating in the United States is 6.2%.