Zip Codes with the Highest Percentage of Population Employed in Health Diagnosing & Treating in New Castle, PA
RELATED REPORTS & OPTIONS
Health Diagnosing & Treating
New Castle
Compare Zip Codes
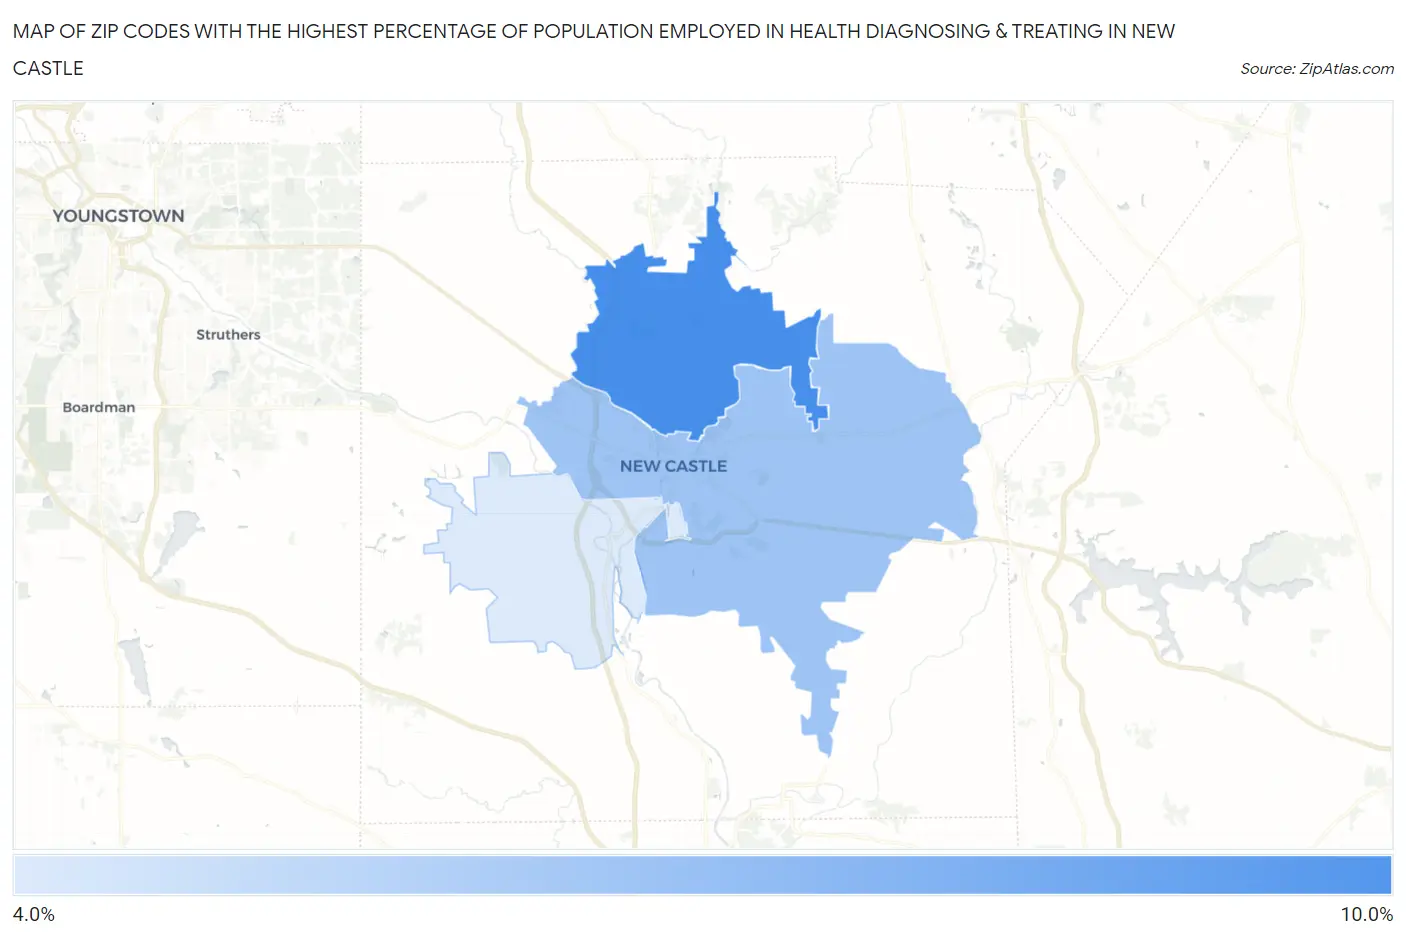
Map of Zip Codes with the Highest Percentage of Population Employed in Health Diagnosing & Treating in New Castle
4.1%
8.1%
Zip Codes with the Highest Percentage of Population Employed in Health Diagnosing & Treating in New Castle, PA
| Zip Code | % Employed | vs State | vs National | |
| 1. | 16105 | 8.1% | 7.4%(+0.737)#535 | 6.2%(+1.84)#7,285 |
| 2. | 16101 | 5.7% | 7.4%(-1.63)#1,018 | 6.2%(-0.526)#14,913 |
| 3. | 16102 | 4.1% | 7.4%(-3.26)#1,304 | 6.2%(-2.15)#21,069 |
1
Common Questions
What are the Top Zip Codes with the Highest Percentage of Population Employed in Health Diagnosing & Treating in New Castle, PA?
Top Zip Codes with the Highest Percentage of Population Employed in Health Diagnosing & Treating in New Castle, PA are:
What zip code has the Highest Percentage of Population Employed in Health Diagnosing & Treating in New Castle, PA?
16105 has the Highest Percentage of Population Employed in Health Diagnosing & Treating in New Castle, PA with 8.1%.
What is the Percentage of Population Employed in Health Diagnosing & Treating in New Castle, PA?
Percentage of Population Employed in Health Diagnosing & Treating in New Castle is 4.8%.
What is the Percentage of Population Employed in Health Diagnosing & Treating in Pennsylvania?
Percentage of Population Employed in Health Diagnosing & Treating in Pennsylvania is 7.4%.
What is the Percentage of Population Employed in Health Diagnosing & Treating in the United States?
Percentage of Population Employed in Health Diagnosing & Treating in the United States is 6.2%.