Zip Codes with the Highest Percentage of Population Employed in Health Diagnosing & Treating in Genesee, PA
RELATED REPORTS & OPTIONS
Health Diagnosing & Treating
Genesee
Compare Zip Codes
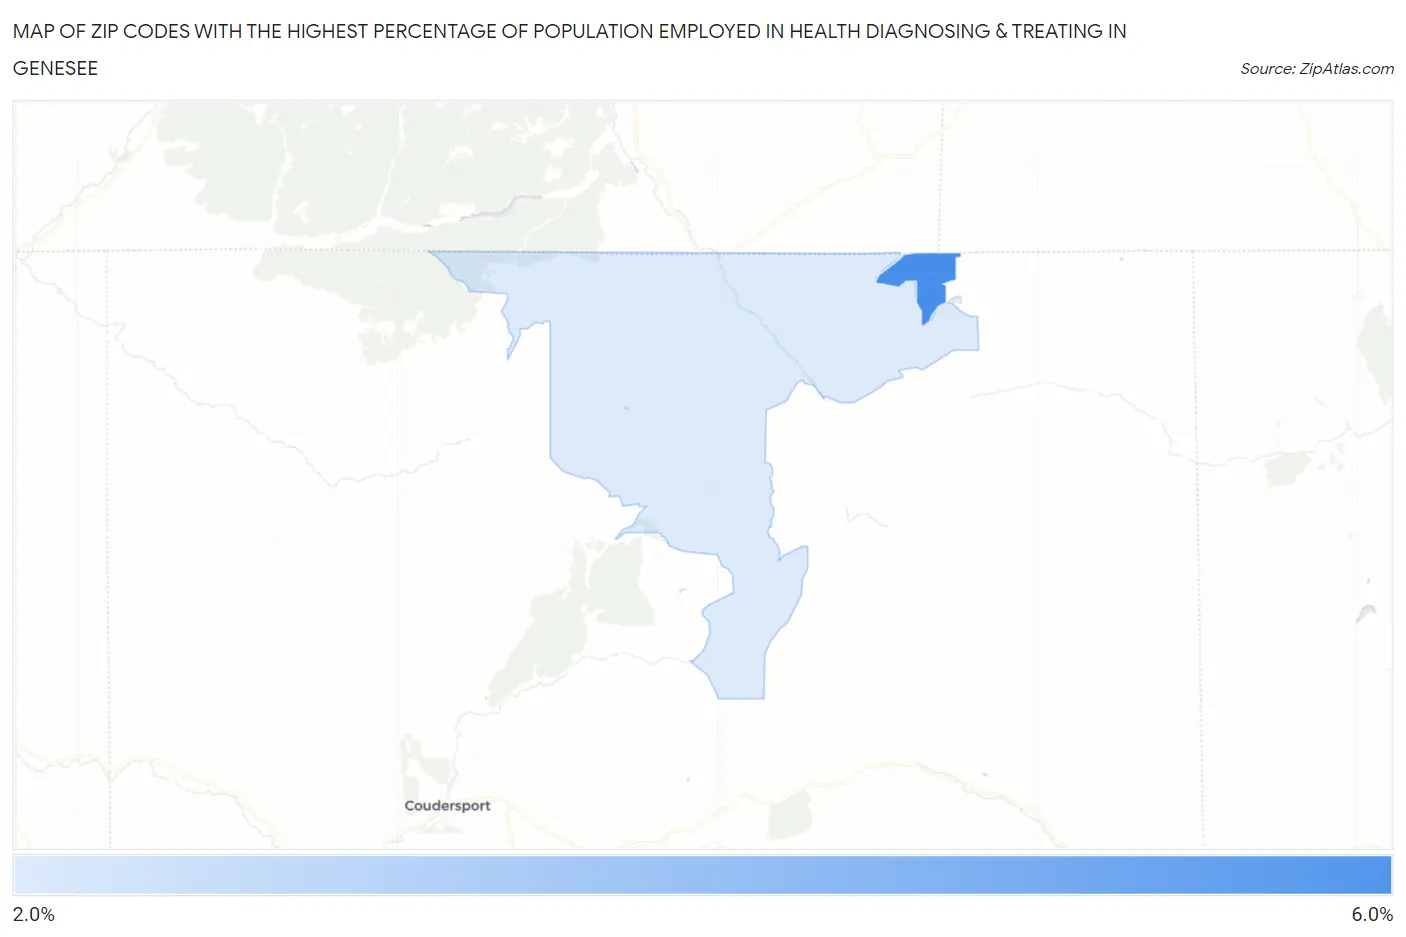
Map of Zip Codes with the Highest Percentage of Population Employed in Health Diagnosing & Treating in Genesee
2.8%
5.9%
Zip Codes with the Highest Percentage of Population Employed in Health Diagnosing & Treating in Genesee, PA
| Zip Code | % Employed | vs State | vs National | |
| 1. | 16941 | 5.9% | 7.4%(-1.47)#979 | 6.2%(-0.363)#14,305 |
| 2. | 16923 | 2.8% | 7.4%(-4.55)#1,447 | 6.2%(-3.44)#24,818 |
1
Common Questions
What are the Top Zip Codes with the Highest Percentage of Population Employed in Health Diagnosing & Treating in Genesee, PA?
Top Zip Codes with the Highest Percentage of Population Employed in Health Diagnosing & Treating in Genesee, PA are:
What zip code has the Highest Percentage of Population Employed in Health Diagnosing & Treating in Genesee, PA?
16941 has the Highest Percentage of Population Employed in Health Diagnosing & Treating in Genesee, PA with 5.9%.
What is the Percentage of Population Employed in Health Diagnosing & Treating in Pennsylvania?
Percentage of Population Employed in Health Diagnosing & Treating in Pennsylvania is 7.4%.
What is the Percentage of Population Employed in Health Diagnosing & Treating in the United States?
Percentage of Population Employed in Health Diagnosing & Treating in the United States is 6.2%.