Zip Codes with the Highest Percentage of Population Employed in Health Diagnosing & Treating in State College, PA
RELATED REPORTS & OPTIONS
Health Diagnosing & Treating
State College
Compare Zip Codes
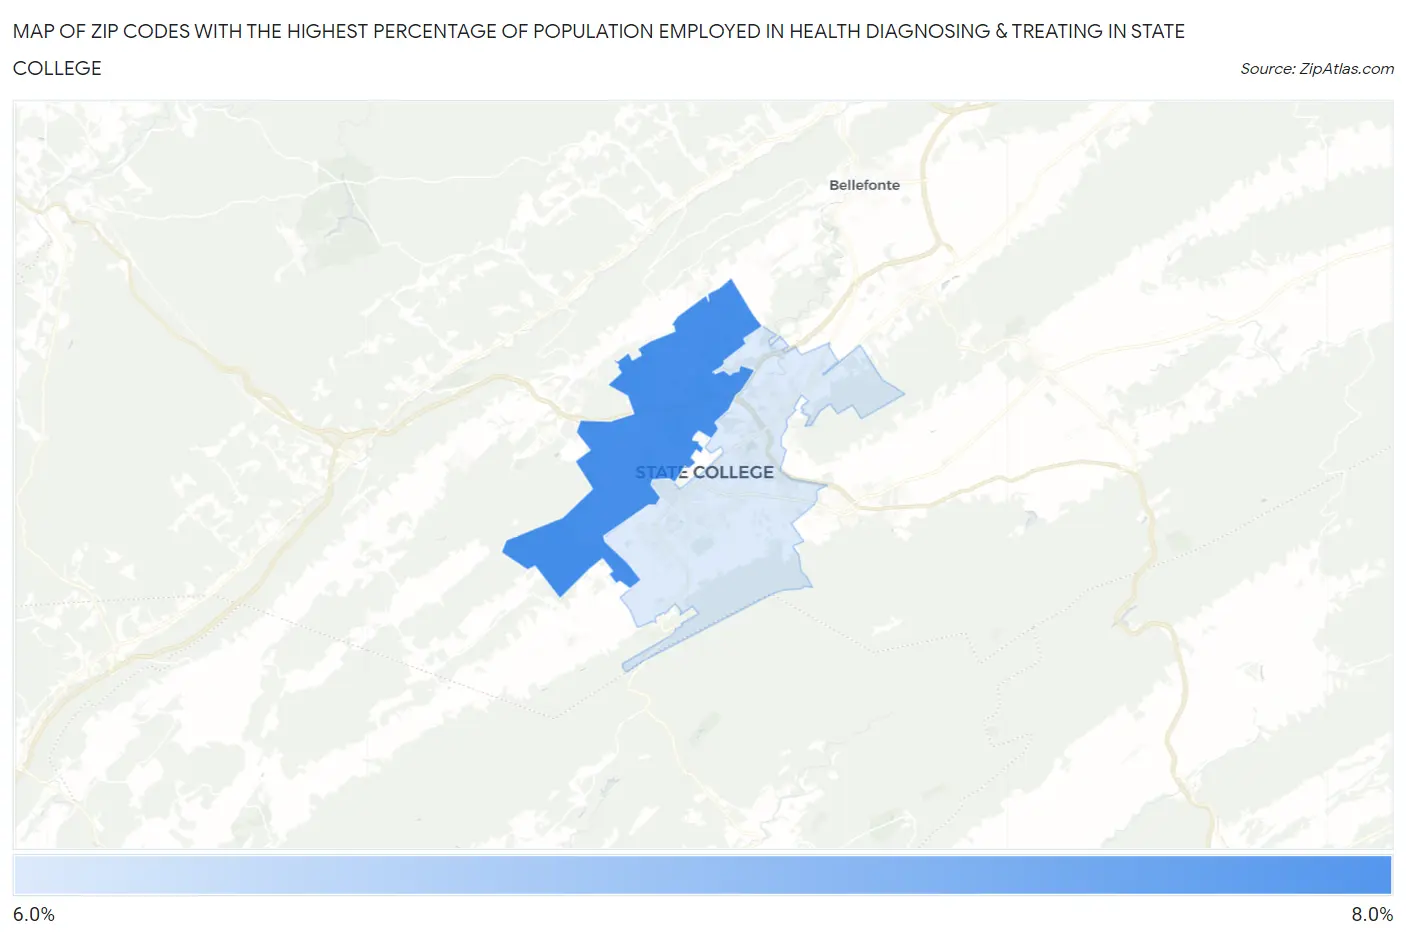
Map of Zip Codes with the Highest Percentage of Population Employed in Health Diagnosing & Treating in State College
6.2%
6.9%
Zip Codes with the Highest Percentage of Population Employed in Health Diagnosing & Treating in State College, PA
| Zip Code | % Employed | vs State | vs National | |
| 1. | 16803 | 6.9% | 7.4%(-0.501)#767 | 6.2%(+0.605)#10,834 |
| 2. | 16801 | 6.2% | 7.4%(-1.17)#917 | 6.2%(-0.064)#13,226 |
1
Common Questions
What are the Top Zip Codes with the Highest Percentage of Population Employed in Health Diagnosing & Treating in State College, PA?
Top Zip Codes with the Highest Percentage of Population Employed in Health Diagnosing & Treating in State College, PA are:
What zip code has the Highest Percentage of Population Employed in Health Diagnosing & Treating in State College, PA?
16803 has the Highest Percentage of Population Employed in Health Diagnosing & Treating in State College, PA with 6.9%.
What is the Percentage of Population Employed in Health Diagnosing & Treating in Pennsylvania?
Percentage of Population Employed in Health Diagnosing & Treating in Pennsylvania is 7.4%.
What is the Percentage of Population Employed in Health Diagnosing & Treating in the United States?
Percentage of Population Employed in Health Diagnosing & Treating in the United States is 6.2%.