Zip Codes with the Highest Percentage of Population Employed in Health Diagnosing & Treating in Philadelphia, PA
RELATED REPORTS & OPTIONS
Health Diagnosing & Treating
Philadelphia
Compare Zip Codes
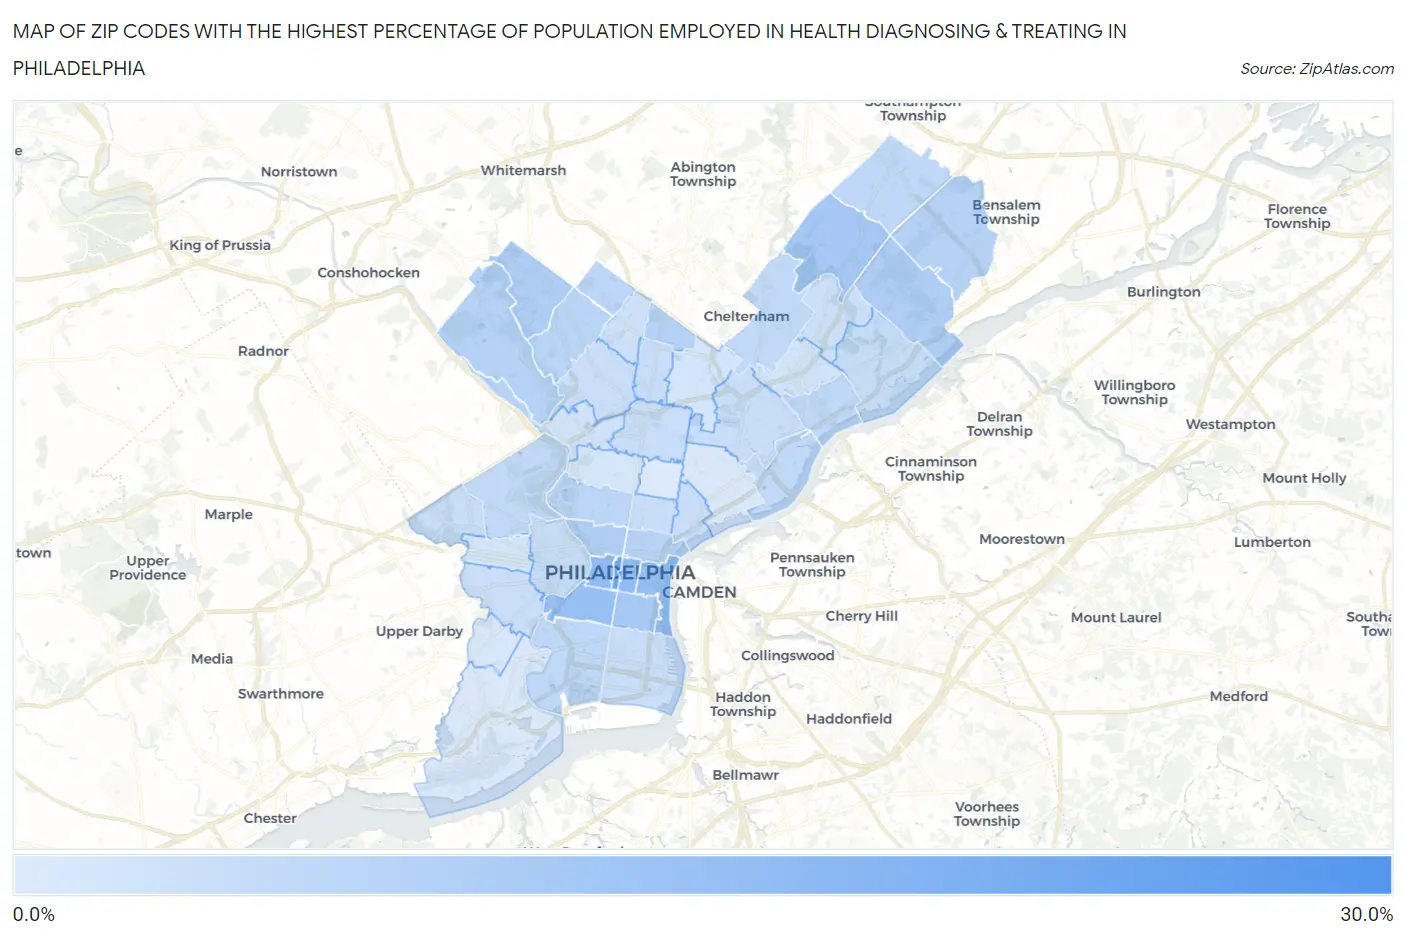
Map of Zip Codes with the Highest Percentage of Population Employed in Health Diagnosing & Treating in Philadelphia
2.7%
29.0%
Zip Codes with the Highest Percentage of Population Employed in Health Diagnosing & Treating in Philadelphia, PA
| Zip Code | % Employed | vs State | vs National | |
| 1. | 19108 | 29.0% | 7.4%(+21.6)#11 | 6.2%(+22.7)#241 |
| 2. | 19102 | 21.4% | 7.4%(+14.1)#32 | 6.2%(+15.2)#461 |
| 3. | 19107 | 15.4% | 7.4%(+8.07)#71 | 6.2%(+9.18)#1,054 |
| 4. | 19103 | 14.8% | 7.4%(+7.40)#76 | 6.2%(+8.51)#1,205 |
| 5. | 19106 | 14.6% | 7.4%(+7.27)#82 | 6.2%(+8.38)#1,234 |
| 6. | 19146 | 14.2% | 7.4%(+6.80)#95 | 6.2%(+7.91)#1,369 |
| 7. | 19115 | 11.8% | 7.4%(+4.50)#165 | 6.2%(+5.60)#2,303 |
| 8. | 19147 | 11.3% | 7.4%(+3.96)#194 | 6.2%(+5.06)#2,655 |
| 9. | 19118 | 10.2% | 7.4%(+2.80)#275 | 6.2%(+3.91)#3,692 |
| 10. | 19130 | 10.1% | 7.4%(+2.77)#280 | 6.2%(+3.87)#3,739 |
| 11. | 19114 | 10.1% | 7.4%(+2.76)#282 | 6.2%(+3.86)#3,751 |
| 12. | 19154 | 9.1% | 7.4%(+1.74)#377 | 6.2%(+2.85)#5,186 |
| 13. | 19126 | 9.1% | 7.4%(+1.72)#380 | 6.2%(+2.83)#5,235 |
| 14. | 19128 | 9.0% | 7.4%(+1.69)#383 | 6.2%(+2.80)#5,293 |
| 15. | 19123 | 8.6% | 7.4%(+1.28)#450 | 6.2%(+2.38)#6,081 |
| 16. | 19127 | 8.3% | 7.4%(+0.914)#505 | 6.2%(+2.02)#6,855 |
| 17. | 19119 | 8.2% | 7.4%(+0.842)#513 | 6.2%(+1.95)#7,027 |
| 18. | 19150 | 7.8% | 7.4%(+0.437)#589 | 6.2%(+1.54)#8,030 |
| 19. | 19121 | 7.7% | 7.4%(+0.323)#605 | 6.2%(+1.43)#8,313 |
| 20. | 19116 | 7.5% | 7.4%(+0.176)#632 | 6.2%(+1.28)#8,733 |
| 21. | 19135 | 7.5% | 7.4%(+0.139)#644 | 6.2%(+1.25)#8,857 |
| 22. | 19145 | 7.4% | 7.4%(+0.071)#659 | 6.2%(+1.18)#9,052 |
| 23. | 19137 | 7.1% | 7.4%(-0.238)#710 | 6.2%(+0.868)#9,989 |
| 24. | 19111 | 7.0% | 7.4%(-0.313)#721 | 6.2%(+0.793)#10,239 |
| 25. | 19131 | 6.9% | 7.4%(-0.430)#748 | 6.2%(+0.676)#10,615 |
| 26. | 19136 | 6.4% | 7.4%(-0.901)#857 | 6.2%(+0.205)#12,208 |
| 27. | 19104 | 6.4% | 7.4%(-0.998)#882 | 6.2%(+0.108)#12,556 |
| 28. | 19151 | 6.1% | 7.4%(-1.27)#944 | 6.2%(-0.167)#13,587 |
| 29. | 19124 | 6.1% | 7.4%(-1.28)#945 | 6.2%(-0.176)#13,616 |
| 30. | 19148 | 6.0% | 7.4%(-1.31)#951 | 6.2%(-0.202)#13,727 |
| 31. | 19140 | 6.0% | 7.4%(-1.37)#960 | 6.2%(-0.266)#13,950 |
| 32. | 19122 | 5.9% | 7.4%(-1.50)#987 | 6.2%(-0.390)#14,399 |
| 33. | 19125 | 5.8% | 7.4%(-1.54)#1,000 | 6.2%(-0.436)#14,580 |
| 34. | 19141 | 5.8% | 7.4%(-1.54)#1,001 | 6.2%(-0.438)#14,589 |
| 35. | 19144 | 5.5% | 7.4%(-1.87)#1,074 | 6.2%(-0.762)#15,851 |
| 36. | 19143 | 5.5% | 7.4%(-1.88)#1,075 | 6.2%(-0.772)#15,883 |
| 37. | 19152 | 5.2% | 7.4%(-2.19)#1,133 | 6.2%(-1.09)#17,079 |
| 38. | 19138 | 4.7% | 7.4%(-2.66)#1,230 | 6.2%(-1.55)#18,880 |
| 39. | 19129 | 4.6% | 7.4%(-2.72)#1,238 | 6.2%(-1.62)#19,148 |
| 40. | 19149 | 4.4% | 7.4%(-2.98)#1,279 | 6.2%(-1.87)#20,079 |
| 41. | 19120 | 4.2% | 7.4%(-3.19)#1,299 | 6.2%(-2.08)#20,846 |
| 42. | 19139 | 4.1% | 7.4%(-3.28)#1,307 | 6.2%(-2.17)#21,135 |
| 43. | 19132 | 3.8% | 7.4%(-3.57)#1,341 | 6.2%(-2.47)#22,057 |
| 44. | 19134 | 3.4% | 7.4%(-3.91)#1,385 | 6.2%(-2.81)#23,089 |
| 45. | 19142 | 3.2% | 7.4%(-4.10)#1,405 | 6.2%(-2.99)#23,640 |
| 46. | 19153 | 3.2% | 7.4%(-4.18)#1,417 | 6.2%(-3.08)#23,873 |
| 47. | 19133 | 2.7% | 7.4%(-4.68)#1,459 | 6.2%(-3.57)#25,121 |
1
Common Questions
What are the Top 10 Zip Codes with the Highest Percentage of Population Employed in Health Diagnosing & Treating in Philadelphia, PA?
Top 10 Zip Codes with the Highest Percentage of Population Employed in Health Diagnosing & Treating in Philadelphia, PA are:
What zip code has the Highest Percentage of Population Employed in Health Diagnosing & Treating in Philadelphia, PA?
19108 has the Highest Percentage of Population Employed in Health Diagnosing & Treating in Philadelphia, PA with 29.0%.
What is the Percentage of Population Employed in Health Diagnosing & Treating in Philadelphia, PA?
Percentage of Population Employed in Health Diagnosing & Treating in Philadelphia is 7.4%.
What is the Percentage of Population Employed in Health Diagnosing & Treating in Pennsylvania?
Percentage of Population Employed in Health Diagnosing & Treating in Pennsylvania is 7.4%.
What is the Percentage of Population Employed in Health Diagnosing & Treating in the United States?
Percentage of Population Employed in Health Diagnosing & Treating in the United States is 6.2%.