Zip Codes with the Highest Percentage of Population Employed in Health Diagnosing & Treating in Lancaster, PA
RELATED REPORTS & OPTIONS
Health Diagnosing & Treating
Lancaster
Compare Zip Codes
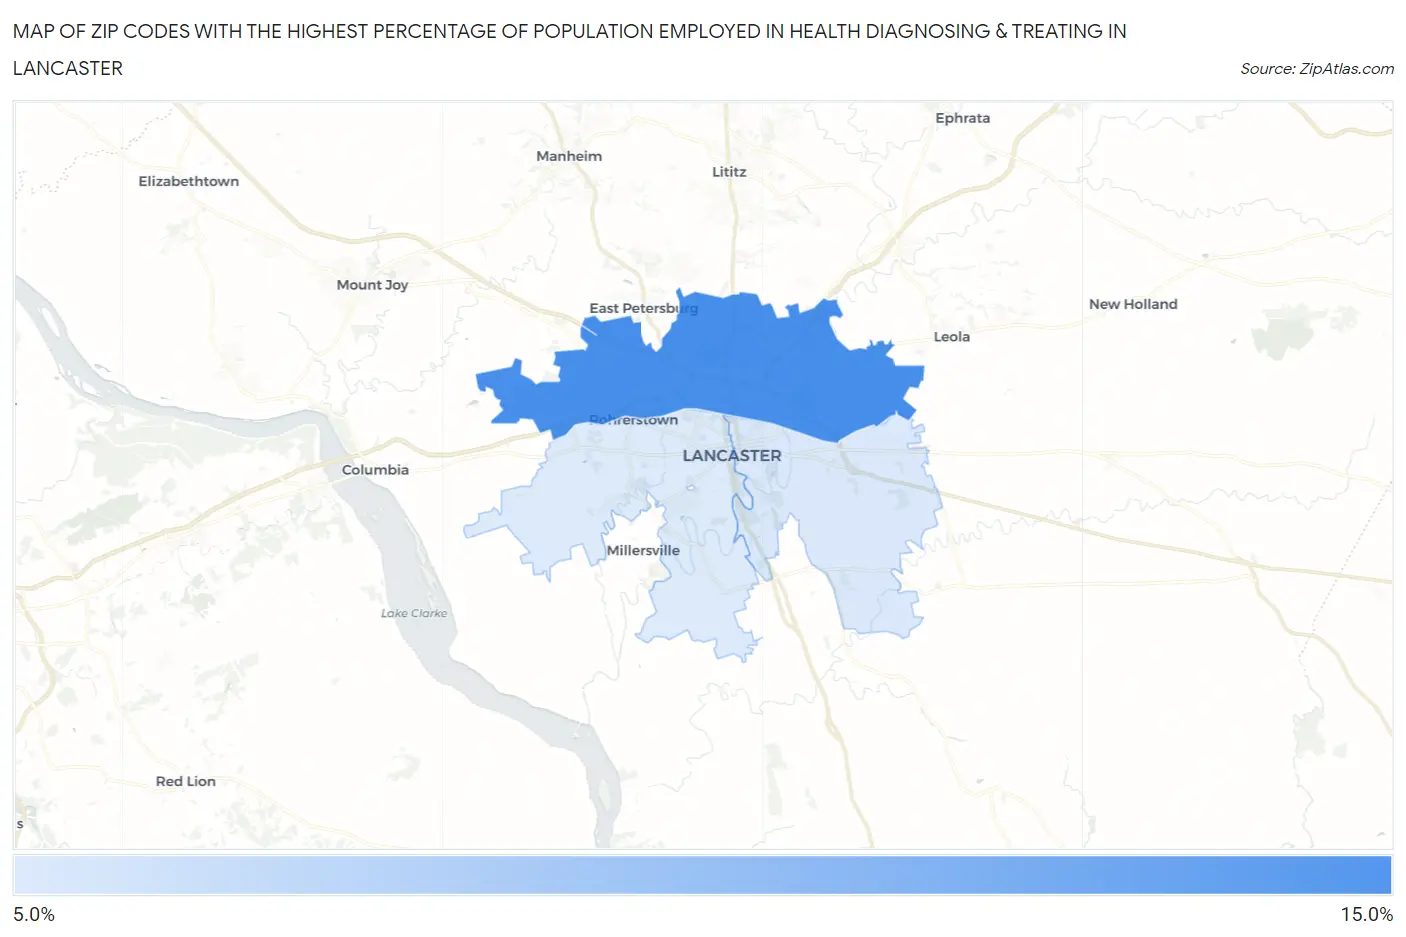
Map of Zip Codes with the Highest Percentage of Population Employed in Health Diagnosing & Treating in Lancaster
6.4%
10.2%
Zip Codes with the Highest Percentage of Population Employed in Health Diagnosing & Treating in Lancaster, PA
| Zip Code | % Employed | vs State | vs National | |
| 1. | 17601 | 10.2% | 7.4%(+2.82)#274 | 6.2%(+3.93)#3,672 |
| 2. | 17602 | 6.4% | 7.4%(-0.924)#863 | 6.2%(+0.182)#12,283 |
| 3. | 17603 | 6.4% | 7.4%(-0.982)#877 | 6.2%(+0.124)#12,512 |
1
Common Questions
What are the Top Zip Codes with the Highest Percentage of Population Employed in Health Diagnosing & Treating in Lancaster, PA?
Top Zip Codes with the Highest Percentage of Population Employed in Health Diagnosing & Treating in Lancaster, PA are:
What zip code has the Highest Percentage of Population Employed in Health Diagnosing & Treating in Lancaster, PA?
17601 has the Highest Percentage of Population Employed in Health Diagnosing & Treating in Lancaster, PA with 10.2%.
What is the Percentage of Population Employed in Health Diagnosing & Treating in Lancaster, PA?
Percentage of Population Employed in Health Diagnosing & Treating in Lancaster is 4.8%.
What is the Percentage of Population Employed in Health Diagnosing & Treating in Pennsylvania?
Percentage of Population Employed in Health Diagnosing & Treating in Pennsylvania is 7.4%.
What is the Percentage of Population Employed in Health Diagnosing & Treating in the United States?
Percentage of Population Employed in Health Diagnosing & Treating in the United States is 6.2%.