Zip Codes with the Highest Percentage of Population with a Degree in Physical and Health Sciences in Philadelphia, PA
RELATED REPORTS & OPTIONS
Physical and Health Sciences
Philadelphia
Compare Zip Codes
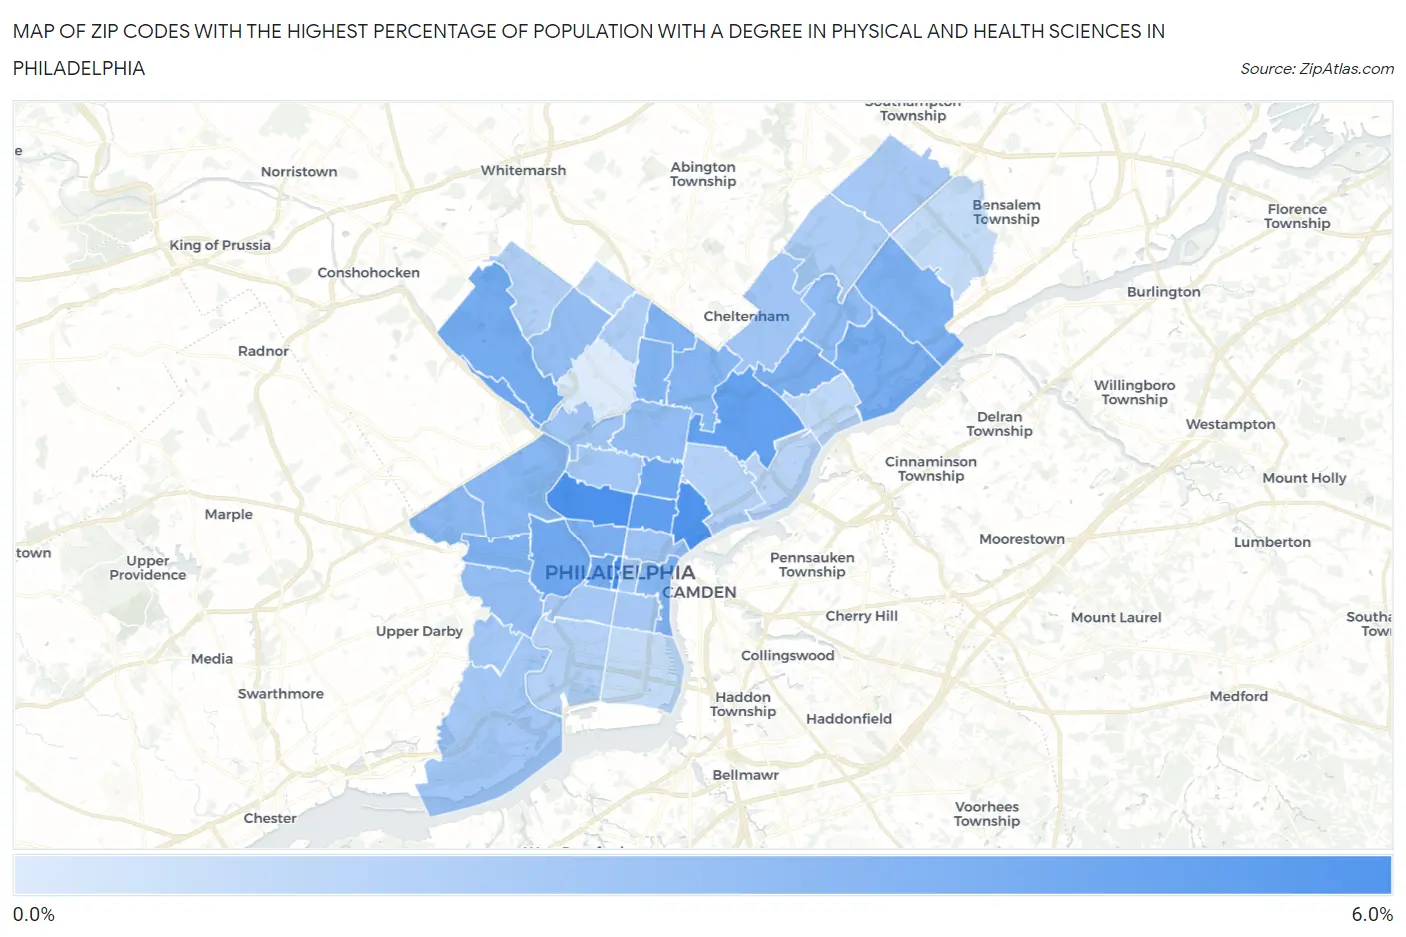
Map of Zip Codes with the Highest Percentage of Population with a Degree in Physical and Health Sciences in Philadelphia
0.59%
5.8%
Zip Codes with the Highest Percentage of Population with a Degree in Physical and Health Sciences in Philadelphia, PA
| Zip Code | % Graduates | vs State | vs National | |
| 1. | 19102 | 5.8% | 3.3%(+2.52)#186 | 3.1%(+2.70)#3,469 |
| 2. | 19121 | 5.6% | 3.3%(+2.33)#207 | 3.1%(+2.50)#3,684 |
| 3. | 19125 | 5.5% | 3.3%(+2.26)#215 | 3.1%(+2.44)#3,774 |
| 4. | 19122 | 4.9% | 3.3%(+1.59)#273 | 3.1%(+1.76)#4,798 |
| 5. | 19124 | 4.8% | 3.3%(+1.52)#278 | 3.1%(+1.70)#4,919 |
| 6. | 19133 | 4.4% | 3.3%(+1.15)#318 | 3.1%(+1.33)#5,687 |
| 7. | 19127 | 4.4% | 3.3%(+1.14)#321 | 3.1%(+1.31)#5,724 |
| 8. | 19104 | 4.4% | 3.3%(+1.08)#329 | 3.1%(+1.26)#5,839 |
| 9. | 19103 | 4.3% | 3.3%(+1.01)#340 | 3.1%(+1.19)#5,980 |
| 10. | 19128 | 4.1% | 3.3%(+0.856)#373 | 3.1%(+1.03)#6,370 |
| 11. | 19136 | 4.1% | 3.3%(+0.837)#376 | 3.1%(+1.01)#6,423 |
| 12. | 19149 | 4.0% | 3.3%(+0.752)#383 | 3.1%(+0.930)#6,662 |
| 13. | 19130 | 4.0% | 3.3%(+0.748)#386 | 3.1%(+0.926)#6,672 |
| 14. | 19139 | 3.9% | 3.3%(+0.607)#409 | 3.1%(+0.785)#7,092 |
| 15. | 19114 | 3.8% | 3.3%(+0.564)#412 | 3.1%(+0.742)#7,222 |
| 16. | 19141 | 3.8% | 3.3%(+0.497)#432 | 3.1%(+0.675)#7,442 |
| 17. | 19126 | 3.7% | 3.3%(+0.461)#441 | 3.1%(+0.639)#7,572 |
| 18. | 19120 | 3.6% | 3.3%(+0.351)#465 | 3.1%(+0.529)#7,957 |
| 19. | 19106 | 3.5% | 3.3%(+0.266)#481 | 3.1%(+0.444)#8,266 |
| 20. | 19131 | 3.5% | 3.3%(+0.252)#487 | 3.1%(+0.430)#8,314 |
| 21. | 19151 | 3.5% | 3.3%(+0.184)#500 | 3.1%(+0.362)#8,580 |
| 22. | 19152 | 3.3% | 3.3%(-0.005)#535 | 3.1%(+0.173)#9,289 |
| 23. | 19140 | 3.2% | 3.3%(-0.087)#553 | 3.1%(+0.091)#9,620 |
| 24. | 19143 | 3.1% | 3.3%(-0.139)#566 | 3.1%(+0.039)#9,819 |
| 25. | 19119 | 3.1% | 3.3%(-0.178)#572 | 3.1%(-0.000)#9,978 |
| 26. | 19123 | 2.9% | 3.3%(-0.368)#623 | 3.1%(-0.190)#10,815 |
| 27. | 19129 | 2.7% | 3.3%(-0.590)#665 | 3.1%(-0.412)#11,845 |
| 28. | 19111 | 2.6% | 3.3%(-0.667)#681 | 3.1%(-0.489)#12,186 |
| 29. | 19107 | 2.6% | 3.3%(-0.722)#693 | 3.1%(-0.544)#12,470 |
| 30. | 19153 | 2.5% | 3.3%(-0.735)#697 | 3.1%(-0.557)#12,526 |
| 31. | 19132 | 2.5% | 3.3%(-0.736)#698 | 3.1%(-0.558)#12,529 |
| 32. | 19142 | 2.5% | 3.3%(-0.751)#702 | 3.1%(-0.574)#12,603 |
| 33. | 19116 | 2.5% | 3.3%(-0.775)#708 | 3.1%(-0.598)#12,728 |
| 34. | 19147 | 2.5% | 3.3%(-0.821)#719 | 3.1%(-0.643)#12,933 |
| 35. | 19146 | 2.5% | 3.3%(-0.826)#723 | 3.1%(-0.648)#12,961 |
| 36. | 19115 | 2.2% | 3.3%(-1.03)#783 | 3.1%(-0.857)#13,954 |
| 37. | 19138 | 2.2% | 3.3%(-1.11)#797 | 3.1%(-0.928)#14,270 |
| 38. | 19118 | 2.1% | 3.3%(-1.19)#817 | 3.1%(-1.01)#14,679 |
| 39. | 19134 | 2.0% | 3.3%(-1.25)#833 | 3.1%(-1.07)#14,975 |
| 40. | 19145 | 2.0% | 3.3%(-1.30)#845 | 3.1%(-1.12)#15,215 |
| 41. | 19137 | 1.8% | 3.3%(-1.43)#876 | 3.1%(-1.25)#15,792 |
| 42. | 19150 | 1.8% | 3.3%(-1.52)#892 | 3.1%(-1.34)#16,186 |
| 43. | 19135 | 1.6% | 3.3%(-1.65)#913 | 3.1%(-1.47)#16,756 |
| 44. | 19148 | 1.5% | 3.3%(-1.79)#944 | 3.1%(-1.62)#17,367 |
| 45. | 19154 | 1.5% | 3.3%(-1.81)#948 | 3.1%(-1.63)#17,432 |
| 46. | 19144 | 0.59% | 3.3%(-2.69)#1,095 | 3.1%(-2.51)#20,414 |
1
Common Questions
What are the Top 10 Zip Codes with the Highest Percentage of Population with a Degree in Physical and Health Sciences in Philadelphia, PA?
Top 10 Zip Codes with the Highest Percentage of Population with a Degree in Physical and Health Sciences in Philadelphia, PA are:
What zip code has the Highest Percentage of Population with a Degree in Physical and Health Sciences in Philadelphia, PA?
19102 has the Highest Percentage of Population with a Degree in Physical and Health Sciences in Philadelphia, PA with 5.8%.
What is the Percentage of Population with a Degree in Physical and Health Sciences in Philadelphia, PA?
Percentage of Population with a Degree in Physical and Health Sciences in Philadelphia is 3.2%.
What is the Percentage of Population with a Degree in Physical and Health Sciences in Pennsylvania?
Percentage of Population with a Degree in Physical and Health Sciences in Pennsylvania is 3.3%.
What is the Percentage of Population with a Degree in Physical and Health Sciences in the United States?
Percentage of Population with a Degree in Physical and Health Sciences in the United States is 3.1%.