Zip Codes with the Highest Percentage of Population Employed in Agriculture, Fishing & Hunting in Chambersburg, PA
RELATED REPORTS & OPTIONS
Agriculture, Fishing & Hunting
Chambersburg
Compare Zip Codes
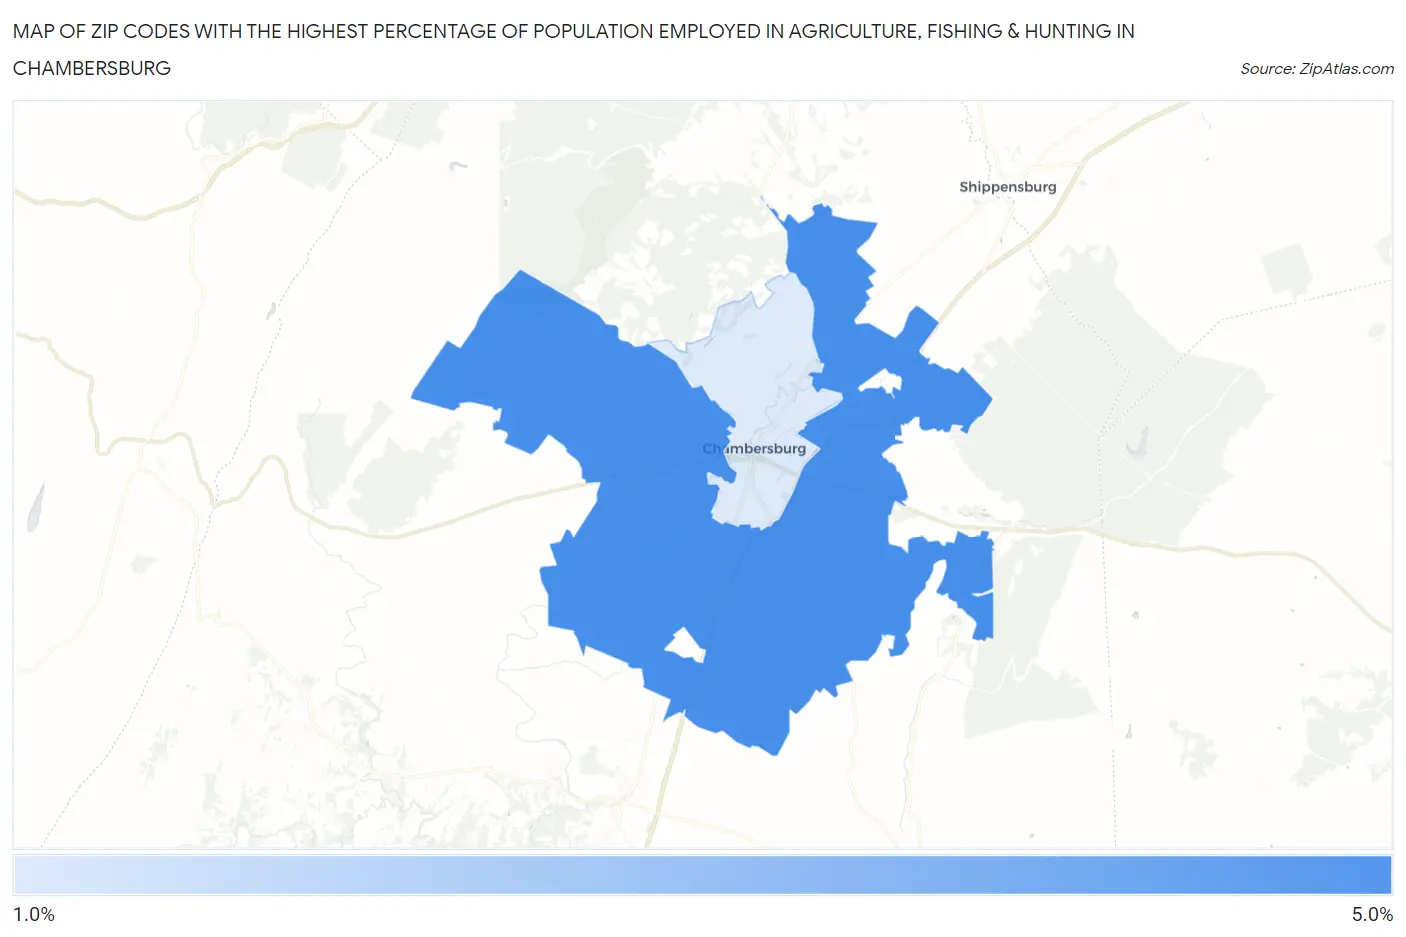
Map of Zip Codes with the Highest Percentage of Population Employed in Agriculture, Fishing & Hunting in Chambersburg
1.8%
4.2%
Zip Codes with the Highest Percentage of Population Employed in Agriculture, Fishing & Hunting in Chambersburg, PA
| Zip Code | % Employed | vs State | vs National | |
| 1. | 17202 | 4.2% | 0.87%(+3.38)#203 | 1.2%(+3.05)#8,719 |
| 2. | 17201 | 1.8% | 0.87%(+0.956)#446 | 1.2%(+0.623)#13,250 |
1
Common Questions
What are the Top Zip Codes with the Highest Percentage of Population Employed in Agriculture, Fishing & Hunting in Chambersburg, PA?
Top Zip Codes with the Highest Percentage of Population Employed in Agriculture, Fishing & Hunting in Chambersburg, PA are:
What zip code has the Highest Percentage of Population Employed in Agriculture, Fishing & Hunting in Chambersburg, PA?
17202 has the Highest Percentage of Population Employed in Agriculture, Fishing & Hunting in Chambersburg, PA with 4.2%.
What is the Percentage of Population Employed in Agriculture, Fishing & Hunting in Pennsylvania?
Percentage of Population Employed in Agriculture, Fishing & Hunting in Pennsylvania is 0.87%.
What is the Percentage of Population Employed in Agriculture, Fishing & Hunting in the United States?
Percentage of Population Employed in Agriculture, Fishing & Hunting in the United States is 1.2%.