Zip Codes with the Highest Percentage of Population Employed in Agriculture, Fishing & Hunting in Norristown, PA
RELATED REPORTS & OPTIONS
Agriculture, Fishing & Hunting
Norristown
Compare Zip Codes
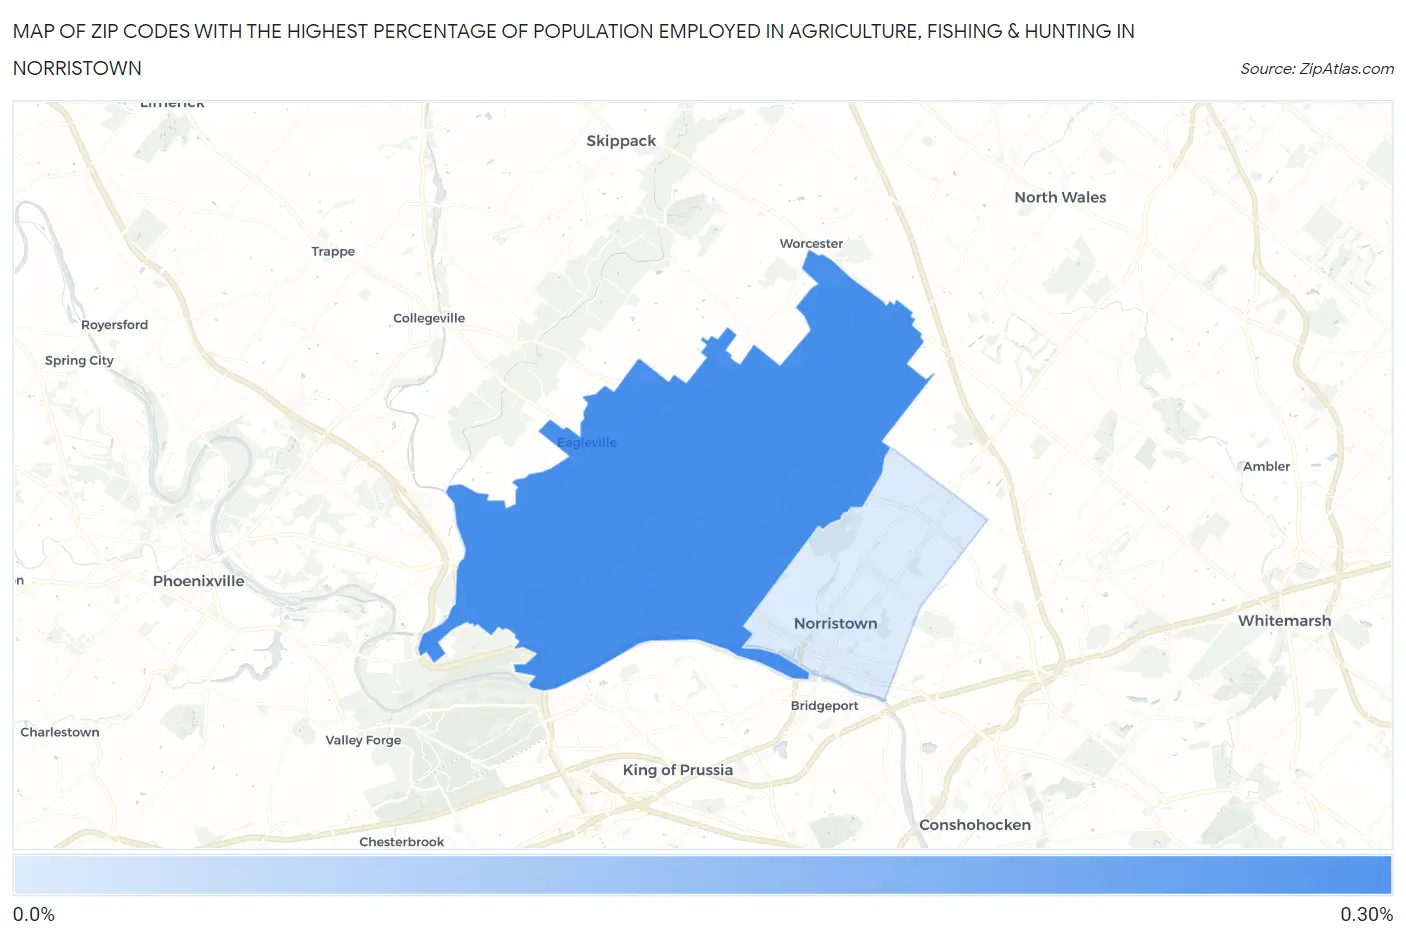
Map of Zip Codes with the Highest Percentage of Population Employed in Agriculture, Fishing & Hunting in Norristown
0.041%
0.28%
Zip Codes with the Highest Percentage of Population Employed in Agriculture, Fishing & Hunting in Norristown, PA
| Zip Code | % Employed | vs State | vs National | |
| 1. | 19403 | 0.28% | 0.87%(-0.582)#916 | 1.2%(-0.914)#21,351 |
| 2. | 19401 | 0.041% | 0.87%(-0.826)#1,073 | 1.2%(-1.16)#24,435 |
1
Common Questions
What are the Top Zip Codes with the Highest Percentage of Population Employed in Agriculture, Fishing & Hunting in Norristown, PA?
Top Zip Codes with the Highest Percentage of Population Employed in Agriculture, Fishing & Hunting in Norristown, PA are:
What zip code has the Highest Percentage of Population Employed in Agriculture, Fishing & Hunting in Norristown, PA?
19403 has the Highest Percentage of Population Employed in Agriculture, Fishing & Hunting in Norristown, PA with 0.28%.
What is the Percentage of Population Employed in Agriculture, Fishing & Hunting in Pennsylvania?
Percentage of Population Employed in Agriculture, Fishing & Hunting in Pennsylvania is 0.87%.
What is the Percentage of Population Employed in Agriculture, Fishing & Hunting in the United States?
Percentage of Population Employed in Agriculture, Fishing & Hunting in the United States is 1.2%.