Zip Codes with the Highest Percentage of Population Employed in Agriculture, Fishing & Hunting in Salem, OR
RELATED REPORTS & OPTIONS
Agriculture, Fishing & Hunting
Salem
Compare Zip Codes
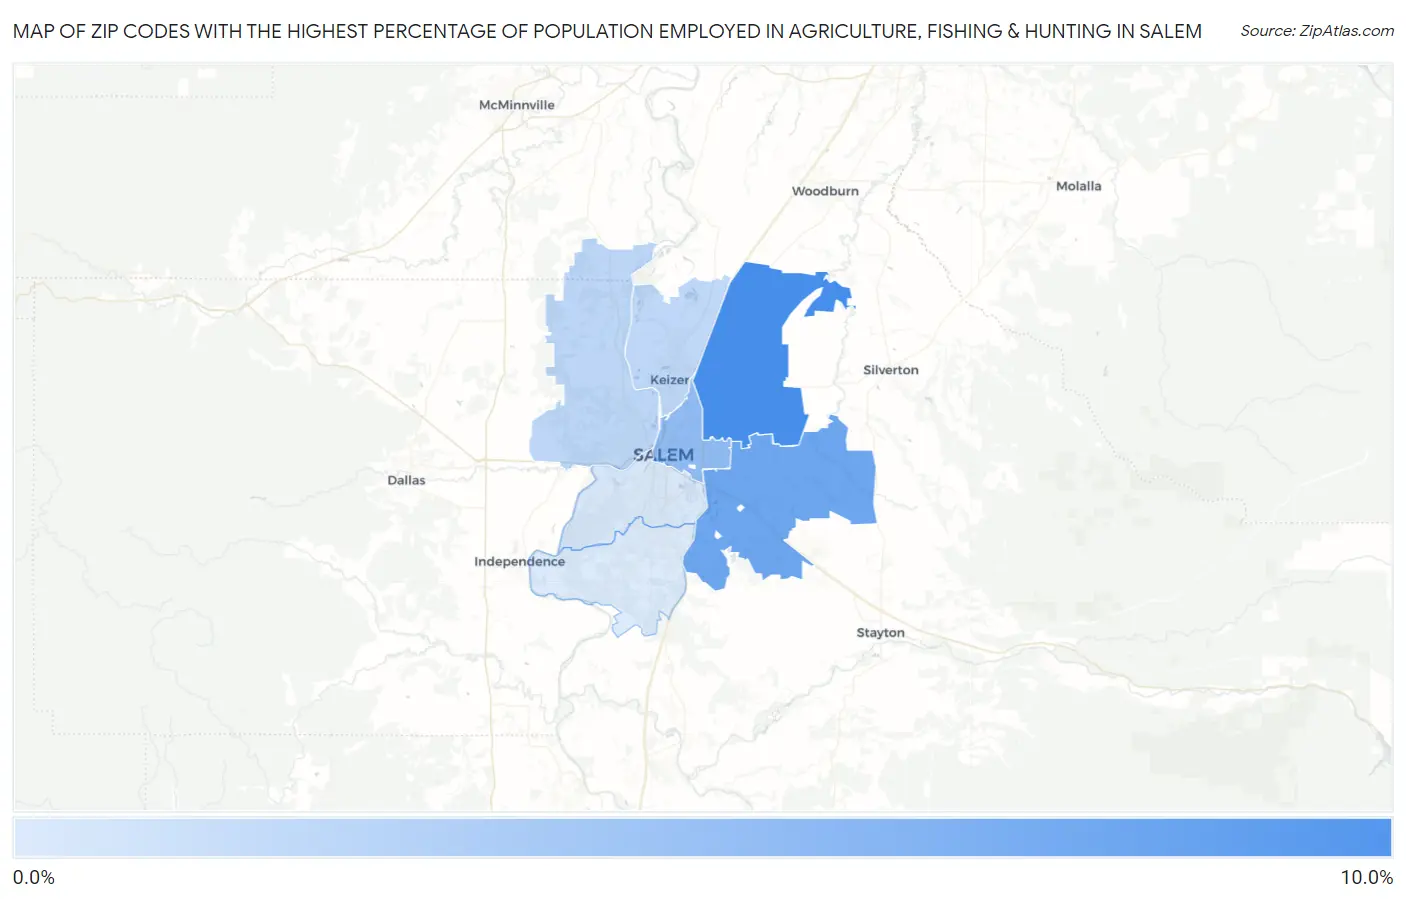
Map of Zip Codes with the Highest Percentage of Population Employed in Agriculture, Fishing & Hunting in Salem
0.86%
8.4%
Zip Codes with the Highest Percentage of Population Employed in Agriculture, Fishing & Hunting in Salem, OR
| Zip Code | % Employed | vs State | vs National | |
| 1. | 97305 | 8.4% | 2.7%(+5.70)#135 | 1.2%(+7.23)#5,157 |
| 2. | 97317 | 6.3% | 2.7%(+3.63)#167 | 1.2%(+5.15)#6,607 |
| 3. | 97301 | 4.6% | 2.7%(+1.86)#202 | 1.2%(+3.38)#8,310 |
| 4. | 97304 | 2.4% | 2.7%(-0.330)#271 | 1.2%(+1.20)#11,799 |
| 5. | 97303 | 2.3% | 2.7%(-0.422)#276 | 1.2%(+1.10)#12,023 |
| 6. | 97302 | 1.1% | 2.7%(-1.66)#318 | 1.2%(-0.138)#15,966 |
| 7. | 97306 | 0.86% | 2.7%(-1.86)#330 | 1.2%(-0.334)#16,901 |
1
Common Questions
What are the Top 5 Zip Codes with the Highest Percentage of Population Employed in Agriculture, Fishing & Hunting in Salem, OR?
Top 5 Zip Codes with the Highest Percentage of Population Employed in Agriculture, Fishing & Hunting in Salem, OR are:
What zip code has the Highest Percentage of Population Employed in Agriculture, Fishing & Hunting in Salem, OR?
97305 has the Highest Percentage of Population Employed in Agriculture, Fishing & Hunting in Salem, OR with 8.4%.
What is the Percentage of Population Employed in Agriculture, Fishing & Hunting in Salem, OR?
Percentage of Population Employed in Agriculture, Fishing & Hunting in Salem is 2.7%.
What is the Percentage of Population Employed in Agriculture, Fishing & Hunting in Oregon?
Percentage of Population Employed in Agriculture, Fishing & Hunting in Oregon is 2.7%.
What is the Percentage of Population Employed in Agriculture, Fishing & Hunting in the United States?
Percentage of Population Employed in Agriculture, Fishing & Hunting in the United States is 1.2%.