Zip Codes with the Highest Percentage of Population Employed in Agriculture, Fishing & Hunting in Bend, OR
RELATED REPORTS & OPTIONS
Agriculture, Fishing & Hunting
Bend
Compare Zip Codes
Map of Zip Codes with the Highest Percentage of Population Employed in Agriculture, Fishing & Hunting in Bend
1.1%
2.2%
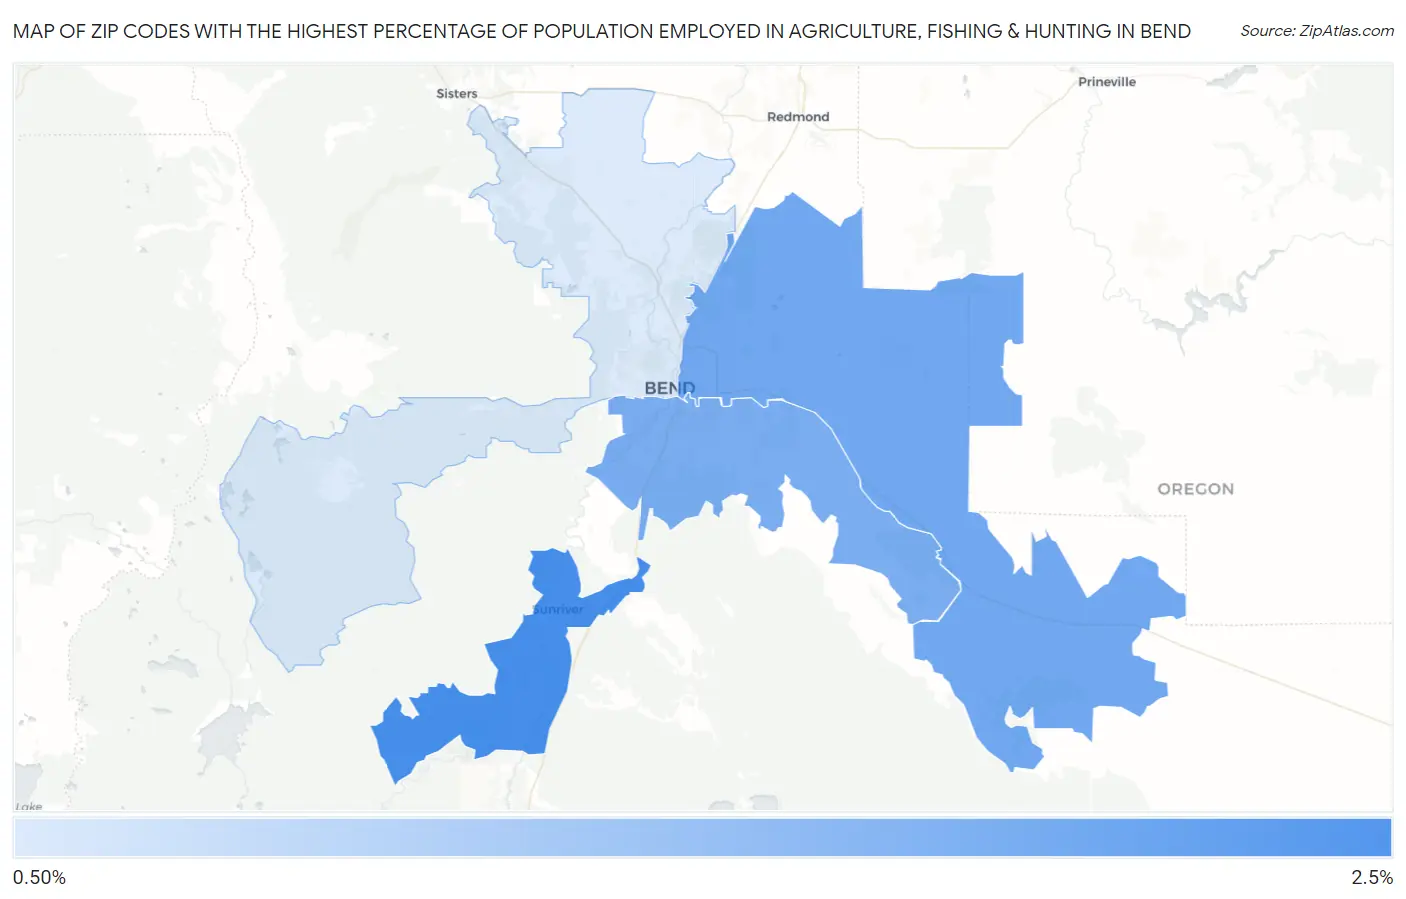
Zip Codes with the Highest Percentage of Population Employed in Agriculture, Fishing & Hunting in Bend, OR
| Zip Code | % Employed | vs State | vs National | |
| 1. | 97707 | 2.2% | 2.7%(-0.490)#277 | 1.2%(+1.03)#12,186 |
| 2. | 97701 | 1.9% | 2.7%(-0.817)#283 | 1.2%(+0.708)#13,015 |
| 3. | 97702 | 1.8% | 2.7%(-0.888)#286 | 1.2%(+0.637)#13,204 |
| 4. | 97703 | 1.1% | 2.7%(-1.66)#317 | 1.2%(-0.135)#15,947 |
1
Common Questions
What are the Top 3 Zip Codes with the Highest Percentage of Population Employed in Agriculture, Fishing & Hunting in Bend, OR?
Top 3 Zip Codes with the Highest Percentage of Population Employed in Agriculture, Fishing & Hunting in Bend, OR are:
What zip code has the Highest Percentage of Population Employed in Agriculture, Fishing & Hunting in Bend, OR?
97707 has the Highest Percentage of Population Employed in Agriculture, Fishing & Hunting in Bend, OR with 2.2%.
What is the Percentage of Population Employed in Agriculture, Fishing & Hunting in Bend, OR?
Percentage of Population Employed in Agriculture, Fishing & Hunting in Bend is 1.8%.
What is the Percentage of Population Employed in Agriculture, Fishing & Hunting in Oregon?
Percentage of Population Employed in Agriculture, Fishing & Hunting in Oregon is 2.7%.
What is the Percentage of Population Employed in Agriculture, Fishing & Hunting in the United States?
Percentage of Population Employed in Agriculture, Fishing & Hunting in the United States is 1.2%.