Zip Codes with the Highest Percentage of Population Employed in Agriculture, Fishing & Hunting in Corvallis, OR
RELATED REPORTS & OPTIONS
Agriculture, Fishing & Hunting
Corvallis
Compare Zip Codes
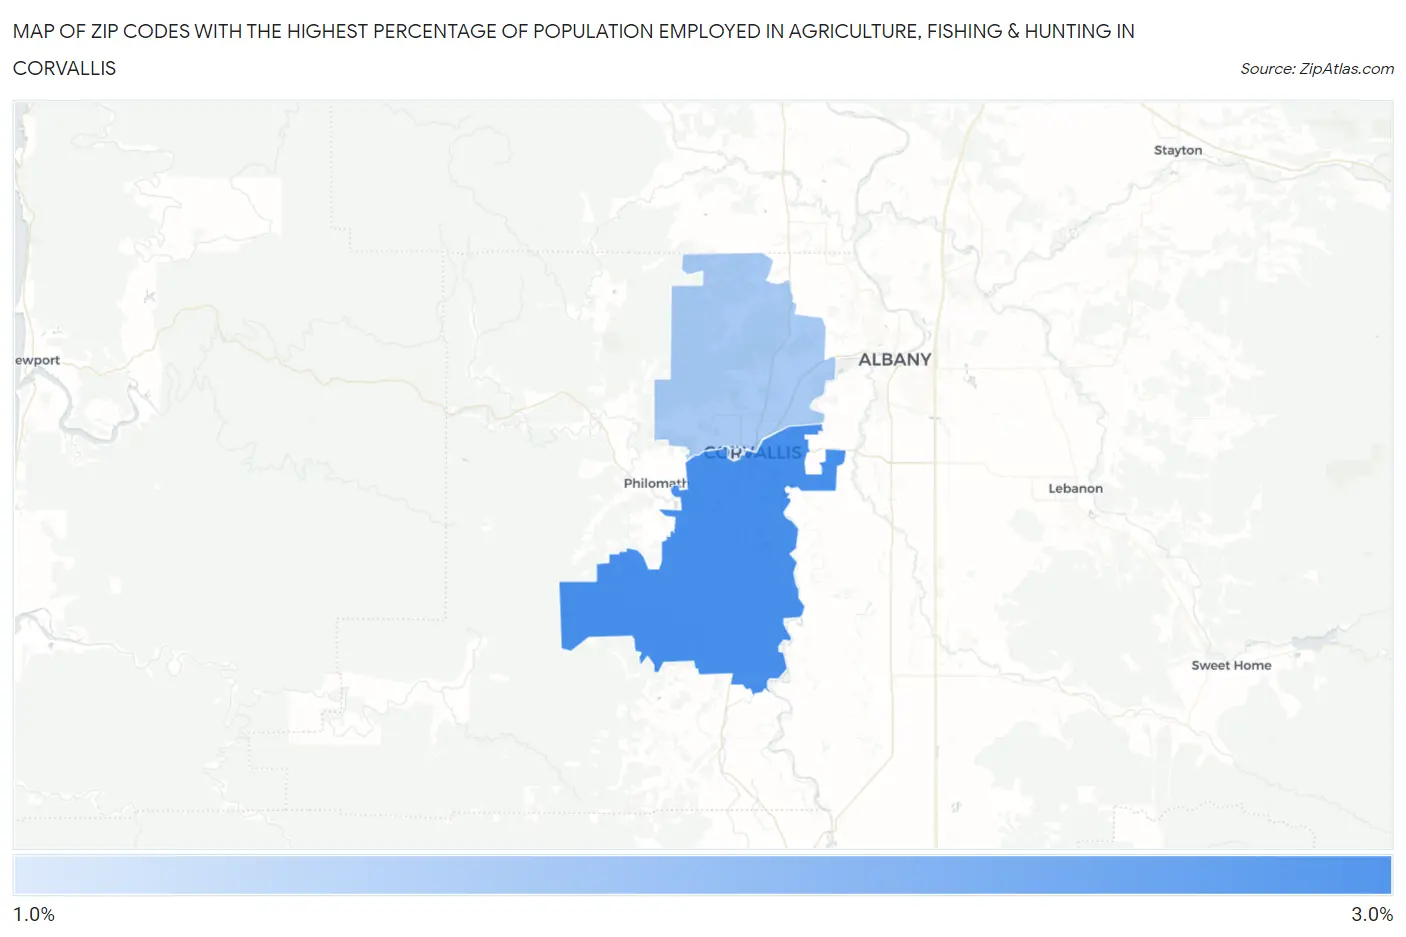
Map of Zip Codes with the Highest Percentage of Population Employed in Agriculture, Fishing & Hunting in Corvallis
0.0%
3.0%
Zip Codes with the Highest Percentage of Population Employed in Agriculture, Fishing & Hunting in Corvallis, OR
| Zip Code | % Employed | vs State | vs National | |
| 1. | 97333 | 2.6% | 2.7%(-0.132)#260 | 1.2%(+1.39)#11,377 |
| 2. | 97330 | 1.7% | 2.7%(-1.04)#292 | 1.2%(+0.480)#13,706 |
| 3. | 97331 | 1.2% | 2.7%(-1.54)#307 | 1.2%(-0.019)#15,470 |
1
Common Questions
What are the Top Zip Codes with the Highest Percentage of Population Employed in Agriculture, Fishing & Hunting in Corvallis, OR?
Top Zip Codes with the Highest Percentage of Population Employed in Agriculture, Fishing & Hunting in Corvallis, OR are:
What zip code has the Highest Percentage of Population Employed in Agriculture, Fishing & Hunting in Corvallis, OR?
97333 has the Highest Percentage of Population Employed in Agriculture, Fishing & Hunting in Corvallis, OR with 2.6%.
What is the Percentage of Population Employed in Agriculture, Fishing & Hunting in Corvallis, OR?
Percentage of Population Employed in Agriculture, Fishing & Hunting in Corvallis is 1.6%.
What is the Percentage of Population Employed in Agriculture, Fishing & Hunting in Oregon?
Percentage of Population Employed in Agriculture, Fishing & Hunting in Oregon is 2.7%.
What is the Percentage of Population Employed in Agriculture, Fishing & Hunting in the United States?
Percentage of Population Employed in Agriculture, Fishing & Hunting in the United States is 1.2%.