Zip Codes with the Highest Percentage of Population Employed in Agriculture, Fishing & Hunting in Eugene, OR
RELATED REPORTS & OPTIONS
Agriculture, Fishing & Hunting
Eugene
Compare Zip Codes
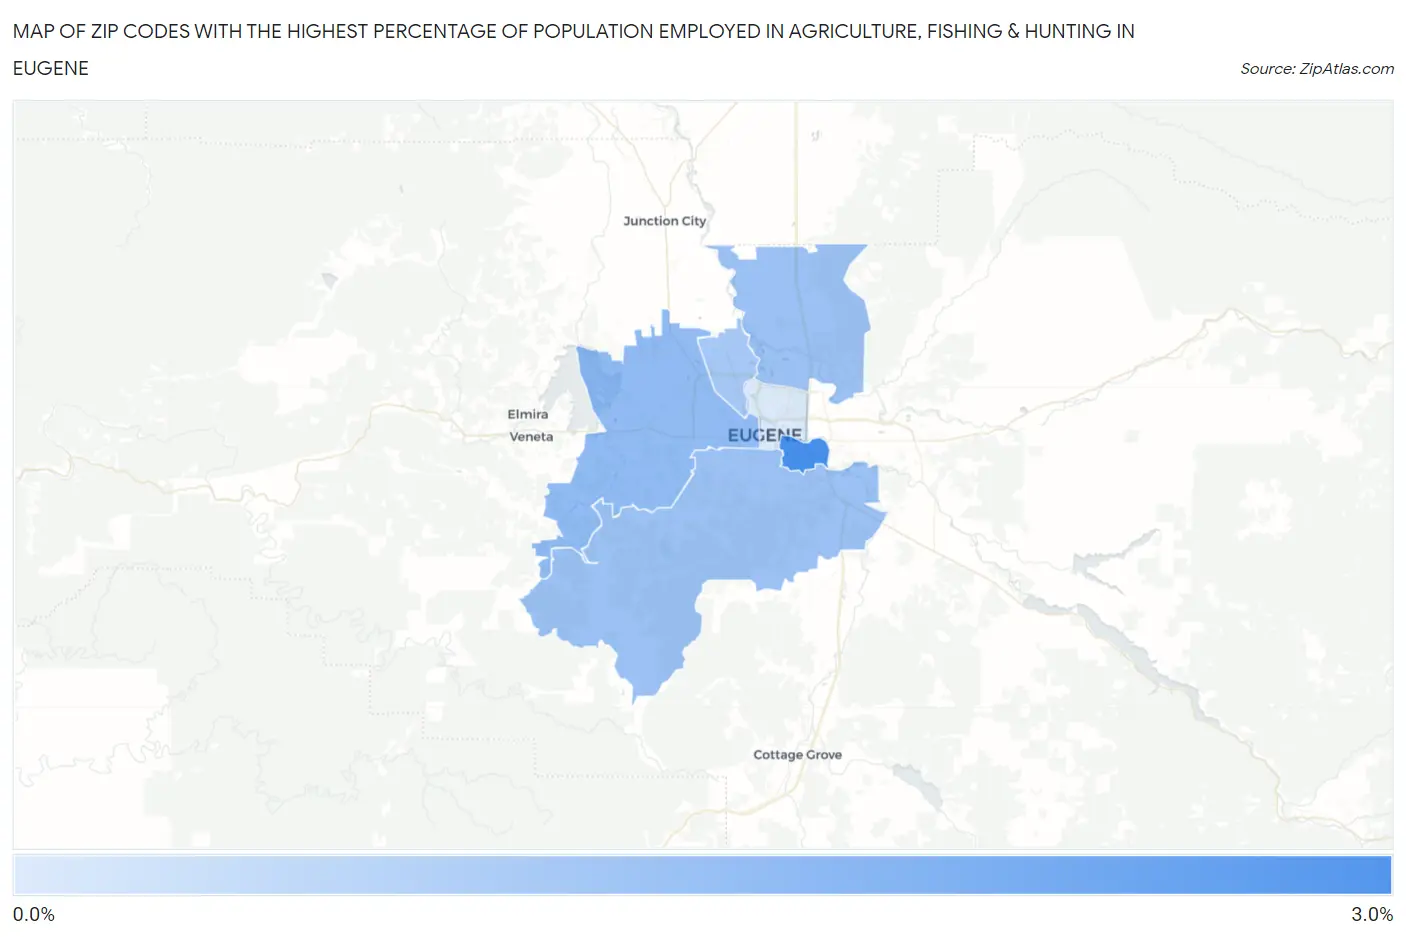
Map of Zip Codes with the Highest Percentage of Population Employed in Agriculture, Fishing & Hunting in Eugene
0.61%
2.9%
Zip Codes with the Highest Percentage of Population Employed in Agriculture, Fishing & Hunting in Eugene, OR
| Zip Code | % Employed | vs State | vs National | |
| 1. | 97403 | 2.9% | 2.7%(+0.203)#249 | 1.2%(+1.73)#10,715 |
| 2. | 97402 | 1.8% | 2.7%(-0.935)#288 | 1.2%(+0.590)#13,366 |
| 3. | 97405 | 1.6% | 2.7%(-1.07)#294 | 1.2%(+0.450)#13,804 |
| 4. | 97408 | 1.6% | 2.7%(-1.11)#296 | 1.2%(+0.416)#13,927 |
| 5. | 97404 | 1.5% | 2.7%(-1.25)#302 | 1.2%(+0.271)#14,402 |
| 6. | 97401 | 0.61% | 2.7%(-2.11)#344 | 1.2%(-0.590)#18,425 |
1
Common Questions
What are the Top 5 Zip Codes with the Highest Percentage of Population Employed in Agriculture, Fishing & Hunting in Eugene, OR?
Top 5 Zip Codes with the Highest Percentage of Population Employed in Agriculture, Fishing & Hunting in Eugene, OR are:
What zip code has the Highest Percentage of Population Employed in Agriculture, Fishing & Hunting in Eugene, OR?
97403 has the Highest Percentage of Population Employed in Agriculture, Fishing & Hunting in Eugene, OR with 2.9%.
What is the Percentage of Population Employed in Agriculture, Fishing & Hunting in Eugene, OR?
Percentage of Population Employed in Agriculture, Fishing & Hunting in Eugene is 1.3%.
What is the Percentage of Population Employed in Agriculture, Fishing & Hunting in Oregon?
Percentage of Population Employed in Agriculture, Fishing & Hunting in Oregon is 2.7%.
What is the Percentage of Population Employed in Agriculture, Fishing & Hunting in the United States?
Percentage of Population Employed in Agriculture, Fishing & Hunting in the United States is 1.2%.