Zip Codes with the Highest Percentage of Population Employed in Agriculture, Fishing & Hunting in Klamath Falls, OR
RELATED REPORTS & OPTIONS
Agriculture, Fishing & Hunting
Klamath Falls
Compare Zip Codes
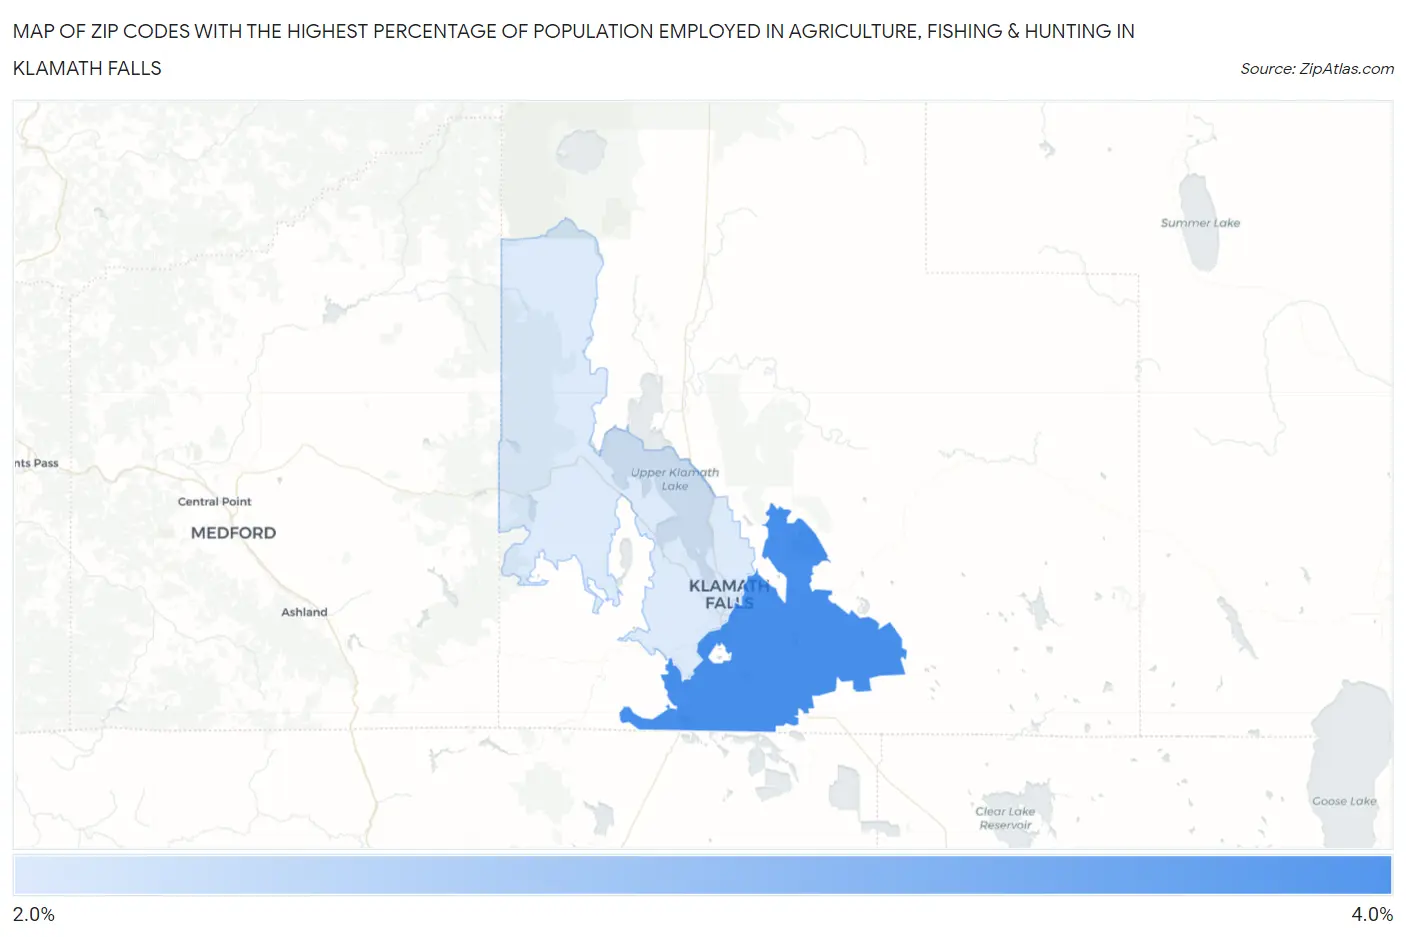
Map of Zip Codes with the Highest Percentage of Population Employed in Agriculture, Fishing & Hunting in Klamath Falls
2.3%
3.3%
Zip Codes with the Highest Percentage of Population Employed in Agriculture, Fishing & Hunting in Klamath Falls, OR
| Zip Code | % Employed | vs State | vs National | |
| 1. | 97603 | 3.3% | 2.7%(+0.527)#240 | 1.2%(+2.05)#10,142 |
| 2. | 97601 | 2.3% | 2.7%(-0.400)#275 | 1.2%(+1.12)#11,974 |
1
Common Questions
What are the Top Zip Codes with the Highest Percentage of Population Employed in Agriculture, Fishing & Hunting in Klamath Falls, OR?
Top Zip Codes with the Highest Percentage of Population Employed in Agriculture, Fishing & Hunting in Klamath Falls, OR are:
What zip code has the Highest Percentage of Population Employed in Agriculture, Fishing & Hunting in Klamath Falls, OR?
97603 has the Highest Percentage of Population Employed in Agriculture, Fishing & Hunting in Klamath Falls, OR with 3.3%.
What is the Percentage of Population Employed in Agriculture, Fishing & Hunting in Klamath Falls, OR?
Percentage of Population Employed in Agriculture, Fishing & Hunting in Klamath Falls is 2.1%.
What is the Percentage of Population Employed in Agriculture, Fishing & Hunting in Oregon?
Percentage of Population Employed in Agriculture, Fishing & Hunting in Oregon is 2.7%.
What is the Percentage of Population Employed in Agriculture, Fishing & Hunting in the United States?
Percentage of Population Employed in Agriculture, Fishing & Hunting in the United States is 1.2%.