Middle Point, OH Map & Demographics
Middle Point Map
Middle Point Overview
$27,572
PER CAPITA INCOME
$61,591
AVG FAMILY INCOME
$54,479
AVG HOUSEHOLD INCOME
31.7%
WAGE / INCOME GAP [ % ]
68.3¢/ $1
WAGE / INCOME GAP [ $ ]
0.31
INEQUALITY / GINI INDEX
646
TOTAL POPULATION
348
MALE POPULATION
298
FEMALE POPULATION
116.78
MALES / 100 FEMALES
85.63
FEMALES / 100 MALES
37.0
MEDIAN AGE
2.8
AVG FAMILY SIZE
2.3
AVG HOUSEHOLD SIZE
380
LABOR FORCE [ PEOPLE ]
72.2%
PERCENT IN LABOR FORCE
1.3%
UNEMPLOYMENT RATE
Middle Point Zip Codes
Middle Point Area Codes
Income in Middle Point
Income Overview in Middle Point
Per Capita Income in Middle Point is $27,572, while median incomes of families and households are $61,591 and $54,479 respectively.
| Characteristic | Number | Measure |
| Per Capita Income | 646 | $27,572 |
| Median Family Income | 194 | $61,591 |
| Mean Family Income | 194 | $68,764 |
| Median Household Income | 279 | $54,479 |
| Mean Household Income | 279 | $64,286 |
| Income Deficit | 194 | $0 |
| Wage / Income Gap (%) | 646 | 31.73% |
| Wage / Income Gap ($) | 646 | 68.27¢ per $1 |
| Gini / Inequality Index | 646 | 0.31 |
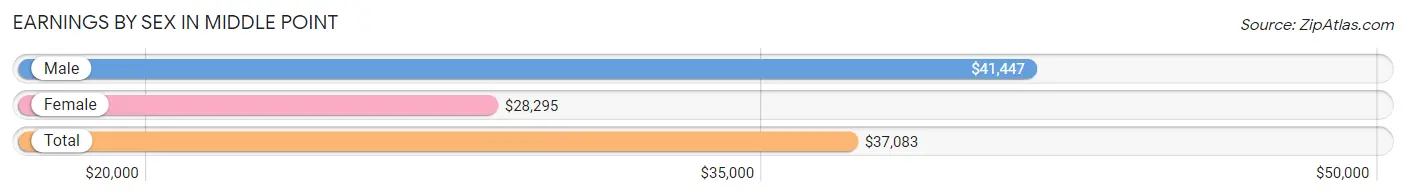
Earnings by Sex in Middle Point
Average Earnings in Middle Point are $37,083, $41,447 for men and $28,295 for women, a difference of 31.7%.
| Sex | Number | Average Earnings |
| Male | 212 (54.2%) | $41,447 |
| Female | 179 (45.8%) | $28,295 |
| Total | 391 (100.0%) | $37,083 |
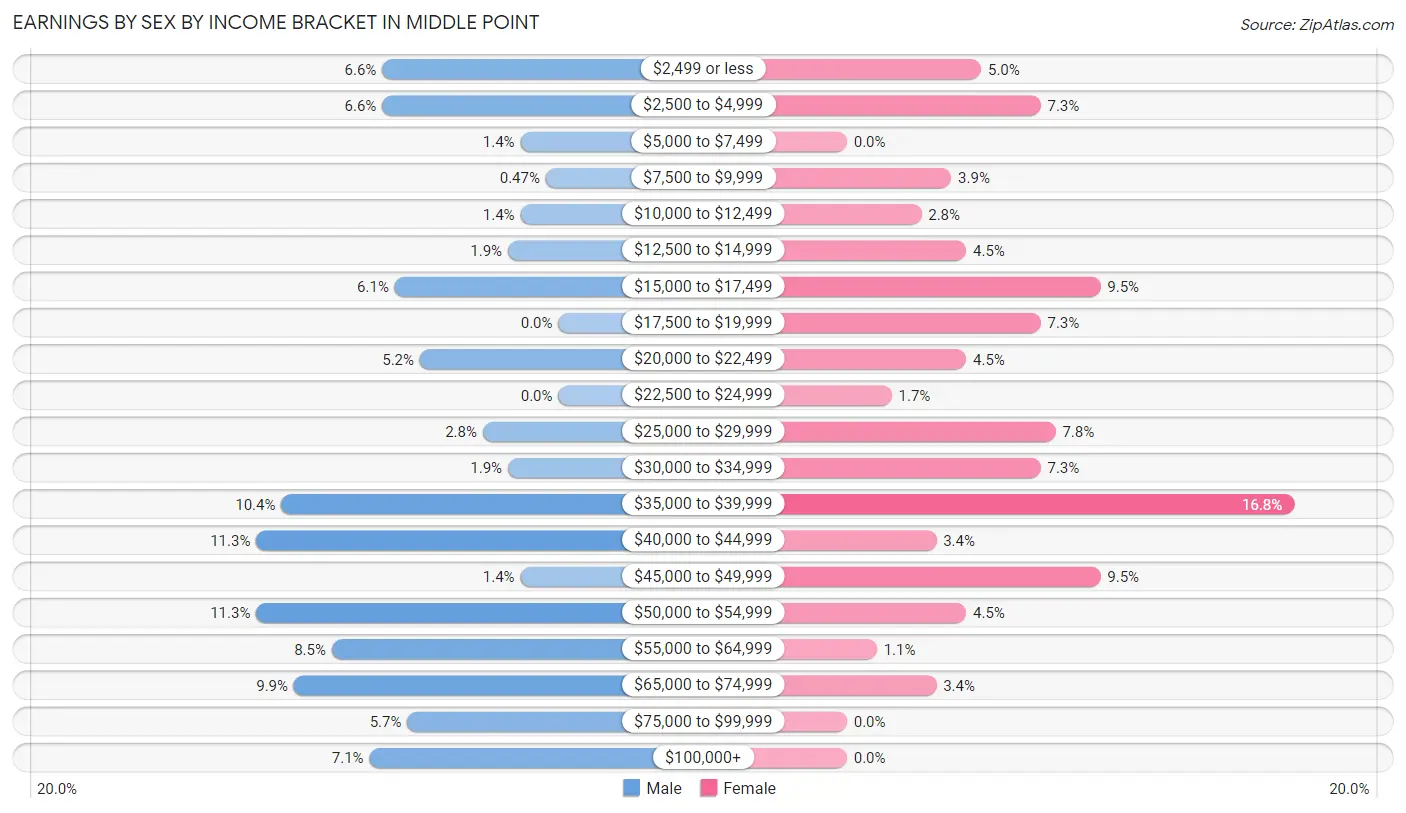
Earnings by Sex by Income Bracket in Middle Point
The most common earnings brackets in Middle Point are $40,000 to $44,999 for men (24 | 11.3%) and $35,000 to $39,999 for women (30 | 16.8%).
| Income | Male | Female |
| $2,499 or less | 14 (6.6%) | 9 (5.0%) |
| $2,500 to $4,999 | 14 (6.6%) | 13 (7.3%) |
| $5,000 to $7,499 | 3 (1.4%) | 0 (0.0%) |
| $7,500 to $9,999 | 1 (0.5%) | 7 (3.9%) |
| $10,000 to $12,499 | 3 (1.4%) | 5 (2.8%) |
| $12,500 to $14,999 | 4 (1.9%) | 8 (4.5%) |
| $15,000 to $17,499 | 13 (6.1%) | 17 (9.5%) |
| $17,500 to $19,999 | 0 (0.0%) | 13 (7.3%) |
| $20,000 to $22,499 | 11 (5.2%) | 8 (4.5%) |
| $22,500 to $24,999 | 0 (0.0%) | 3 (1.7%) |
| $25,000 to $29,999 | 6 (2.8%) | 14 (7.8%) |
| $30,000 to $34,999 | 4 (1.9%) | 13 (7.3%) |
| $35,000 to $39,999 | 22 (10.4%) | 30 (16.8%) |
| $40,000 to $44,999 | 24 (11.3%) | 6 (3.4%) |
| $45,000 to $49,999 | 3 (1.4%) | 17 (9.5%) |
| $50,000 to $54,999 | 24 (11.3%) | 8 (4.5%) |
| $55,000 to $64,999 | 18 (8.5%) | 2 (1.1%) |
| $65,000 to $74,999 | 21 (9.9%) | 6 (3.4%) |
| $75,000 to $99,999 | 12 (5.7%) | 0 (0.0%) |
| $100,000+ | 15 (7.1%) | 0 (0.0%) |
| Total | 212 (100.0%) | 179 (100.0%) |
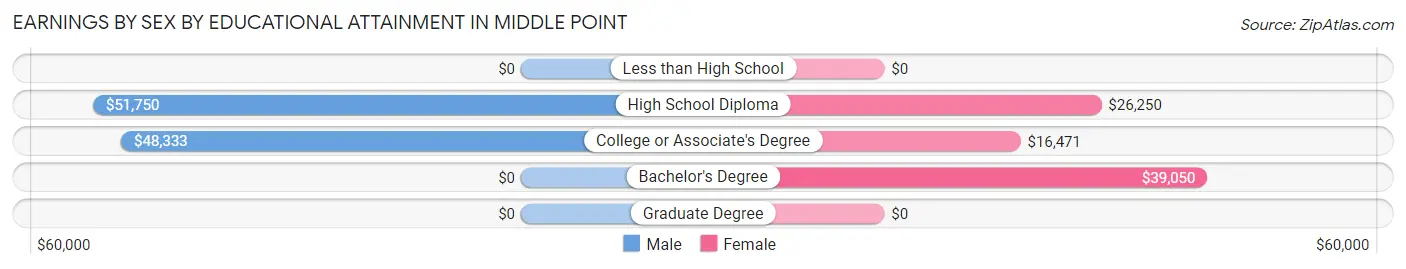
Earnings by Sex by Educational Attainment in Middle Point
Average earnings in Middle Point are $48,333 for men and $29,531 for women, a difference of 38.9%. Men with an educational attainment of high school diploma enjoy the highest average annual earnings of $51,750, while those with college or associate's degree education earn the least with $48,333. Women with an educational attainment of bachelor's degree earn the most with the average annual earnings of $39,050, while those with college or associate's degree education have the smallest earnings of $16,471.
| Educational Attainment | Male Income | Female Income |
| Less than High School | - | - |
| High School Diploma | $51,750 | $26,250 |
| College or Associate's Degree | $48,333 | $16,471 |
| Bachelor's Degree | - | - |
| Graduate Degree | - | - |
| Total | $48,333 | $29,531 |
Family Income in Middle Point
Family Income Brackets in Middle Point
According to the Middle Point family income data, there are 54 families falling into the $50,000 to $74,999 income range, which is the most common income bracket and makes up 27.8% of all families.
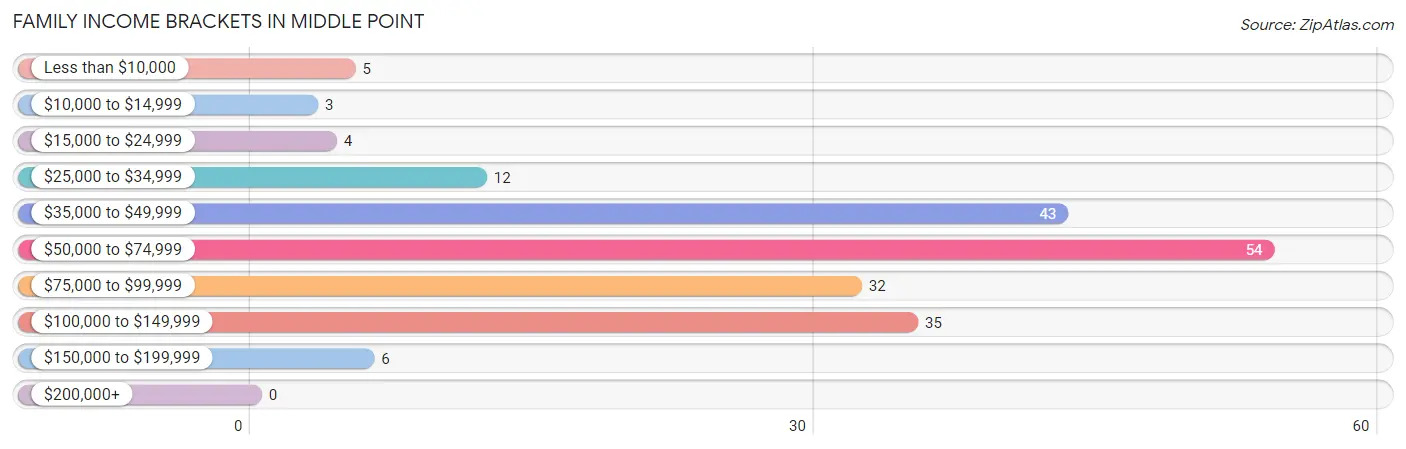
| Income Bracket | # Families | % Families |
| Less than $10,000 | 5 | 2.6% |
| $10,000 to $14,999 | 3 | 1.5% |
| $15,000 to $24,999 | 4 | 2.1% |
| $25,000 to $34,999 | 12 | 6.2% |
| $35,000 to $49,999 | 43 | 22.2% |
| $50,000 to $74,999 | 54 | 27.8% |
| $75,000 to $99,999 | 32 | 16.5% |
| $100,000 to $149,999 | 35 | 18.0% |
| $150,000 to $199,999 | 6 | 3.1% |
| $200,000+ | 0 | 0.0% |
Family Income by Famaliy Size in Middle Point
5-person families (8 | 4.1%) account for the highest median family income in Middle Point with $118,750 per family, while 2-person families (102 | 52.6%) have the highest median income of $35,625 per family member.
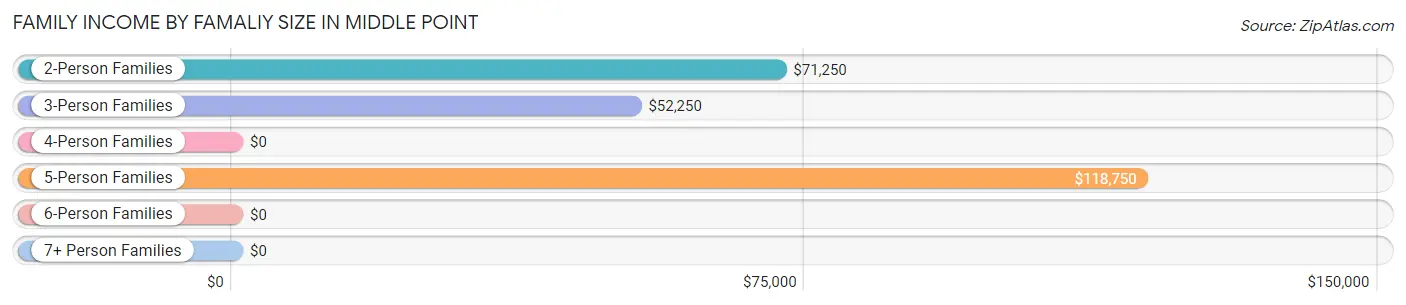
| Income Bracket | # Families | Median Income |
| 2-Person Families | 102 (52.6%) | $71,250 |
| 3-Person Families | 66 (34.0%) | $52,250 |
| 4-Person Families | 10 (5.1%) | $0 |
| 5-Person Families | 8 (4.1%) | $118,750 |
| 6-Person Families | 6 (3.1%) | $0 |
| 7+ Person Families | 2 (1.0%) | $0 |
| Total | 194 (100.0%) | $61,591 |
Family Income by Number of Earners in Middle Point
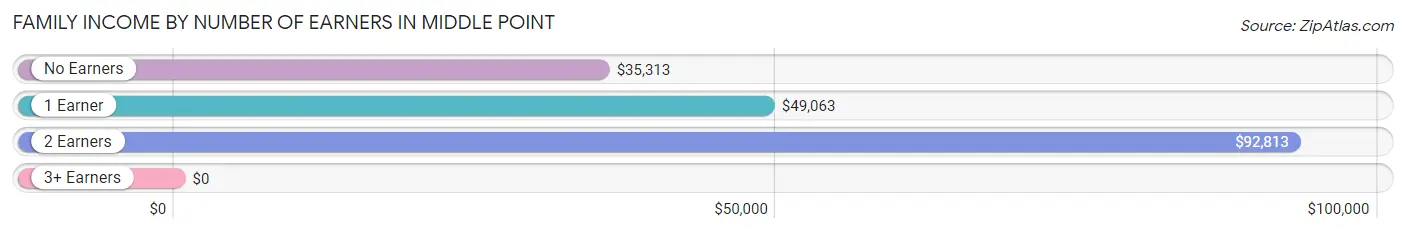
| Number of Earners | # Families | Median Income |
| No Earners | 21 (10.8%) | $35,313 |
| 1 Earner | 55 (28.3%) | $49,063 |
| 2 Earners | 115 (59.3%) | $92,813 |
| 3+ Earners | 3 (1.5%) | $0 |
| Total | 194 (100.0%) | $61,591 |
Household Income in Middle Point
Household Income Brackets in Middle Point
With 76 households falling in the category, the $35,000 to $49,999 income range is the most frequent in Middle Point, accounting for 27.2% of all households.
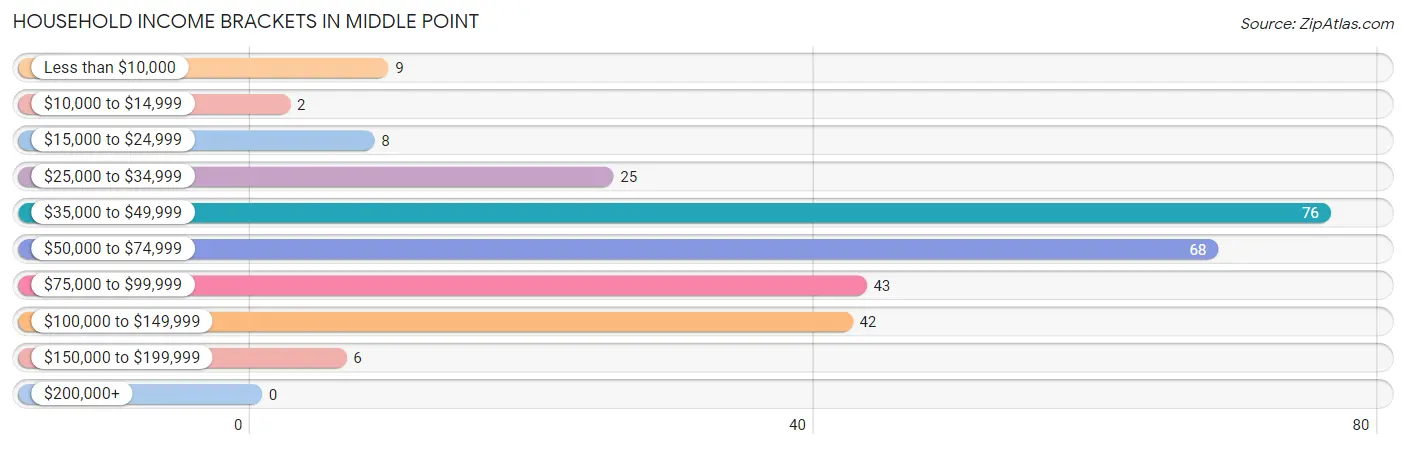
| Income Bracket | # Households | % Households |
| Less than $10,000 | 9 | 3.2% |
| $10,000 to $14,999 | 2 | 0.7% |
| $15,000 to $24,999 | 8 | 2.9% |
| $25,000 to $34,999 | 25 | 9.0% |
| $35,000 to $49,999 | 76 | 27.2% |
| $50,000 to $74,999 | 68 | 24.4% |
| $75,000 to $99,999 | 43 | 15.4% |
| $100,000 to $149,999 | 42 | 15.1% |
| $150,000 to $199,999 | 6 | 2.2% |
| $200,000+ | 0 | 0.0% |
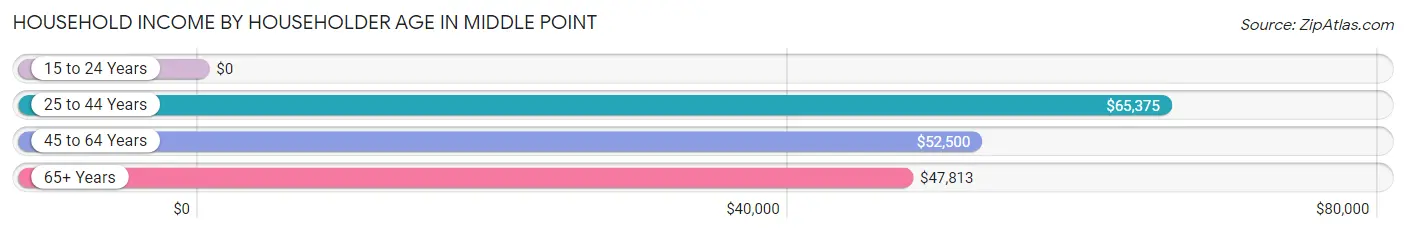
Household Income by Householder Age in Middle Point
The median household income in Middle Point is $54,479, with the highest median household income of $65,375 found in the 25 to 44 years age bracket for the primary householder. A total of 95 households (34.1%) fall into this category. Meanwhile, the 15 to 24 years age bracket for the primary householder has the lowest median household income of $0, with 11 households (3.9%) in this group.
| Income Bracket | # Households | Median Income |
| 15 to 24 Years | 11 (3.9%) | $0 |
| 25 to 44 Years | 95 (34.1%) | $65,375 |
| 45 to 64 Years | 114 (40.9%) | $52,500 |
| 65+ Years | 59 (21.1%) | $47,813 |
| Total | 279 (100.0%) | $54,479 |
Poverty in Middle Point
Income Below Poverty by Sex and Age in Middle Point
With 9.2% poverty level for males and 10.1% for females among the residents of Middle Point, 5 year old males and 15 year old females are the most vulnerable to poverty, with 2 males (40.0%) and 1 females (100.0%) in their respective age groups living below the poverty level.
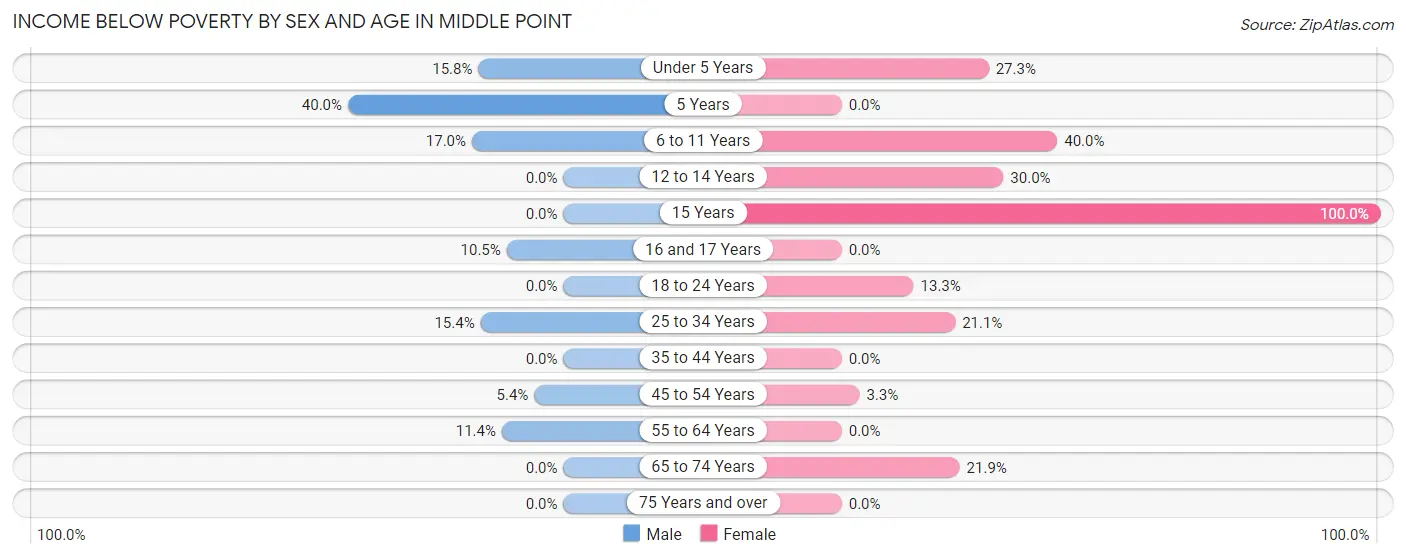
| Age Bracket | Male | Female |
| Under 5 Years | 3 (15.8%) | 3 (27.3%) |
| 5 Years | 2 (40.0%) | 0 (0.0%) |
| 6 to 11 Years | 9 (17.0%) | 4 (40.0%) |
| 12 to 14 Years | 0 (0.0%) | 3 (30.0%) |
| 15 Years | 0 (0.0%) | 1 (100.0%) |
| 16 and 17 Years | 4 (10.5%) | 0 (0.0%) |
| 18 to 24 Years | 0 (0.0%) | 2 (13.3%) |
| 25 to 34 Years | 8 (15.4%) | 8 (21.0%) |
| 35 to 44 Years | 0 (0.0%) | 0 (0.0%) |
| 45 to 54 Years | 2 (5.4%) | 2 (3.3%) |
| 55 to 64 Years | 4 (11.4%) | 0 (0.0%) |
| 65 to 74 Years | 0 (0.0%) | 7 (21.9%) |
| 75 Years and over | 0 (0.0%) | 0 (0.0%) |
| Total | 32 (9.2%) | 30 (10.1%) |
Income Above Poverty by Sex and Age in Middle Point
According to the poverty statistics in Middle Point, males aged 15 years and females aged 5 years are the age groups that are most secure financially, with 100.0% of males and 100.0% of females in these age groups living above the poverty line.
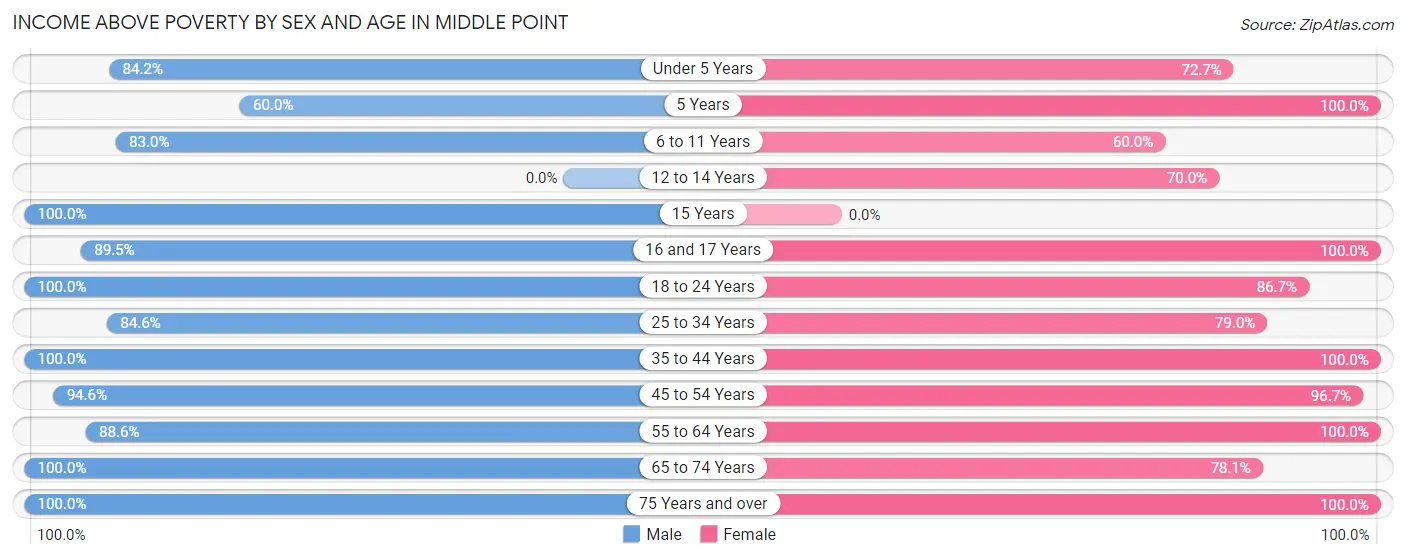
| Age Bracket | Male | Female |
| Under 5 Years | 16 (84.2%) | 8 (72.7%) |
| 5 Years | 3 (60.0%) | 6 (100.0%) |
| 6 to 11 Years | 44 (83.0%) | 6 (60.0%) |
| 12 to 14 Years | 0 (0.0%) | 7 (70.0%) |
| 15 Years | 5 (100.0%) | 0 (0.0%) |
| 16 and 17 Years | 34 (89.5%) | 24 (100.0%) |
| 18 to 24 Years | 10 (100.0%) | 13 (86.7%) |
| 25 to 34 Years | 44 (84.6%) | 30 (78.9%) |
| 35 to 44 Years | 53 (100.0%) | 51 (100.0%) |
| 45 to 54 Years | 35 (94.6%) | 59 (96.7%) |
| 55 to 64 Years | 31 (88.6%) | 30 (100.0%) |
| 65 to 74 Years | 27 (100.0%) | 25 (78.1%) |
| 75 Years and over | 14 (100.0%) | 9 (100.0%) |
| Total | 316 (90.8%) | 268 (89.9%) |
Income Below Poverty Among Married-Couple Families in Middle Point
The poverty statistics for married-couple families in Middle Point show that 1.6% or 2 of the total 125 families live below the poverty line. Families with 5 or more children have the highest poverty rate of 100.0%, comprising of 2 families. On the other hand, families with no children have the lowest poverty rate of 0.0%, which includes 0 families.
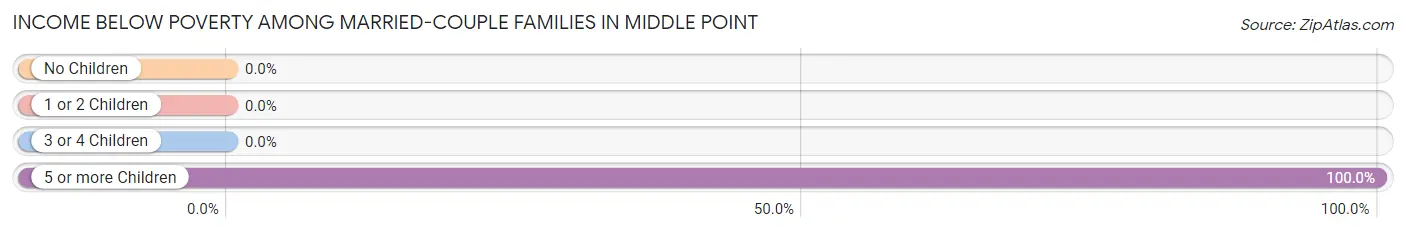
| Children | Above Poverty | Below Poverty |
| No Children | 72 (100.0%) | 0 (0.0%) |
| 1 or 2 Children | 43 (100.0%) | 0 (0.0%) |
| 3 or 4 Children | 8 (100.0%) | 0 (0.0%) |
| 5 or more Children | 0 (0.0%) | 2 (100.0%) |
| Total | 123 (98.4%) | 2 (1.6%) |
Income Below Poverty Among Single-Parent Households in Middle Point
According to the poverty data in Middle Point, 10.8% or 4 single-father households and 18.8% or 6 single-mother households are living below the poverty line. Among single-father households, those with no children have the highest poverty rate, with 4 households (26.7%) experiencing poverty. Likewise, among single-mother households, those with 3 or 4 children have the highest poverty rate, with 3 households (100.0%) falling below the poverty line.
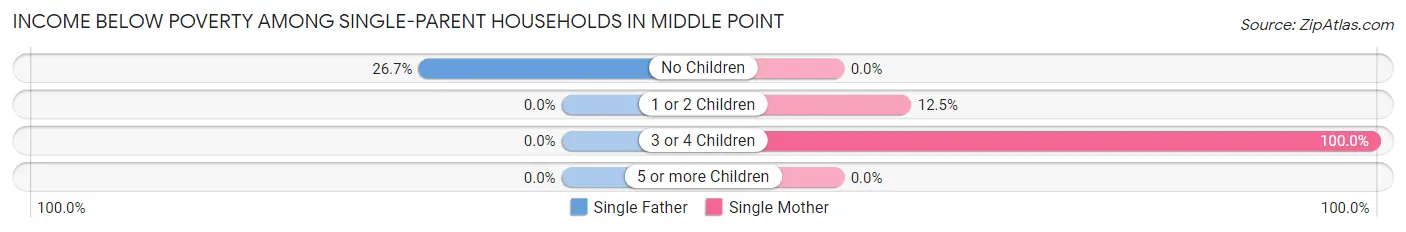
| Children | Single Father | Single Mother |
| No Children | 4 (26.7%) | 0 (0.0%) |
| 1 or 2 Children | 0 (0.0%) | 3 (12.5%) |
| 3 or 4 Children | 0 (0.0%) | 3 (100.0%) |
| 5 or more Children | 0 (0.0%) | 0 (0.0%) |
| Total | 4 (10.8%) | 6 (18.8%) |
Income Below Poverty Among Married-Couple vs Single-Parent Households in Middle Point
The poverty data for Middle Point shows that 2 of the married-couple family households (1.6%) and 10 of the single-parent households (14.5%) are living below the poverty level. Within the married-couple family households, those with 5 or more children have the highest poverty rate, with 2 households (100.0%) falling below the poverty line. Among the single-parent households, those with 3 or 4 children have the highest poverty rate, with 3 household (100.0%) living below poverty.
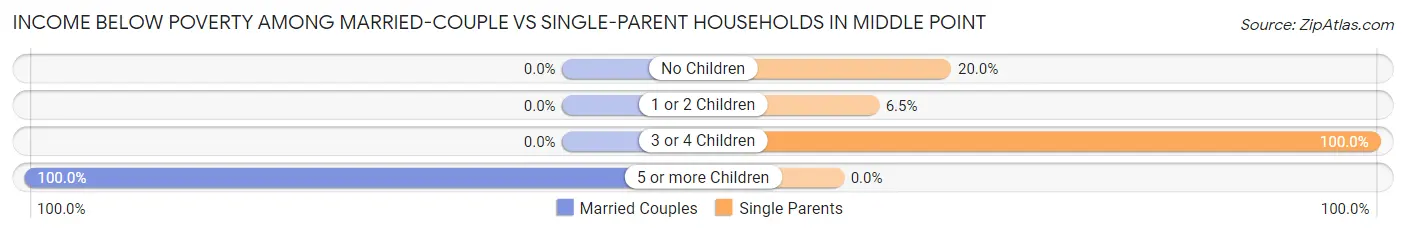
| Children | Married-Couple Families | Single-Parent Households |
| No Children | 0 (0.0%) | 4 (20.0%) |
| 1 or 2 Children | 0 (0.0%) | 3 (6.5%) |
| 3 or 4 Children | 0 (0.0%) | 3 (100.0%) |
| 5 or more Children | 2 (100.0%) | 0 (0.0%) |
| Total | 2 (1.6%) | 10 (14.5%) |
Race in Middle Point
The most populous races in Middle Point are White / Caucasian (639 | 98.9%), and Two or more Races (7 | 1.1%).
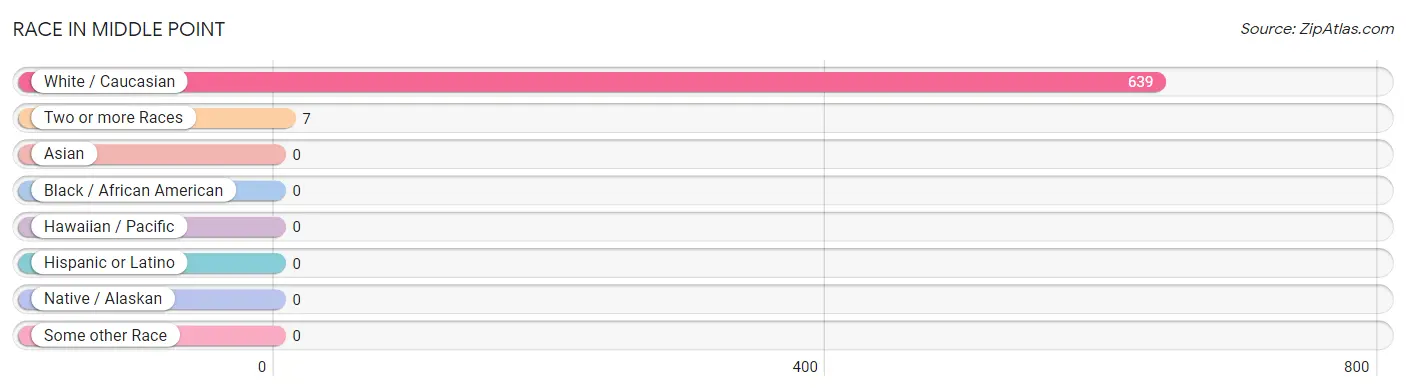
| Race | # Population | % Population |
| Asian | 0 | 0.0% |
| Black / African American | 0 | 0.0% |
| Hawaiian / Pacific | 0 | 0.0% |
| Hispanic or Latino | 0 | 0.0% |
| Native / Alaskan | 0 | 0.0% |
| White / Caucasian | 639 | 98.9% |
| Two or more Races | 7 | 1.1% |
| Some other Race | 0 | 0.0% |
| Total | 646 | 100.0% |
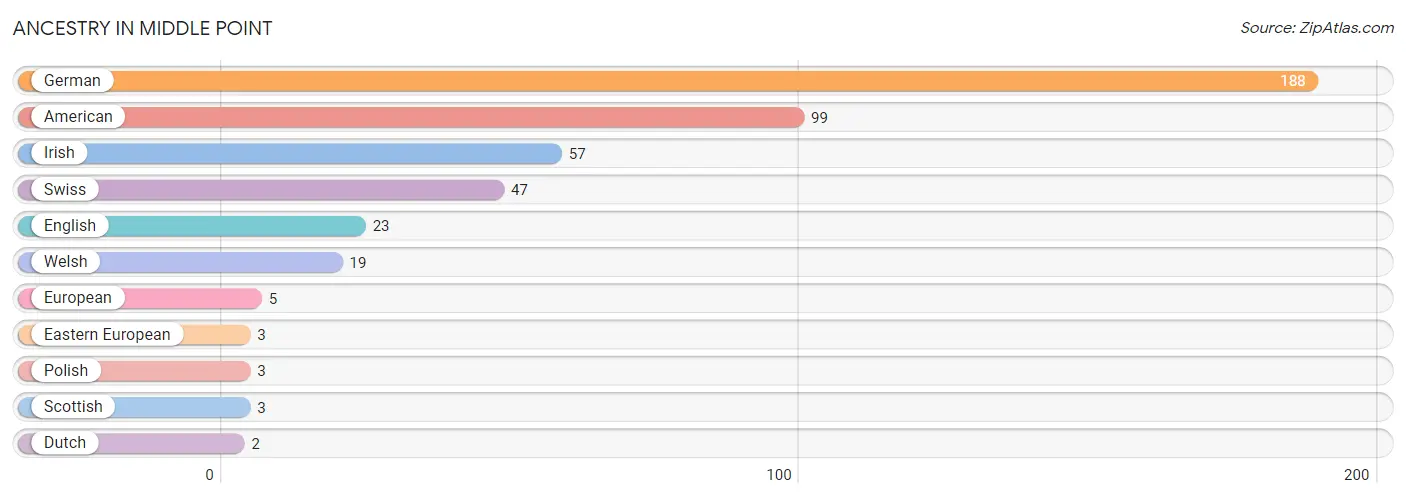
Ancestry in Middle Point
The most populous ancestries reported in Middle Point are German (188 | 29.1%), American (99 | 15.3%), Irish (57 | 8.8%), Swiss (47 | 7.3%), and English (23 | 3.6%), together accounting for 64.1% of all Middle Point residents.
| Ancestry | # Population | % Population |
| American | 99 | 15.3% |
| Dutch | 2 | 0.3% |
| Eastern European | 3 | 0.5% |
| English | 23 | 3.6% |
| European | 5 | 0.8% |
| German | 188 | 29.1% |
| Irish | 57 | 8.8% |
| Polish | 3 | 0.5% |
| Scottish | 3 | 0.5% |
| Swiss | 47 | 7.3% |
| Welsh | 19 | 2.9% | View All 11 Rows |
Immigrants in Middle Point

| Immigration Origin | # Population | % Population | View All 0 Rows |
Sex and Age in Middle Point
Sex and Age in Middle Point
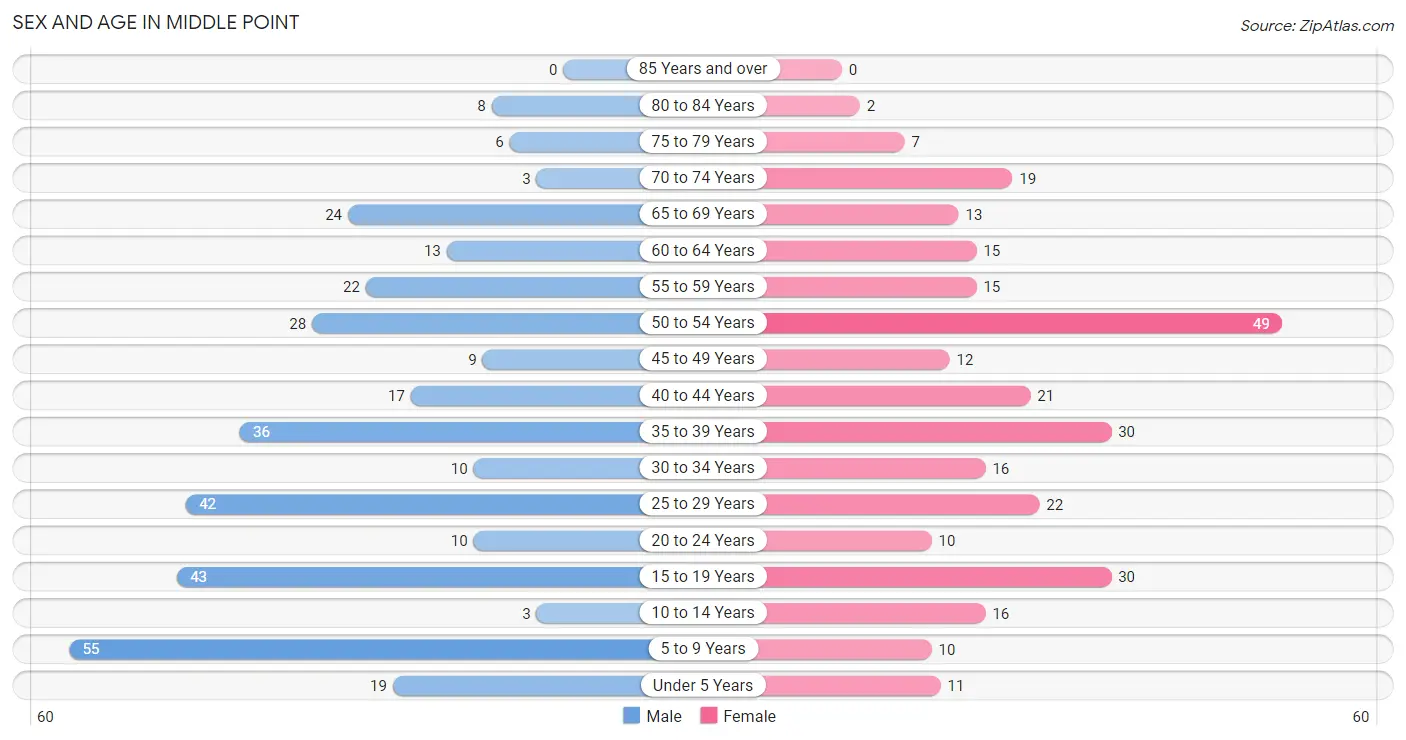
The most populous age groups in Middle Point are 5 to 9 Years (55 | 15.8%) for men and 50 to 54 Years (49 | 16.4%) for women.
| Age Bracket | Male | Female |
| Under 5 Years | 19 (5.5%) | 11 (3.7%) |
| 5 to 9 Years | 55 (15.8%) | 10 (3.4%) |
| 10 to 14 Years | 3 (0.9%) | 16 (5.4%) |
| 15 to 19 Years | 43 (12.4%) | 30 (10.1%) |
| 20 to 24 Years | 10 (2.9%) | 10 (3.4%) |
| 25 to 29 Years | 42 (12.1%) | 22 (7.4%) |
| 30 to 34 Years | 10 (2.9%) | 16 (5.4%) |
| 35 to 39 Years | 36 (10.3%) | 30 (10.1%) |
| 40 to 44 Years | 17 (4.9%) | 21 (7.0%) |
| 45 to 49 Years | 9 (2.6%) | 12 (4.0%) |
| 50 to 54 Years | 28 (8.1%) | 49 (16.4%) |
| 55 to 59 Years | 22 (6.3%) | 15 (5.0%) |
| 60 to 64 Years | 13 (3.7%) | 15 (5.0%) |
| 65 to 69 Years | 24 (6.9%) | 13 (4.4%) |
| 70 to 74 Years | 3 (0.9%) | 19 (6.4%) |
| 75 to 79 Years | 6 (1.7%) | 7 (2.4%) |
| 80 to 84 Years | 8 (2.3%) | 2 (0.7%) |
| 85 Years and over | 0 (0.0%) | 0 (0.0%) |
| Total | 348 (100.0%) | 298 (100.0%) |
Families and Households in Middle Point
Median Family Size in Middle Point
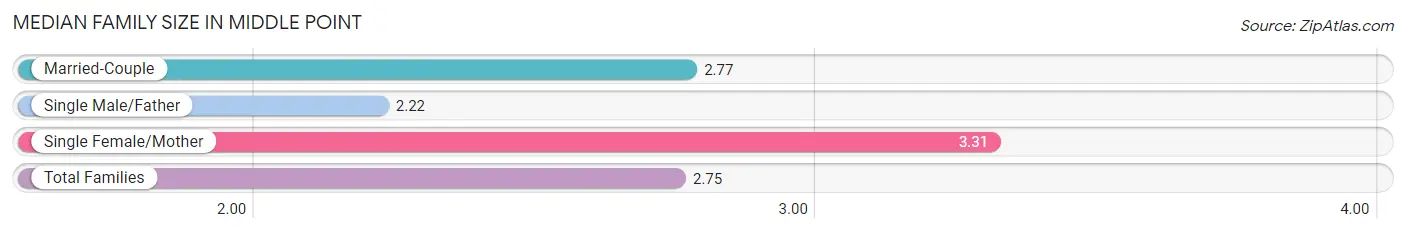
The median family size in Middle Point is 2.75 persons per family, with single female/mother families (32 | 16.5%) accounting for the largest median family size of 3.31 persons per family. On the other hand, single male/father families (37 | 19.1%) represent the smallest median family size with 2.22 persons per family.
| Family Type | # Families | Family Size |
| Married-Couple | 125 (64.4%) | 2.77 |
| Single Male/Father | 37 (19.1%) | 2.22 |
| Single Female/Mother | 32 (16.5%) | 3.31 |
| Total Families | 194 (100.0%) | 2.75 |
Median Household Size in Middle Point
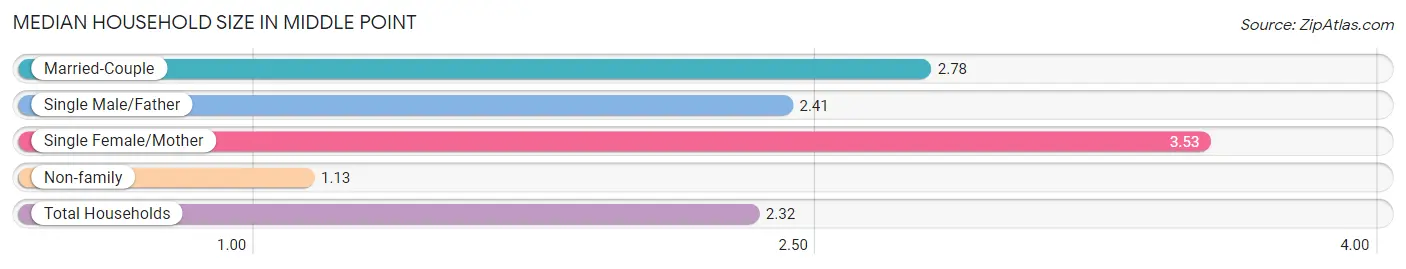
The median household size in Middle Point is 2.32 persons per household, with single female/mother households (32 | 11.5%) accounting for the largest median household size of 3.53 persons per household. non-family households (85 | 30.5%) represent the smallest median household size with 1.13 persons per household.
| Household Type | # Households | Household Size |
| Married-Couple | 125 (44.8%) | 2.78 |
| Single Male/Father | 37 (13.3%) | 2.41 |
| Single Female/Mother | 32 (11.5%) | 3.53 |
| Non-family | 85 (30.5%) | 1.13 |
| Total Households | 279 (100.0%) | 2.32 |
Household Size by Marriage Status in Middle Point
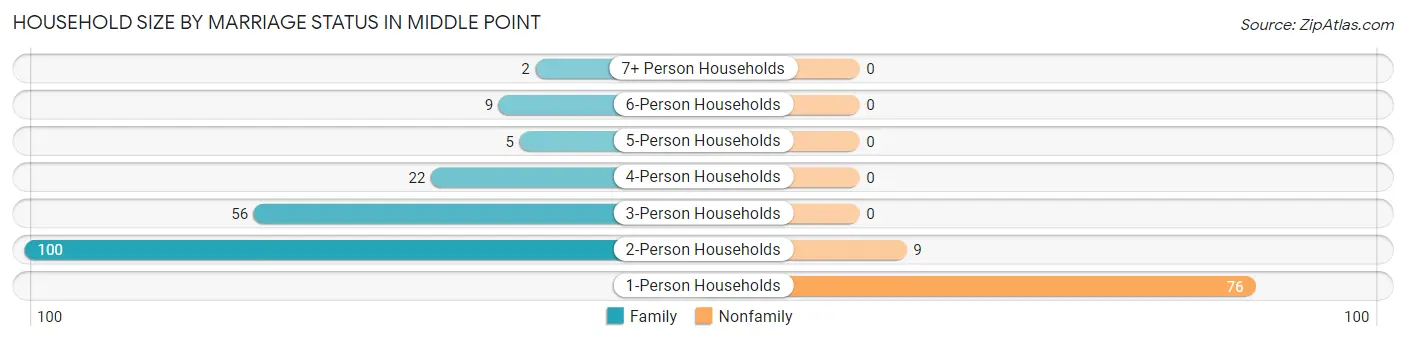
Out of a total of 279 households in Middle Point, 194 (69.5%) are family households, while 85 (30.5%) are nonfamily households. The most numerous type of family households are 2-person households, comprising 100, and the most common type of nonfamily households are 1-person households, comprising 76.
| Household Size | Family Households | Nonfamily Households |
| 1-Person Households | - | 76 (27.2%) |
| 2-Person Households | 100 (35.8%) | 9 (3.2%) |
| 3-Person Households | 56 (20.1%) | 0 (0.0%) |
| 4-Person Households | 22 (7.9%) | 0 (0.0%) |
| 5-Person Households | 5 (1.8%) | 0 (0.0%) |
| 6-Person Households | 9 (3.2%) | 0 (0.0%) |
| 7+ Person Households | 2 (0.7%) | 0 (0.0%) |
| Total | 194 (69.5%) | 85 (30.5%) |
Female Fertility in Middle Point
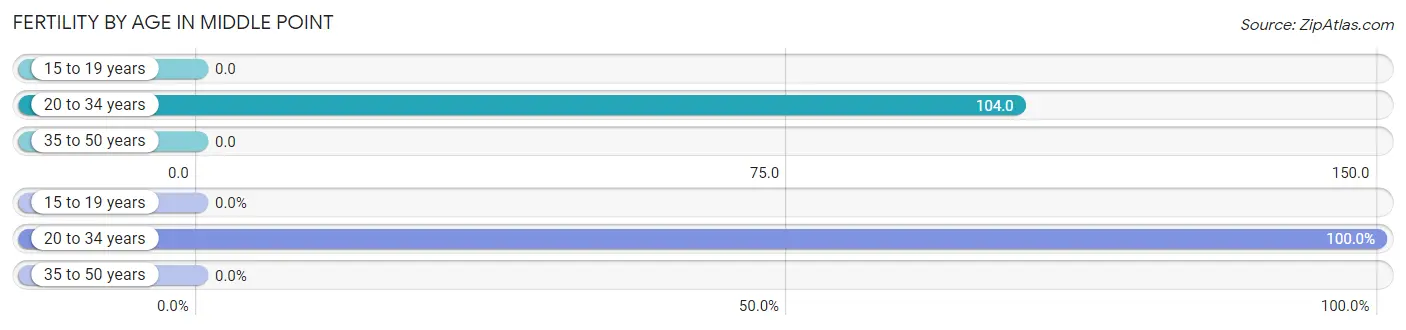
Fertility by Age in Middle Point
Average fertility rate in Middle Point is 34.0 births per 1,000 women. Women in the age bracket of 20 to 34 years have the highest fertility rate with 104.0 births per 1,000 women. Women in the age bracket of 20 to 34 years acount for 100.0% of all women with births.
| Age Bracket | Women with Births | Births / 1,000 Women |
| 15 to 19 years | 0 (0.0%) | 0.0 |
| 20 to 34 years | 5 (100.0%) | 104.0 |
| 35 to 50 years | 0 (0.0%) | 0.0 |
| Total | 5 (100.0%) | 34.0 |
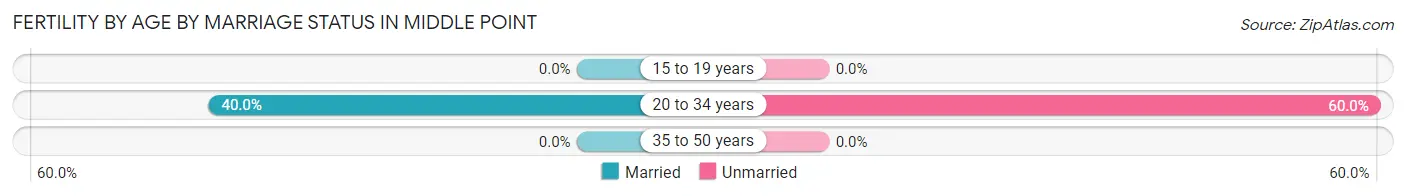
Fertility by Age by Marriage Status in Middle Point
40.0% of women with births (5) in Middle Point are married. The highest percentage of unmarried women with births falls into 20 to 34 years age bracket with 60.0% of them unmarried at the time of birth, while the lowest percentage of unmarried women with births belong to 20 to 34 years age bracket with 60.0% of them unmarried.
| Age Bracket | Married | Unmarried |
| 15 to 19 years | 0 (0.0%) | 0 (0.0%) |
| 20 to 34 years | 2 (40.0%) | 3 (60.0%) |
| 35 to 50 years | 0 (0.0%) | 0 (0.0%) |
| Total | 2 (40.0%) | 3 (60.0%) |
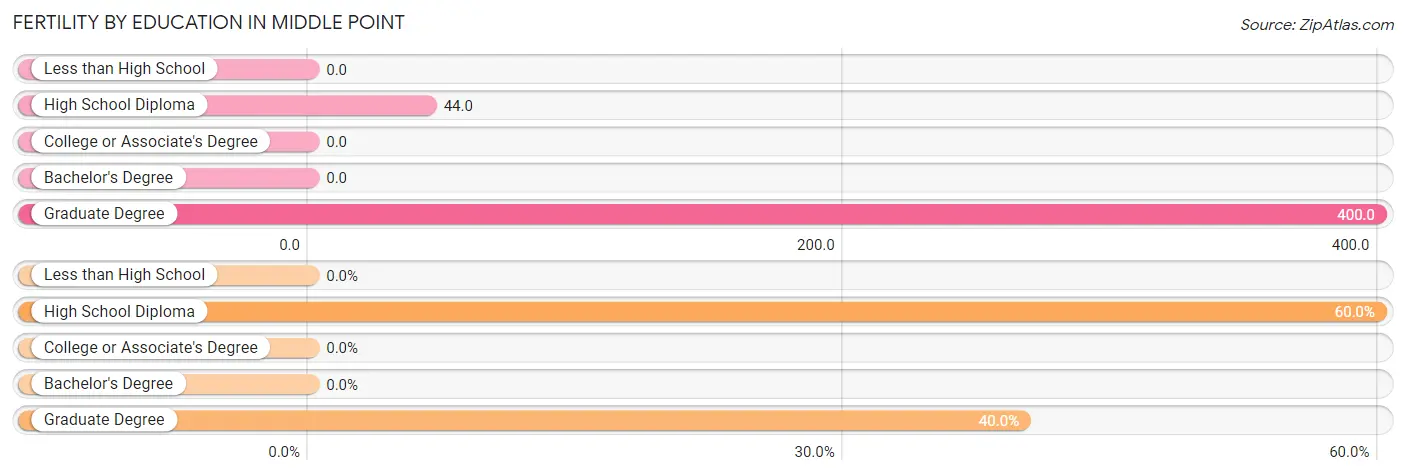
Fertility by Education in Middle Point
| Educational Attainment | Women with Births | Births / 1,000 Women |
| Less than High School | 0 (0.0%) | 0.0 |
| High School Diploma | 3 (60.0%) | 44.0 |
| College or Associate's Degree | 0 (0.0%) | 0.0 |
| Bachelor's Degree | 0 (0.0%) | 0.0 |
| Graduate Degree | 2 (40.0%) | 400.0 |
| Total | 5 (100.0%) | 34.0 |
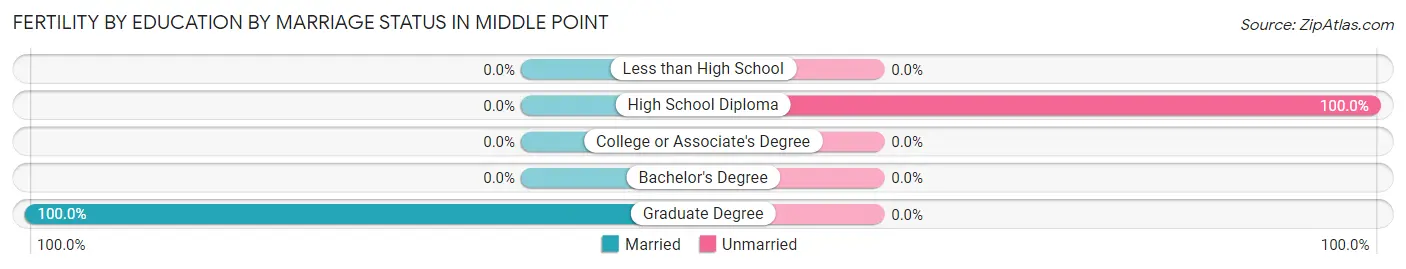
Fertility by Education by Marriage Status in Middle Point
60.0% of women with births in Middle Point are unmarried. Women with the educational attainment of graduate degree are most likely to be married with 100.0% of them married at childbirth, while women with the educational attainment of high school diploma are least likely to be married with 100.0% of them unmarried at childbirth.
| Educational Attainment | Married | Unmarried |
| Less than High School | 0 (0.0%) | 0 (0.0%) |
| High School Diploma | 0 (0.0%) | 3 (100.0%) |
| College or Associate's Degree | 0 (0.0%) | 0 (0.0%) |
| Bachelor's Degree | 0 (0.0%) | 0 (0.0%) |
| Graduate Degree | 2 (100.0%) | 0 (0.0%) |
| Total | 2 (40.0%) | 3 (60.0%) |
Employment Characteristics in Middle Point
Employment by Class of Employer in Middle Point
Among the 375 employed individuals in Middle Point, private company employees (284 | 75.7%), local government employees (33 | 8.8%), and not-for-profit organizations (23 | 6.1%) make up the most common classes of employment.
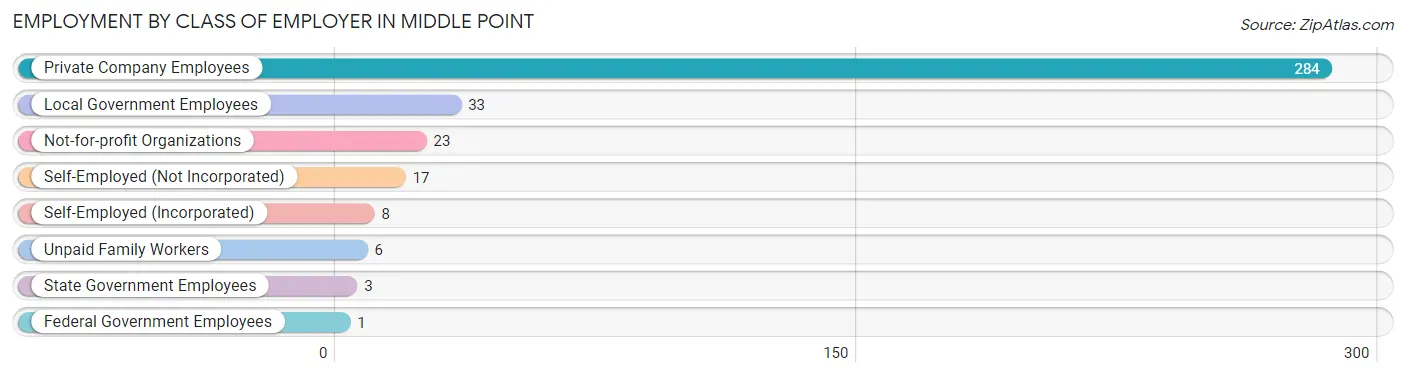
| Employer Class | # Employees | % Employees |
| Private Company Employees | 284 | 75.7% |
| Self-Employed (Incorporated) | 8 | 2.1% |
| Self-Employed (Not Incorporated) | 17 | 4.5% |
| Not-for-profit Organizations | 23 | 6.1% |
| Local Government Employees | 33 | 8.8% |
| State Government Employees | 3 | 0.8% |
| Federal Government Employees | 1 | 0.3% |
| Unpaid Family Workers | 6 | 1.6% |
| Total | 375 | 100.0% |
Employment Status by Age in Middle Point
According to the labor force statistics for Middle Point, out of the total population over 16 years of age (526), 72.2% or 380 individuals are in the labor force, with 1.3% or 5 of them unemployed. The age group with the highest labor force participation rate is 20 to 24 years, with 100.0% or 20 individuals in the labor force. Within the labor force, the 35 to 44 years age range has the highest percentage of unemployed individuals, with 3.2% or 3 of them being unemployed.
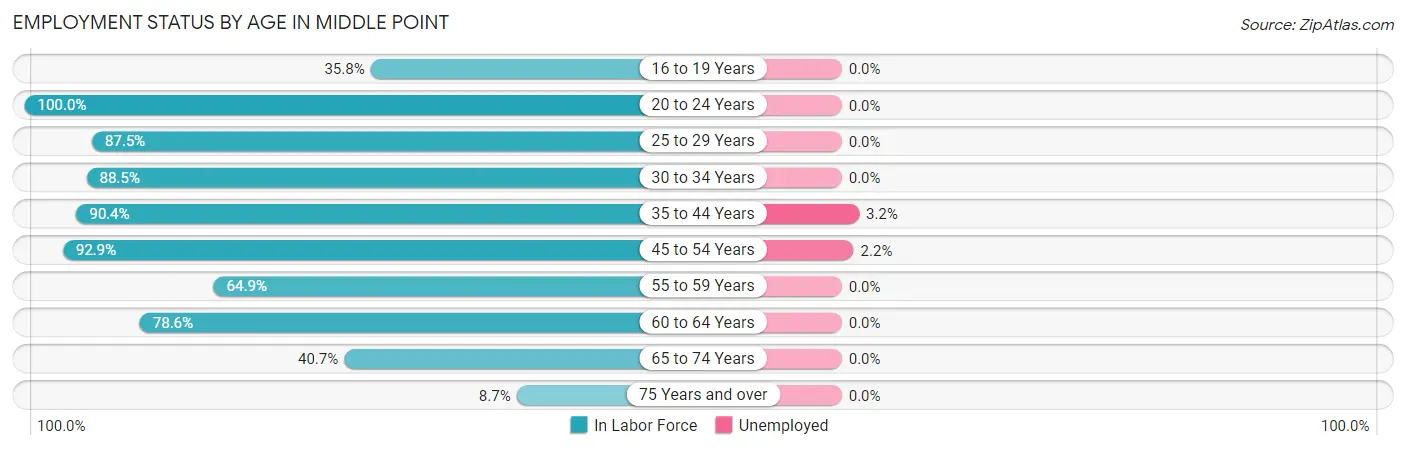
| Age Bracket | In Labor Force | Unemployed |
| 16 to 19 Years | 24 (35.8%) | 0 (0.0%) |
| 20 to 24 Years | 20 (100.0%) | 0 (0.0%) |
| 25 to 29 Years | 56 (87.5%) | 0 (0.0%) |
| 30 to 34 Years | 23 (88.5%) | 0 (0.0%) |
| 35 to 44 Years | 94 (90.4%) | 3 (3.2%) |
| 45 to 54 Years | 91 (92.9%) | 2 (2.2%) |
| 55 to 59 Years | 24 (64.9%) | 0 (0.0%) |
| 60 to 64 Years | 22 (78.6%) | 0 (0.0%) |
| 65 to 74 Years | 24 (40.7%) | 0 (0.0%) |
| 75 Years and over | 2 (8.7%) | 0 (0.0%) |
| Total | 380 (72.2%) | 5 (1.3%) |
Employment Status by Educational Attainment in Middle Point
According to labor force statistics for Middle Point, 86.8% of individuals (310) out of the total population between 25 and 64 years of age (357) are in the labor force, with 1.6% or 5 of them being unemployed. The group with the highest labor force participation rate are those with the educational attainment of bachelor's degree or higher, with 91.7% or 44 individuals in the labor force. Within the labor force, individuals with high school diploma education have the highest percentage of unemployment, with 3.0% or 5 of them being unemployed.
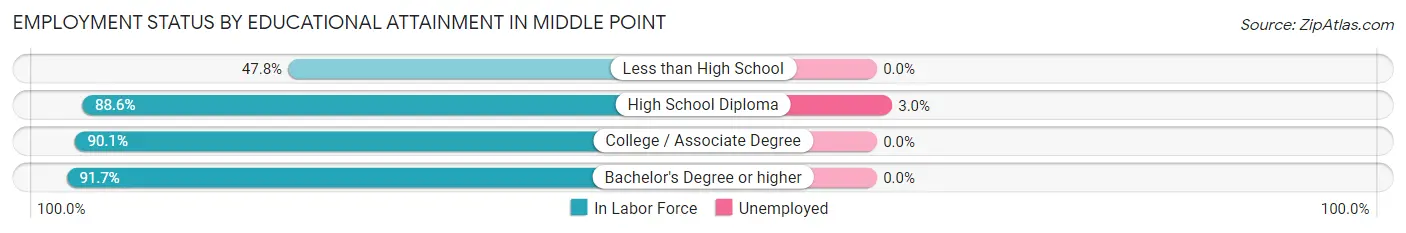
| Educational Attainment | In Labor Force | Unemployed |
| Less than High School | 11 (47.8%) | 0 (0.0%) |
| High School Diploma | 164 (88.6%) | 6 (3.0%) |
| College / Associate Degree | 91 (90.1%) | 0 (0.0%) |
| Bachelor's Degree or higher | 44 (91.7%) | 0 (0.0%) |
| Total | 310 (86.8%) | 6 (1.6%) |
Employment Occupations by Sex in Middle Point
Management, Business, Science and Arts Occupations
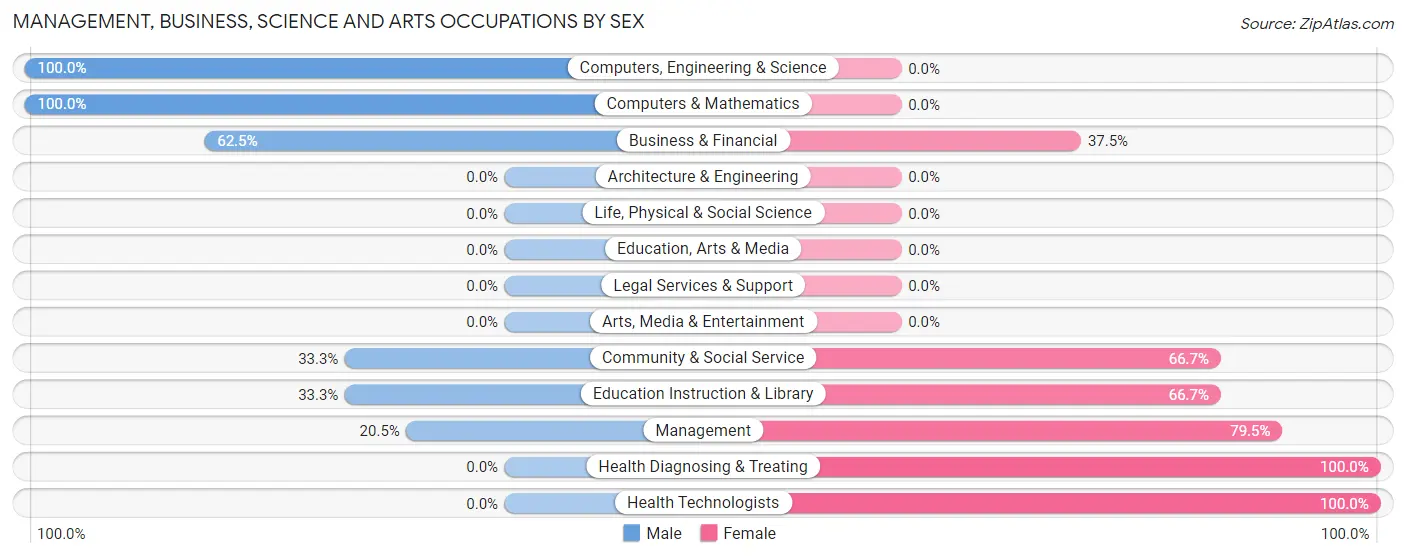
The most common Management, Business, Science and Arts occupations in Middle Point are Management (39 | 10.4%), Health Diagnosing & Treating (13 | 3.5%), Health Technologists (11 | 2.9%), Community & Social Service (9 | 2.4%), and Education Instruction & Library (9 | 2.4%).
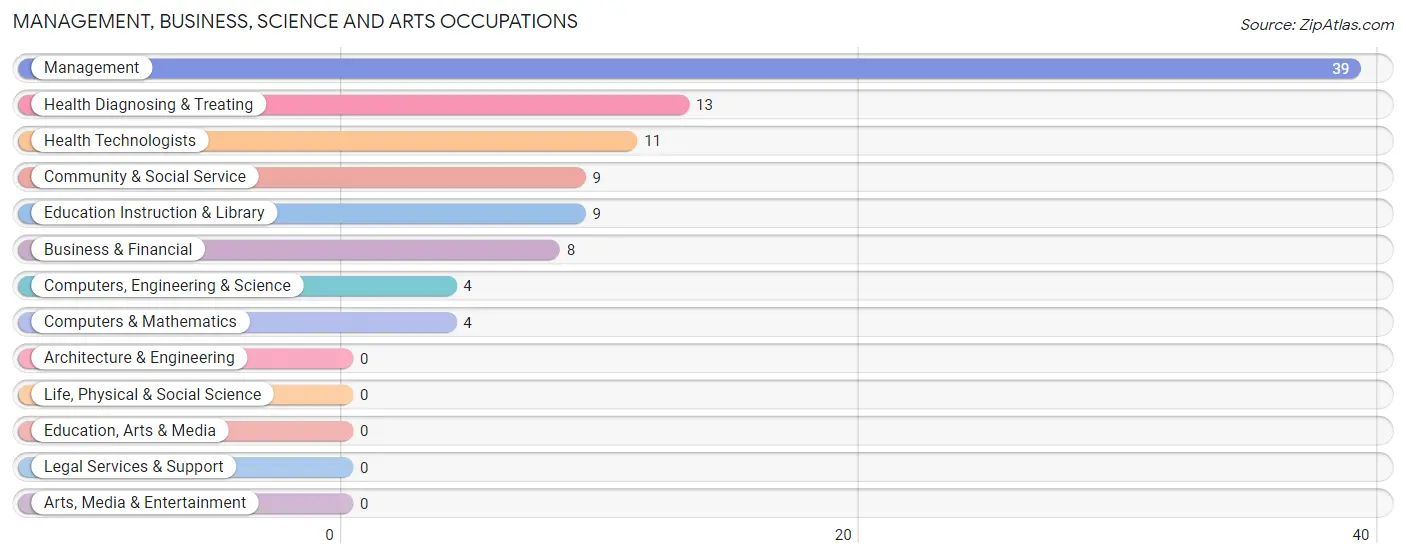
Management, Business, Science and Arts Occupations by Sex
Within the Management, Business, Science and Arts occupations in Middle Point, the most male-oriented occupations are Computers, Engineering & Science (100.0%), Computers & Mathematics (100.0%), and Business & Financial (62.5%), while the most female-oriented occupations are Health Diagnosing & Treating (100.0%), Health Technologists (100.0%), and Management (79.5%).
| Occupation | Male | Female |
| Management | 8 (20.5%) | 31 (79.5%) |
| Business & Financial | 5 (62.5%) | 3 (37.5%) |
| Computers, Engineering & Science | 4 (100.0%) | 0 (0.0%) |
| Computers & Mathematics | 4 (100.0%) | 0 (0.0%) |
| Architecture & Engineering | 0 (0.0%) | 0 (0.0%) |
| Life, Physical & Social Science | 0 (0.0%) | 0 (0.0%) |
| Community & Social Service | 3 (33.3%) | 6 (66.7%) |
| Education, Arts & Media | 0 (0.0%) | 0 (0.0%) |
| Legal Services & Support | 0 (0.0%) | 0 (0.0%) |
| Education Instruction & Library | 3 (33.3%) | 6 (66.7%) |
| Arts, Media & Entertainment | 0 (0.0%) | 0 (0.0%) |
| Health Diagnosing & Treating | 0 (0.0%) | 13 (100.0%) |
| Health Technologists | 0 (0.0%) | 11 (100.0%) |
| Total (Category) | 20 (27.4%) | 53 (72.6%) |
| Total (Overall) | 203 (54.1%) | 172 (45.9%) |
Services Occupations
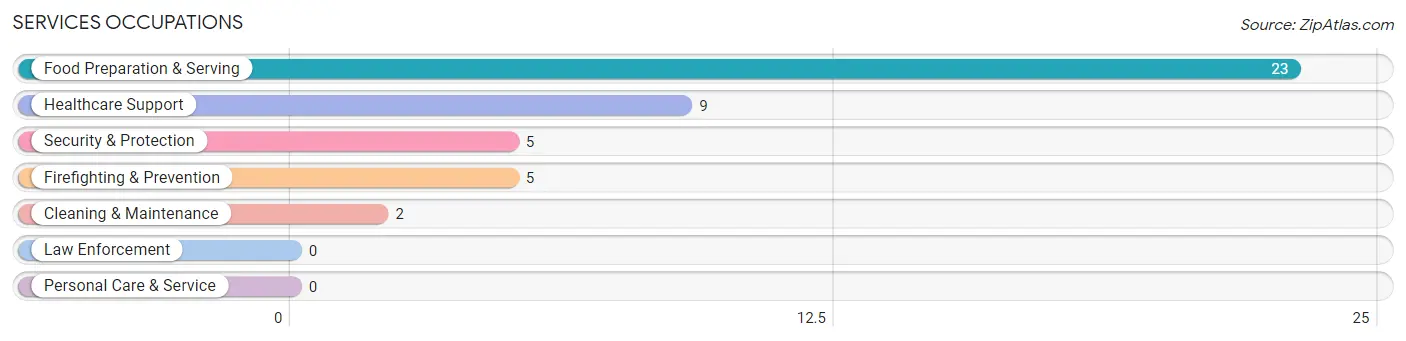
The most common Services occupations in Middle Point are Food Preparation & Serving (23 | 6.1%), Healthcare Support (9 | 2.4%), Security & Protection (5 | 1.3%), Firefighting & Prevention (5 | 1.3%), and Cleaning & Maintenance (2 | 0.5%).
Services Occupations by Sex
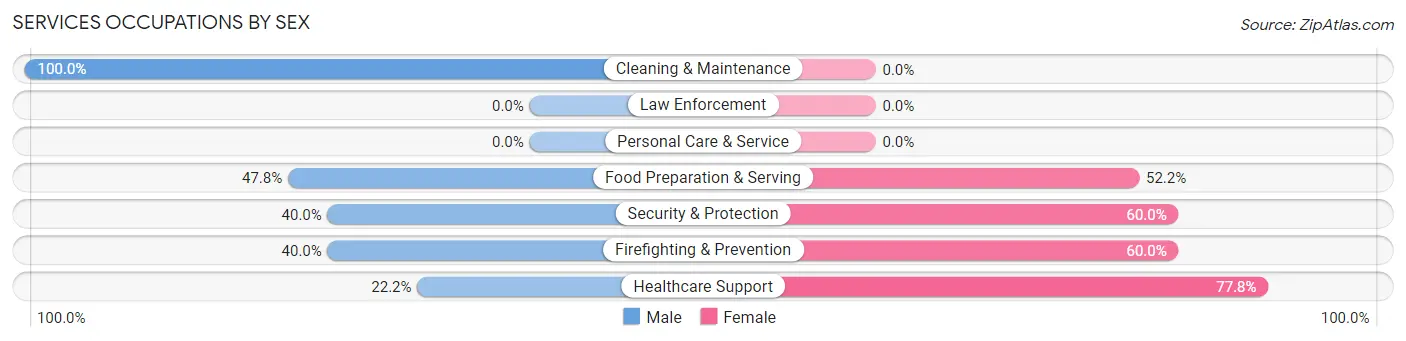
Within the Services occupations in Middle Point, the most male-oriented occupations are Cleaning & Maintenance (100.0%), Food Preparation & Serving (47.8%), and Security & Protection (40.0%), while the most female-oriented occupations are Healthcare Support (77.8%), Security & Protection (60.0%), and Firefighting & Prevention (60.0%).
| Occupation | Male | Female |
| Healthcare Support | 2 (22.2%) | 7 (77.8%) |
| Security & Protection | 2 (40.0%) | 3 (60.0%) |
| Firefighting & Prevention | 2 (40.0%) | 3 (60.0%) |
| Law Enforcement | 0 (0.0%) | 0 (0.0%) |
| Food Preparation & Serving | 11 (47.8%) | 12 (52.2%) |
| Cleaning & Maintenance | 2 (100.0%) | 0 (0.0%) |
| Personal Care & Service | 0 (0.0%) | 0 (0.0%) |
| Total (Category) | 17 (43.6%) | 22 (56.4%) |
| Total (Overall) | 203 (54.1%) | 172 (45.9%) |
Sales and Office Occupations
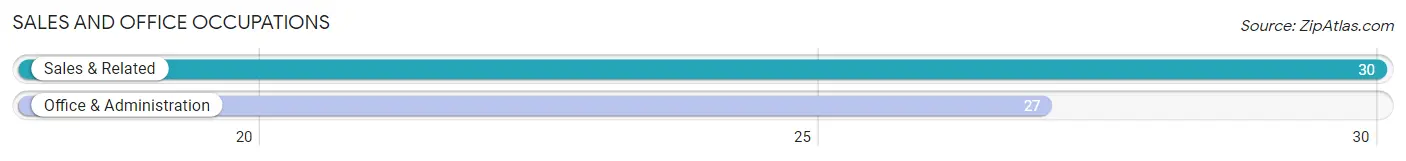
The most common Sales and Office occupations in Middle Point are Sales & Related (30 | 8.0%), and Office & Administration (27 | 7.2%).
Sales and Office Occupations by Sex
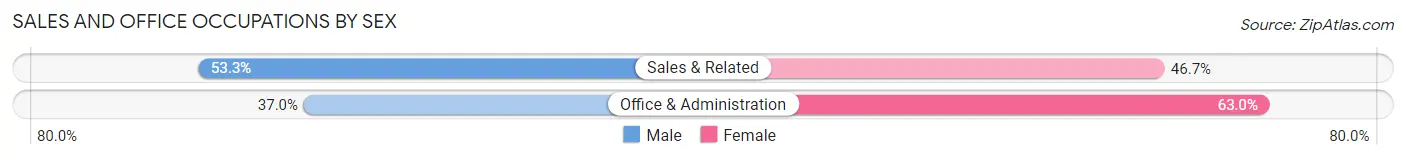
| Occupation | Male | Female |
| Sales & Related | 16 (53.3%) | 14 (46.7%) |
| Office & Administration | 10 (37.0%) | 17 (63.0%) |
| Total (Category) | 26 (45.6%) | 31 (54.4%) |
| Total (Overall) | 203 (54.1%) | 172 (45.9%) |
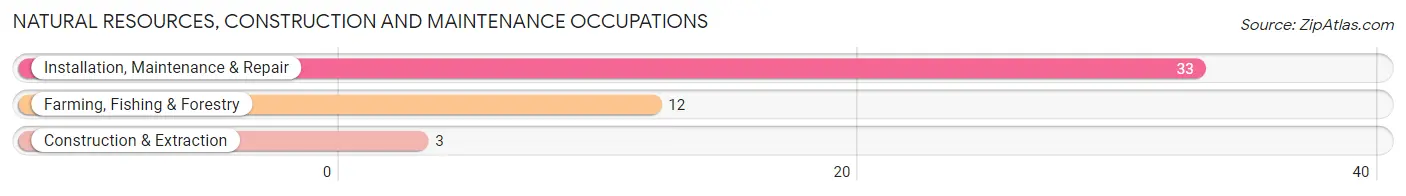
Natural Resources, Construction and Maintenance Occupations
The most common Natural Resources, Construction and Maintenance occupations in Middle Point are Installation, Maintenance & Repair (33 | 8.8%), Farming, Fishing & Forestry (12 | 3.2%), and Construction & Extraction (3 | 0.8%).
Natural Resources, Construction and Maintenance Occupations by Sex
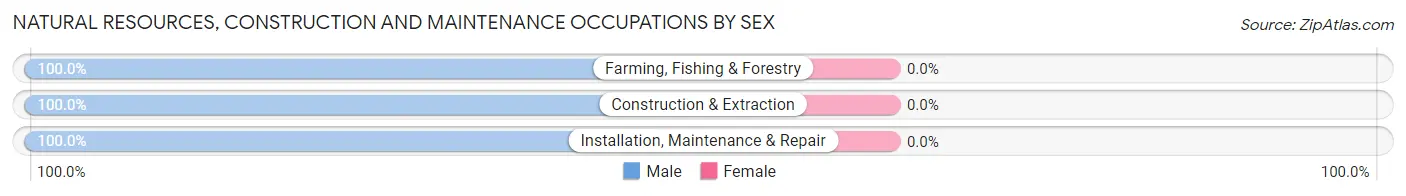
| Occupation | Male | Female |
| Farming, Fishing & Forestry | 12 (100.0%) | 0 (0.0%) |
| Construction & Extraction | 3 (100.0%) | 0 (0.0%) |
| Installation, Maintenance & Repair | 33 (100.0%) | 0 (0.0%) |
| Total (Category) | 48 (100.0%) | 0 (0.0%) |
| Total (Overall) | 203 (54.1%) | 172 (45.9%) |
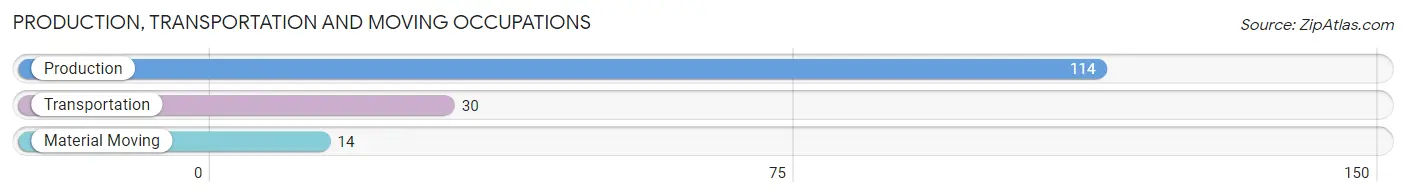
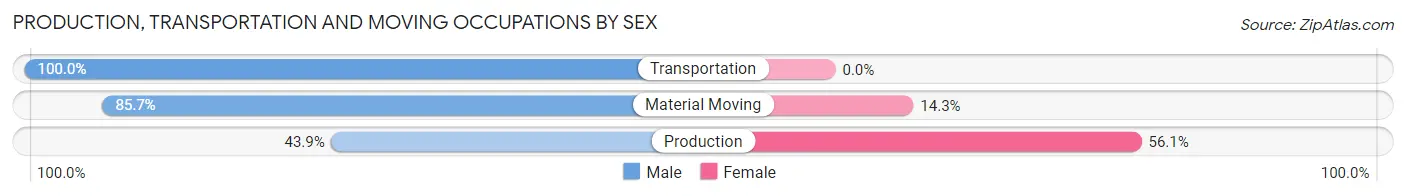
Production, Transportation and Moving Occupations
The most common Production, Transportation and Moving occupations in Middle Point are Production (114 | 30.4%), Transportation (30 | 8.0%), and Material Moving (14 | 3.7%).
Production, Transportation and Moving Occupations by Sex
| Occupation | Male | Female |
| Production | 50 (43.9%) | 64 (56.1%) |
| Transportation | 30 (100.0%) | 0 (0.0%) |
| Material Moving | 12 (85.7%) | 2 (14.3%) |
| Total (Category) | 92 (58.2%) | 66 (41.8%) |
| Total (Overall) | 203 (54.1%) | 172 (45.9%) |
Employment Industries by Sex in Middle Point
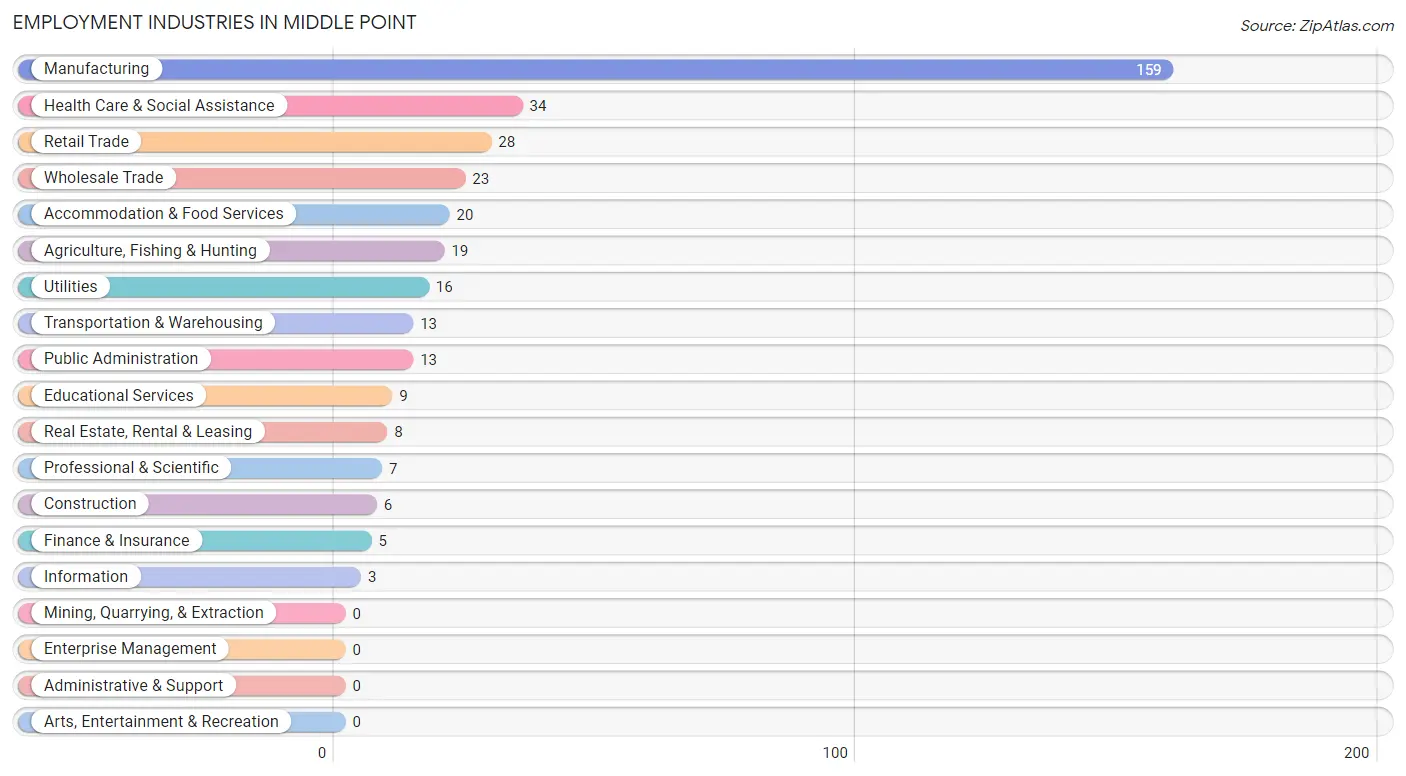
Employment Industries in Middle Point
The major employment industries in Middle Point include Manufacturing (159 | 42.4%), Health Care & Social Assistance (34 | 9.1%), Retail Trade (28 | 7.5%), Wholesale Trade (23 | 6.1%), and Accommodation & Food Services (20 | 5.3%).
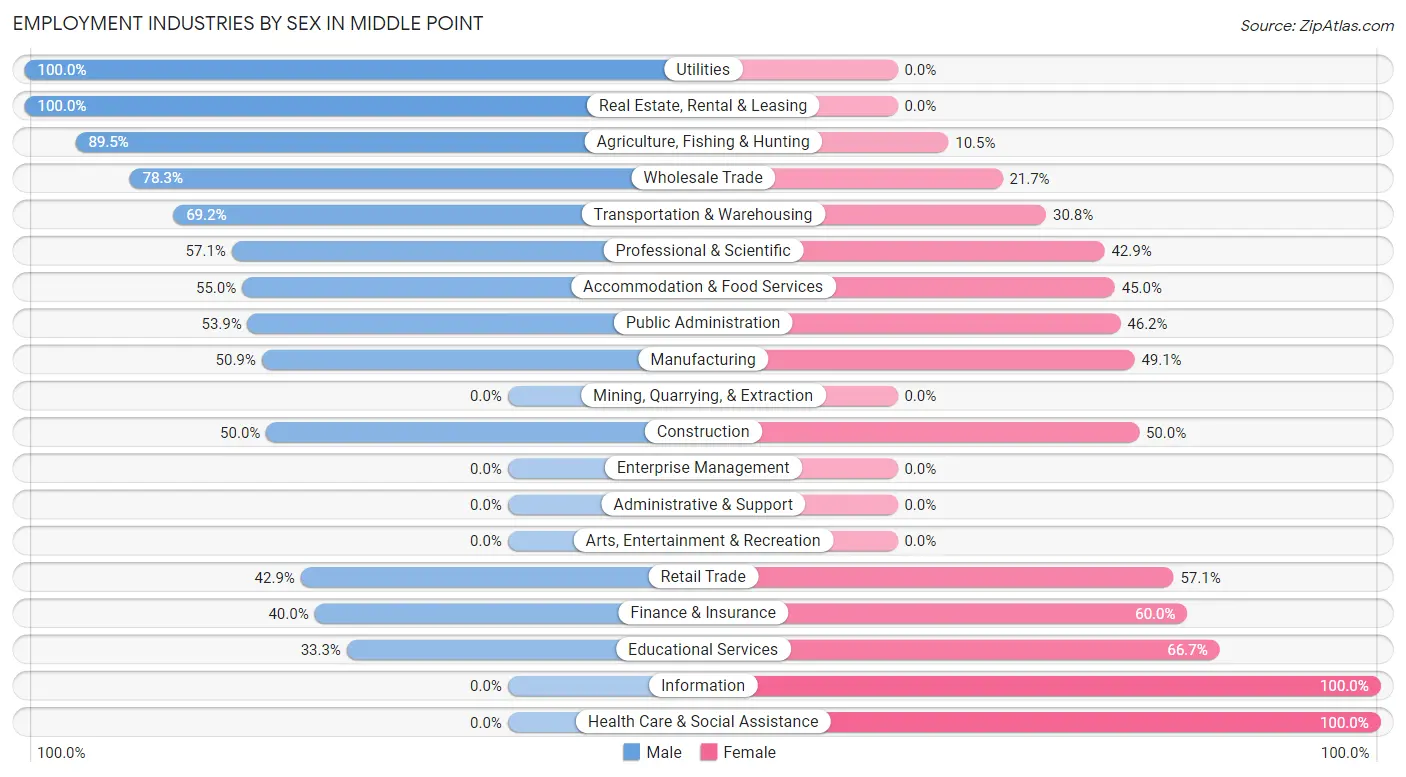
Employment Industries by Sex in Middle Point
The Middle Point industries that see more men than women are Utilities (100.0%), Real Estate, Rental & Leasing (100.0%), and Agriculture, Fishing & Hunting (89.5%), whereas the industries that tend to have a higher number of women are Information (100.0%), Health Care & Social Assistance (100.0%), and Educational Services (66.7%).
| Industry | Male | Female |
| Agriculture, Fishing & Hunting | 17 (89.5%) | 2 (10.5%) |
| Mining, Quarrying, & Extraction | 0 (0.0%) | 0 (0.0%) |
| Construction | 3 (50.0%) | 3 (50.0%) |
| Manufacturing | 81 (50.9%) | 78 (49.1%) |
| Wholesale Trade | 18 (78.3%) | 5 (21.7%) |
| Retail Trade | 12 (42.9%) | 16 (57.1%) |
| Transportation & Warehousing | 9 (69.2%) | 4 (30.8%) |
| Utilities | 16 (100.0%) | 0 (0.0%) |
| Information | 0 (0.0%) | 3 (100.0%) |
| Finance & Insurance | 2 (40.0%) | 3 (60.0%) |
| Real Estate, Rental & Leasing | 8 (100.0%) | 0 (0.0%) |
| Professional & Scientific | 4 (57.1%) | 3 (42.9%) |
| Enterprise Management | 0 (0.0%) | 0 (0.0%) |
| Administrative & Support | 0 (0.0%) | 0 (0.0%) |
| Educational Services | 3 (33.3%) | 6 (66.7%) |
| Health Care & Social Assistance | 0 (0.0%) | 34 (100.0%) |
| Arts, Entertainment & Recreation | 0 (0.0%) | 0 (0.0%) |
| Accommodation & Food Services | 11 (55.0%) | 9 (45.0%) |
| Public Administration | 7 (53.8%) | 6 (46.2%) |
| Total | 203 (54.1%) | 172 (45.9%) |
Education in Middle Point
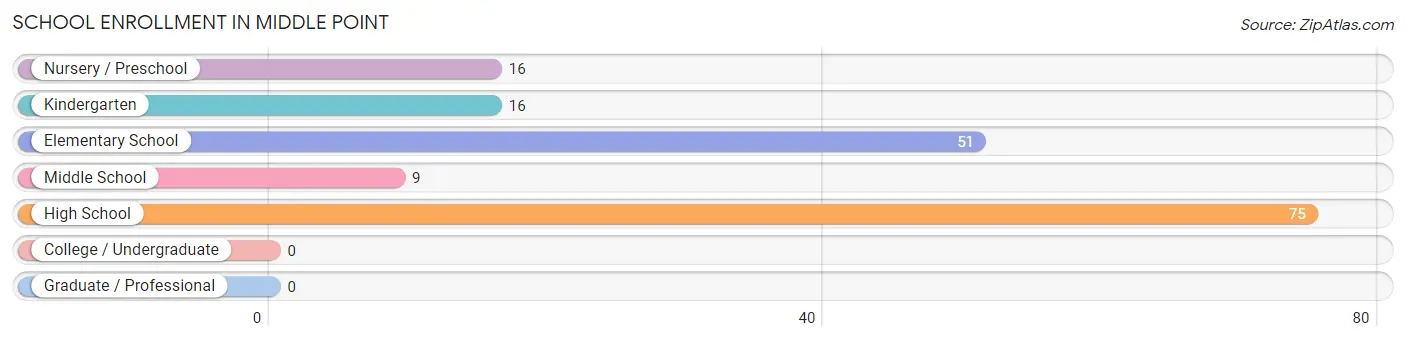
School Enrollment in Middle Point
The most common levels of schooling among the 167 students in Middle Point are high school (75 | 44.9%), elementary school (51 | 30.5%), and nursery / preschool (16 | 9.6%).
| School Level | # Students | % Students |
| Nursery / Preschool | 16 | 9.6% |
| Kindergarten | 16 | 9.6% |
| Elementary School | 51 | 30.5% |
| Middle School | 9 | 5.4% |
| High School | 75 | 44.9% |
| College / Undergraduate | 0 | 0.0% |
| Graduate / Professional | 0 | 0.0% |
| Total | 167 | 100.0% |
School Enrollment by Age by Funding Source in Middle Point
Out of a total of 167 students who are enrolled in schools in Middle Point, 17 (10.2%) attend a private institution, while the remaining 150 (89.8%) are enrolled in public schools. The age group of 3 to 4 year olds has the highest likelihood of being enrolled in private schools, with 3 (27.3% in the age bracket) enrolled. Conversely, the age group of 5 to 9 year old has the lowest likelihood of being enrolled in a private school, with 65 (100.0% in the age bracket) attending a public institution.
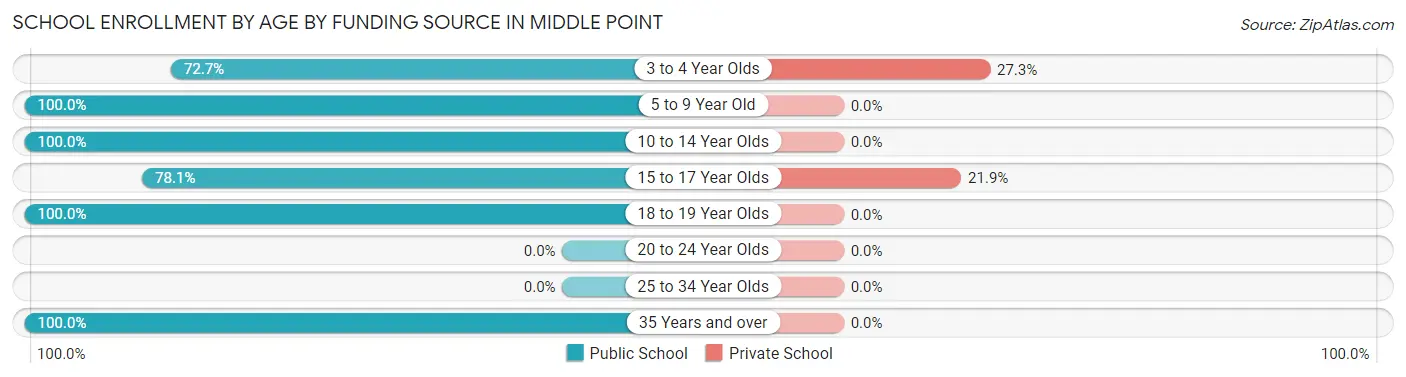
| Age Bracket | Public School | Private School |
| 3 to 4 Year Olds | 8 (72.7%) | 3 (27.3%) |
| 5 to 9 Year Old | 65 (100.0%) | 0 (0.0%) |
| 10 to 14 Year Olds | 19 (100.0%) | 0 (0.0%) |
| 15 to 17 Year Olds | 50 (78.1%) | 14 (21.9%) |
| 18 to 19 Year Olds | 5 (100.0%) | 0 (0.0%) |
| 20 to 24 Year Olds | 0 (0.0%) | 0 (0.0%) |
| 25 to 34 Year Olds | 0 (0.0%) | 0 (0.0%) |
| 35 Years and over | 3 (100.0%) | 0 (0.0%) |
| Total | 150 (89.8%) | 17 (10.2%) |
Educational Attainment by Field of Study in Middle Point
Education (31 | 55.4%), business (6 | 10.7%), arts & humanities (6 | 10.7%), liberal arts & history (4 | 7.1%), and bio, nature & agricultural (3 | 5.4%) are the most common fields of study among 56 individuals in Middle Point who have obtained a bachelor's degree or higher.
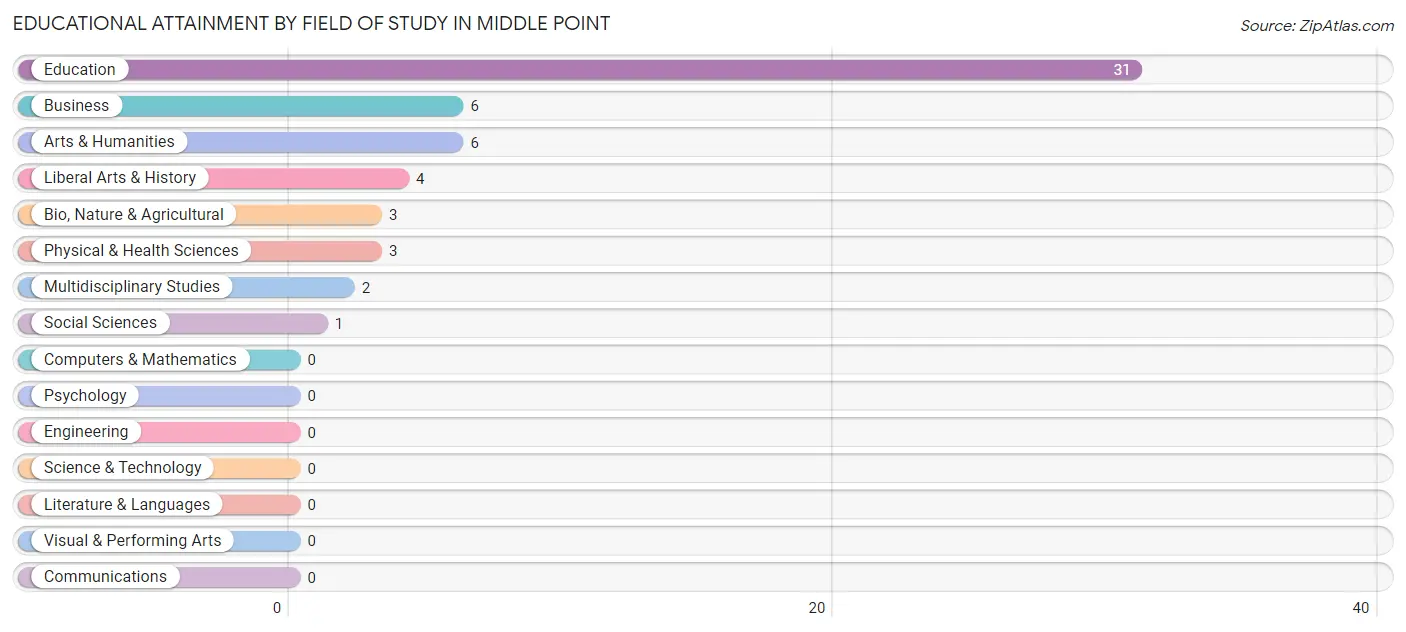
| Field of Study | # Graduates | % Graduates |
| Computers & Mathematics | 0 | 0.0% |
| Bio, Nature & Agricultural | 3 | 5.4% |
| Physical & Health Sciences | 3 | 5.4% |
| Psychology | 0 | 0.0% |
| Social Sciences | 1 | 1.8% |
| Engineering | 0 | 0.0% |
| Multidisciplinary Studies | 2 | 3.6% |
| Science & Technology | 0 | 0.0% |
| Business | 6 | 10.7% |
| Education | 31 | 55.4% |
| Literature & Languages | 0 | 0.0% |
| Liberal Arts & History | 4 | 7.1% |
| Visual & Performing Arts | 0 | 0.0% |
| Communications | 0 | 0.0% |
| Arts & Humanities | 6 | 10.7% |
| Total | 56 | 100.0% |
Transportation & Commute in Middle Point
Vehicle Availability by Sex in Middle Point
The most prevalent vehicle ownership categories in Middle Point are males with 2 vehicles (80, accounting for 39.4%) and females with 2 vehicles (81, making up 46.5%).
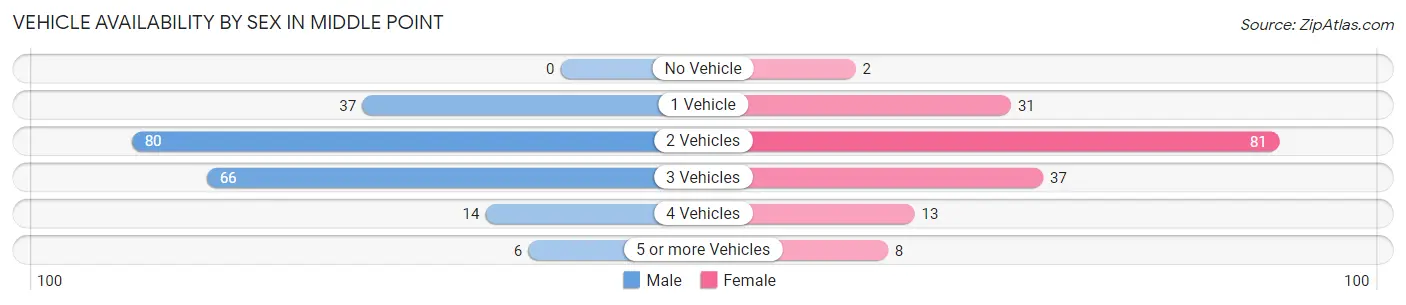
| Vehicles Available | Male | Female |
| No Vehicle | 0 (0.0%) | 2 (1.2%) |
| 1 Vehicle | 37 (18.2%) | 31 (18.0%) |
| 2 Vehicles | 80 (39.4%) | 81 (47.1%) |
| 3 Vehicles | 66 (32.5%) | 37 (21.5%) |
| 4 Vehicles | 14 (6.9%) | 13 (7.6%) |
| 5 or more Vehicles | 6 (3.0%) | 8 (4.6%) |
| Total | 203 (100.0%) | 172 (100.0%) |
Commute Time in Middle Point
The most frequently occuring commute durations in Middle Point are 15 to 19 minutes (113 commuters, 32.1%), 10 to 14 minutes (60 commuters, 17.1%), and 20 to 24 minutes (35 commuters, 9.9%).
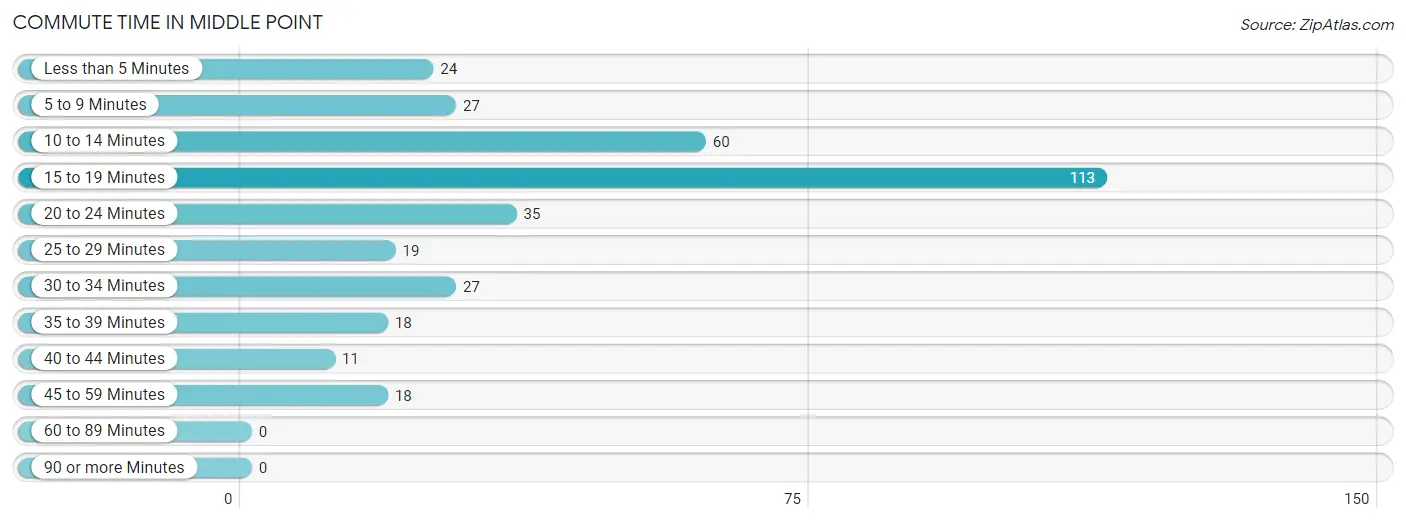
| Commute Time | # Commuters | % Commuters |
| Less than 5 Minutes | 24 | 6.8% |
| 5 to 9 Minutes | 27 | 7.7% |
| 10 to 14 Minutes | 60 | 17.1% |
| 15 to 19 Minutes | 113 | 32.1% |
| 20 to 24 Minutes | 35 | 9.9% |
| 25 to 29 Minutes | 19 | 5.4% |
| 30 to 34 Minutes | 27 | 7.7% |
| 35 to 39 Minutes | 18 | 5.1% |
| 40 to 44 Minutes | 11 | 3.1% |
| 45 to 59 Minutes | 18 | 5.1% |
| 60 to 89 Minutes | 0 | 0.0% |
| 90 or more Minutes | 0 | 0.0% |
Commute Time by Sex in Middle Point
The most common commute times in Middle Point are 10 to 14 minutes (39 commuters, 19.2%) for males and 15 to 19 minutes (83 commuters, 55.7%) for females.
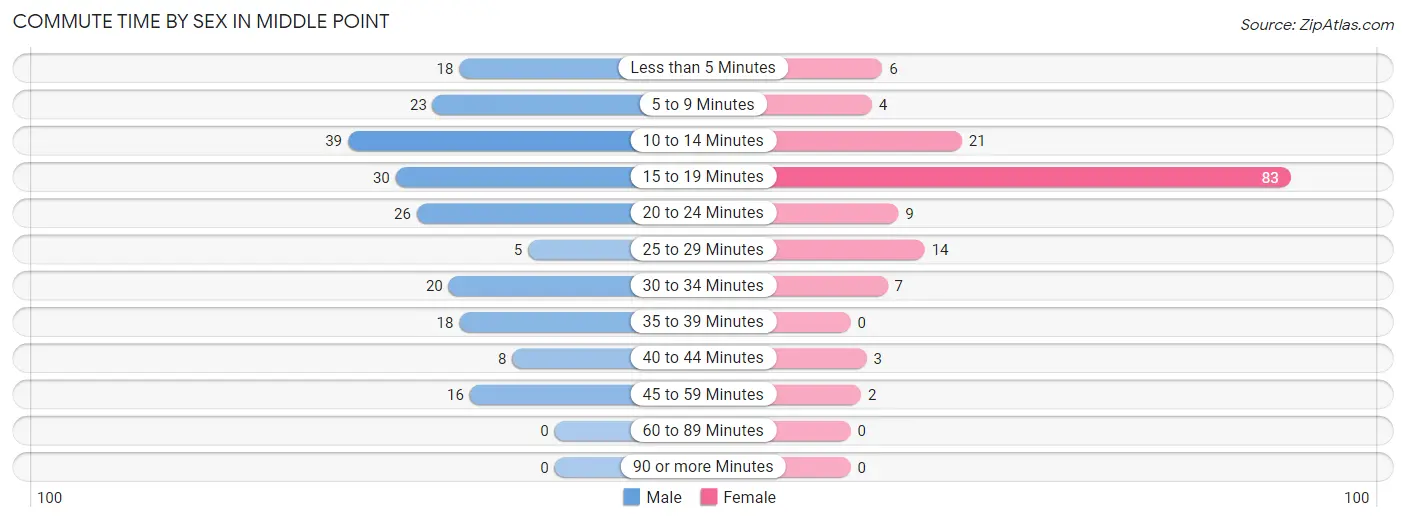
| Commute Time | Male | Female |
| Less than 5 Minutes | 18 (8.9%) | 6 (4.0%) |
| 5 to 9 Minutes | 23 (11.3%) | 4 (2.7%) |
| 10 to 14 Minutes | 39 (19.2%) | 21 (14.1%) |
| 15 to 19 Minutes | 30 (14.8%) | 83 (55.7%) |
| 20 to 24 Minutes | 26 (12.8%) | 9 (6.0%) |
| 25 to 29 Minutes | 5 (2.5%) | 14 (9.4%) |
| 30 to 34 Minutes | 20 (9.9%) | 7 (4.7%) |
| 35 to 39 Minutes | 18 (8.9%) | 0 (0.0%) |
| 40 to 44 Minutes | 8 (3.9%) | 3 (2.0%) |
| 45 to 59 Minutes | 16 (7.9%) | 2 (1.3%) |
| 60 to 89 Minutes | 0 (0.0%) | 0 (0.0%) |
| 90 or more Minutes | 0 (0.0%) | 0 (0.0%) |
Time of Departure to Work by Sex in Middle Point
The most frequent times of departure to work in Middle Point are 6:00 AM to 6:29 AM (36, 17.7%) for males and 6:30 AM to 6:59 AM (44, 29.5%) for females.
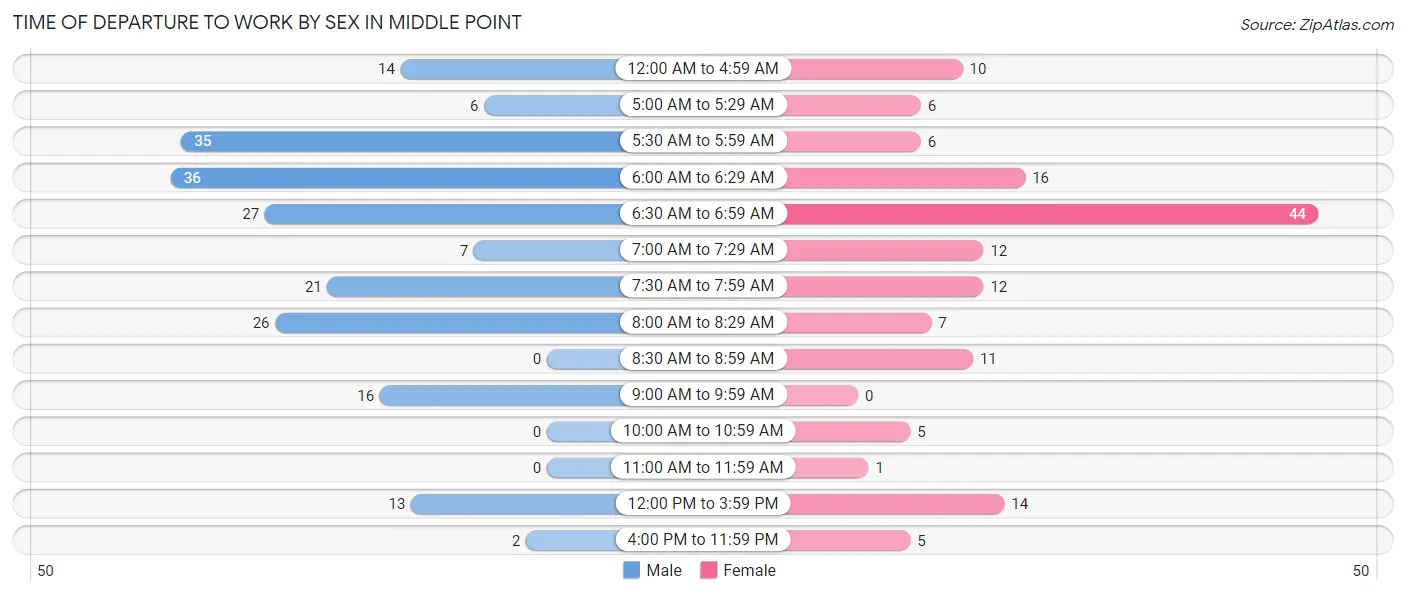
| Time of Departure | Male | Female |
| 12:00 AM to 4:59 AM | 14 (6.9%) | 10 (6.7%) |
| 5:00 AM to 5:29 AM | 6 (3.0%) | 6 (4.0%) |
| 5:30 AM to 5:59 AM | 35 (17.2%) | 6 (4.0%) |
| 6:00 AM to 6:29 AM | 36 (17.7%) | 16 (10.7%) |
| 6:30 AM to 6:59 AM | 27 (13.3%) | 44 (29.5%) |
| 7:00 AM to 7:29 AM | 7 (3.5%) | 12 (8.1%) |
| 7:30 AM to 7:59 AM | 21 (10.3%) | 12 (8.1%) |
| 8:00 AM to 8:29 AM | 26 (12.8%) | 7 (4.7%) |
| 8:30 AM to 8:59 AM | 0 (0.0%) | 11 (7.4%) |
| 9:00 AM to 9:59 AM | 16 (7.9%) | 0 (0.0%) |
| 10:00 AM to 10:59 AM | 0 (0.0%) | 5 (3.4%) |
| 11:00 AM to 11:59 AM | 0 (0.0%) | 1 (0.7%) |
| 12:00 PM to 3:59 PM | 13 (6.4%) | 14 (9.4%) |
| 4:00 PM to 11:59 PM | 2 (1.0%) | 5 (3.4%) |
| Total | 203 (100.0%) | 149 (100.0%) |
Housing Occupancy in Middle Point
Occupancy by Ownership in Middle Point
Of the total 279 dwellings in Middle Point, owner-occupied units account for 258 (92.5%), while renter-occupied units make up 21 (7.5%).
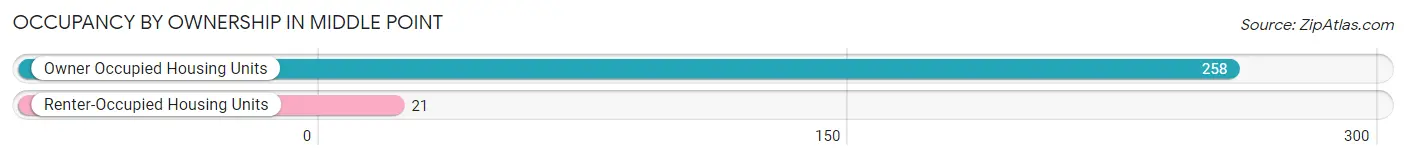
| Occupancy | # Housing Units | % Housing Units |
| Owner Occupied Housing Units | 258 | 92.5% |
| Renter-Occupied Housing Units | 21 | 7.5% |
| Total Occupied Housing Units | 279 | 100.0% |
Occupancy by Household Size in Middle Point
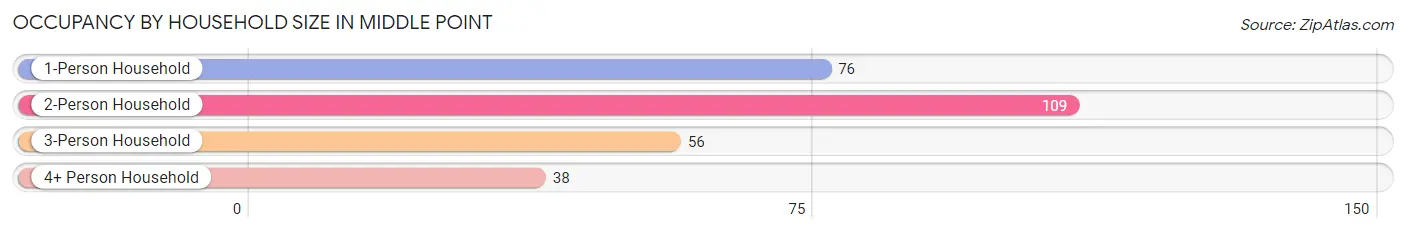
| Household Size | # Housing Units | % Housing Units |
| 1-Person Household | 76 | 27.2% |
| 2-Person Household | 109 | 39.1% |
| 3-Person Household | 56 | 20.1% |
| 4+ Person Household | 38 | 13.6% |
| Total Housing Units | 279 | 100.0% |
Occupancy by Ownership by Household Size in Middle Point
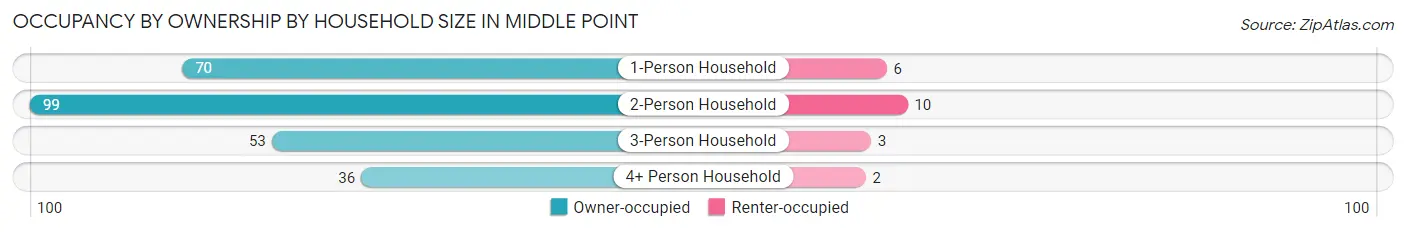
| Household Size | Owner-occupied | Renter-occupied |
| 1-Person Household | 70 (92.1%) | 6 (7.9%) |
| 2-Person Household | 99 (90.8%) | 10 (9.2%) |
| 3-Person Household | 53 (94.6%) | 3 (5.4%) |
| 4+ Person Household | 36 (94.7%) | 2 (5.3%) |
| Total Housing Units | 258 (92.5%) | 21 (7.5%) |
Occupancy by Educational Attainment in Middle Point
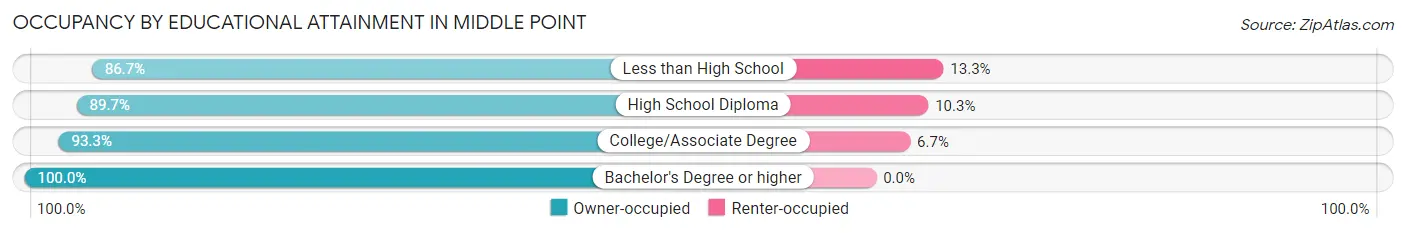
| Household Size | Owner-occupied | Renter-occupied |
| Less than High School | 13 (86.7%) | 2 (13.3%) |
| High School Diploma | 113 (89.7%) | 13 (10.3%) |
| College/Associate Degree | 83 (93.3%) | 6 (6.7%) |
| Bachelor's Degree or higher | 49 (100.0%) | 0 (0.0%) |
Occupancy by Age of Householder in Middle Point
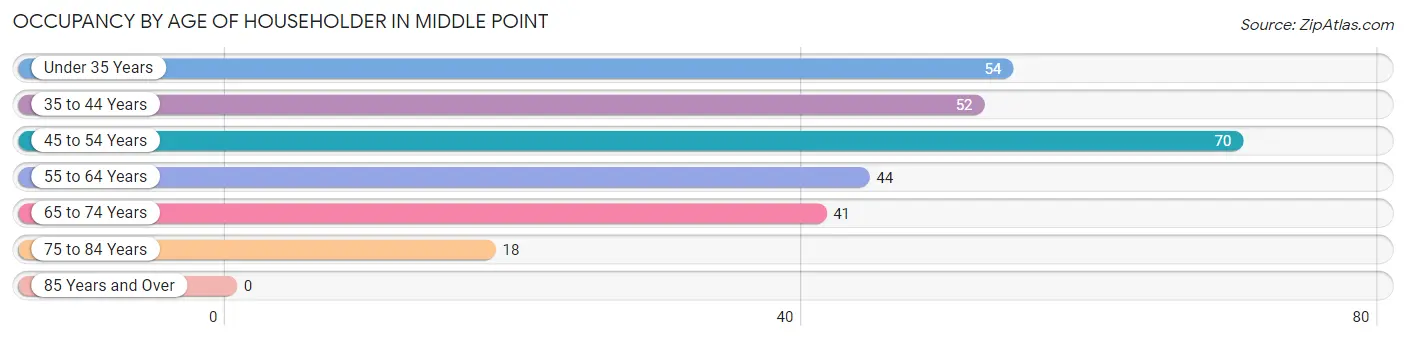
| Age Bracket | # Households | % Households |
| Under 35 Years | 54 | 19.4% |
| 35 to 44 Years | 52 | 18.6% |
| 45 to 54 Years | 70 | 25.1% |
| 55 to 64 Years | 44 | 15.8% |
| 65 to 74 Years | 41 | 14.7% |
| 75 to 84 Years | 18 | 6.5% |
| 85 Years and Over | 0 | 0.0% |
| Total | 279 | 100.0% |
Housing Finances in Middle Point
Median Income by Occupancy in Middle Point
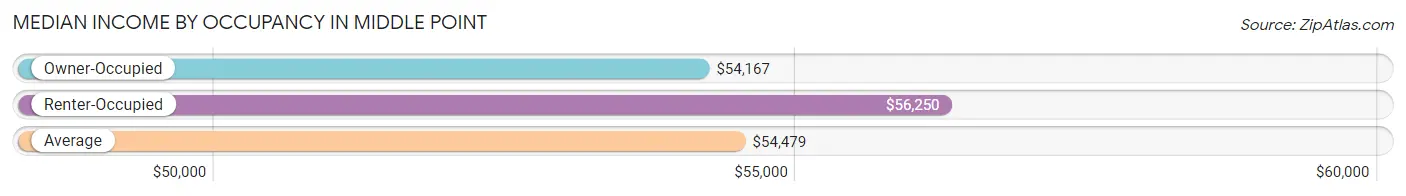
| Occupancy Type | # Households | Median Income |
| Owner-Occupied | 258 (92.5%) | $54,167 |
| Renter-Occupied | 21 (7.5%) | $56,250 |
| Average | 279 (100.0%) | $54,479 |
Occupancy by Householder Income Bracket in Middle Point
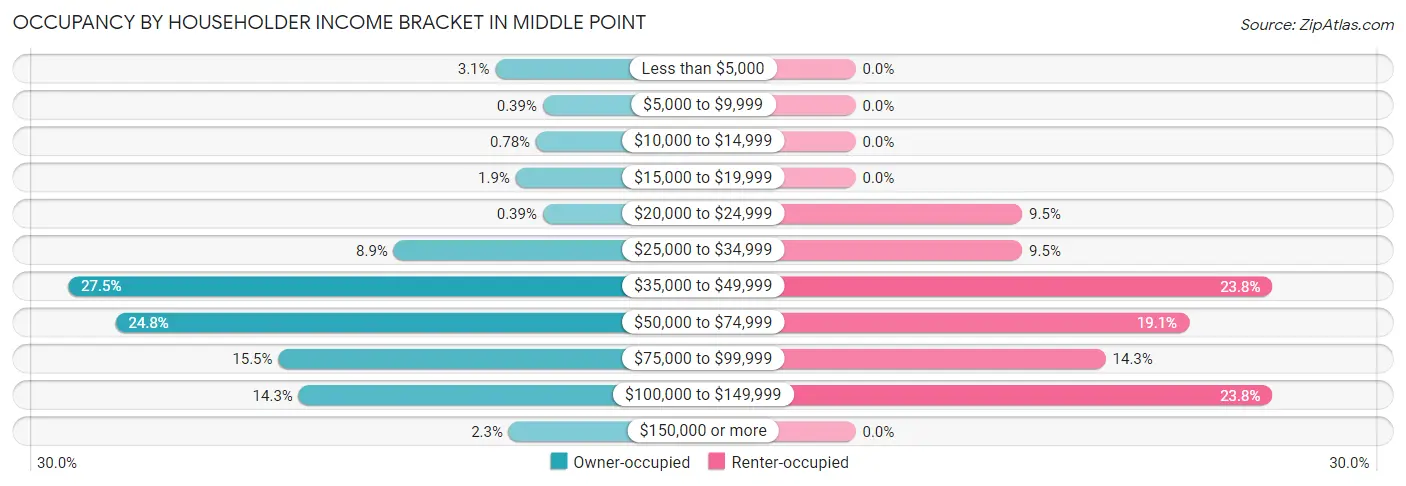
| Income Bracket | Owner-occupied | Renter-occupied |
| Less than $5,000 | 8 (3.1%) | 0 (0.0%) |
| $5,000 to $9,999 | 1 (0.4%) | 0 (0.0%) |
| $10,000 to $14,999 | 2 (0.8%) | 0 (0.0%) |
| $15,000 to $19,999 | 5 (1.9%) | 0 (0.0%) |
| $20,000 to $24,999 | 1 (0.4%) | 2 (9.5%) |
| $25,000 to $34,999 | 23 (8.9%) | 2 (9.5%) |
| $35,000 to $49,999 | 71 (27.5%) | 5 (23.8%) |
| $50,000 to $74,999 | 64 (24.8%) | 4 (19.1%) |
| $75,000 to $99,999 | 40 (15.5%) | 3 (14.3%) |
| $100,000 to $149,999 | 37 (14.3%) | 5 (23.8%) |
| $150,000 or more | 6 (2.3%) | 0 (0.0%) |
| Total | 258 (100.0%) | 21 (100.0%) |
Monthly Housing Cost Tiers in Middle Point

| Monthly Cost | Owner-occupied | Renter-occupied |
| Less than $300 | 27 (10.5%) | 0 (0.0%) |
| $300 to $499 | 34 (13.2%) | 0 (0.0%) |
| $500 to $799 | 94 (36.4%) | 14 (66.7%) |
| $800 to $999 | 68 (26.4%) | 2 (9.5%) |
| $1,000 to $1,499 | 26 (10.1%) | 0 (0.0%) |
| $1,500 to $1,999 | 4 (1.5%) | 0 (0.0%) |
| $2,000 to $2,499 | 5 (1.9%) | 0 (0.0%) |
| $2,500 to $2,999 | 0 (0.0%) | 0 (0.0%) |
| $3,000 or more | 0 (0.0%) | 0 (0.0%) |
| Total | 258 (100.0%) | 21 (100.0%) |
Physical Housing Characteristics in Middle Point
Housing Structures in Middle Point
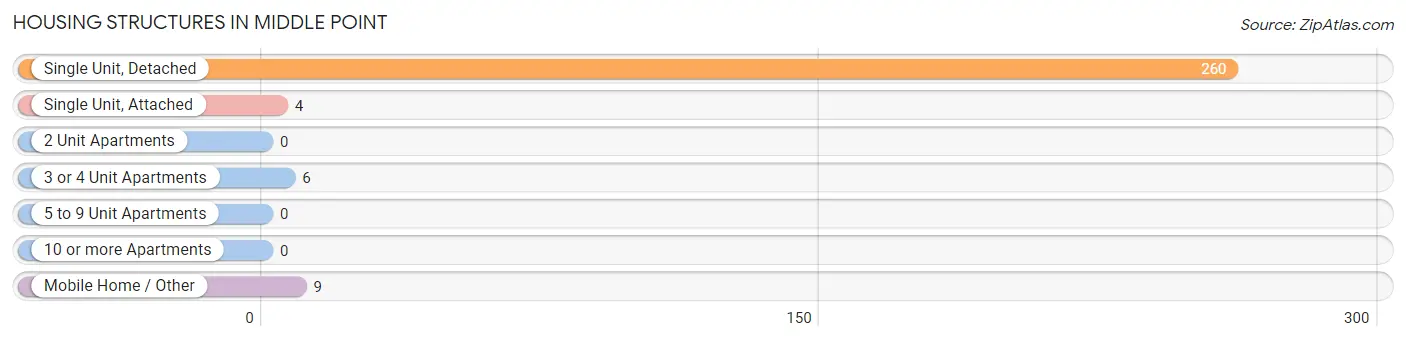
| Structure Type | # Housing Units | % Housing Units |
| Single Unit, Detached | 260 | 93.2% |
| Single Unit, Attached | 4 | 1.4% |
| 2 Unit Apartments | 0 | 0.0% |
| 3 or 4 Unit Apartments | 6 | 2.1% |
| 5 to 9 Unit Apartments | 0 | 0.0% |
| 10 or more Apartments | 0 | 0.0% |
| Mobile Home / Other | 9 | 3.2% |
| Total | 279 | 100.0% |
Housing Structures by Occupancy in Middle Point
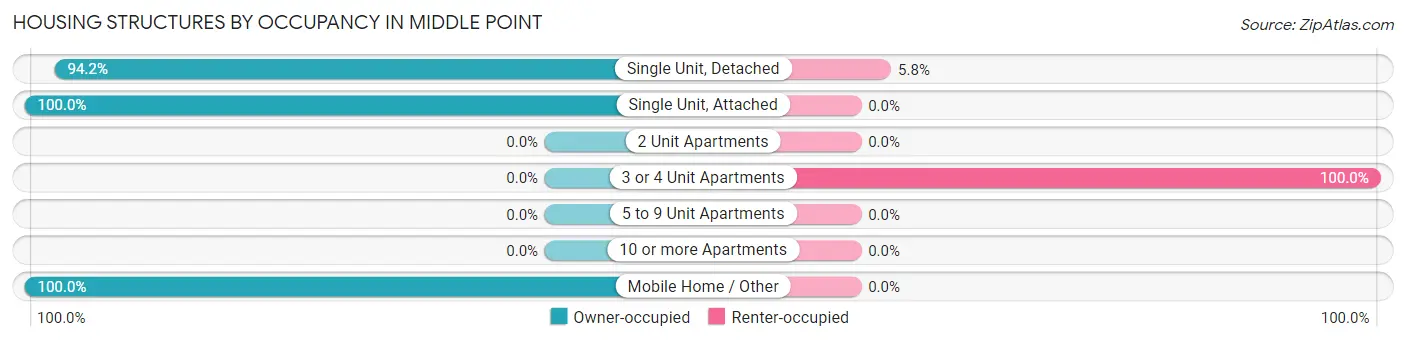
| Structure Type | Owner-occupied | Renter-occupied |
| Single Unit, Detached | 245 (94.2%) | 15 (5.8%) |
| Single Unit, Attached | 4 (100.0%) | 0 (0.0%) |
| 2 Unit Apartments | 0 (0.0%) | 0 (0.0%) |
| 3 or 4 Unit Apartments | 0 (0.0%) | 6 (100.0%) |
| 5 to 9 Unit Apartments | 0 (0.0%) | 0 (0.0%) |
| 10 or more Apartments | 0 (0.0%) | 0 (0.0%) |
| Mobile Home / Other | 9 (100.0%) | 0 (0.0%) |
| Total | 258 (92.5%) | 21 (7.5%) |
Housing Structures by Number of Rooms in Middle Point
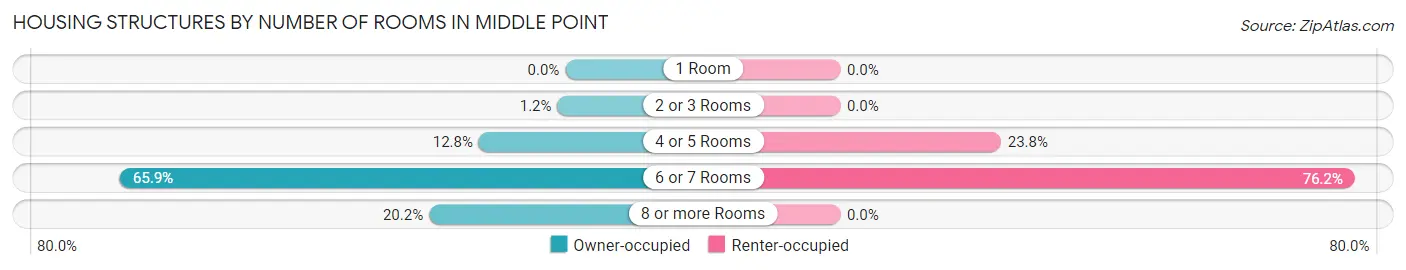
| Number of Rooms | Owner-occupied | Renter-occupied |
| 1 Room | 0 (0.0%) | 0 (0.0%) |
| 2 or 3 Rooms | 3 (1.2%) | 0 (0.0%) |
| 4 or 5 Rooms | 33 (12.8%) | 5 (23.8%) |
| 6 or 7 Rooms | 170 (65.9%) | 16 (76.2%) |
| 8 or more Rooms | 52 (20.2%) | 0 (0.0%) |
| Total | 258 (100.0%) | 21 (100.0%) |
Housing Structure by Heating Type in Middle Point
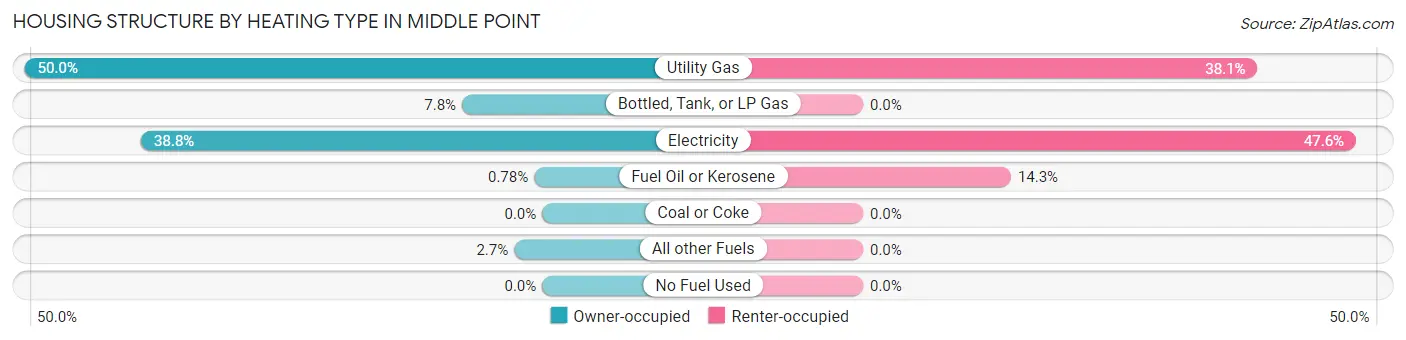
| Heating Type | Owner-occupied | Renter-occupied |
| Utility Gas | 129 (50.0%) | 8 (38.1%) |
| Bottled, Tank, or LP Gas | 20 (7.7%) | 0 (0.0%) |
| Electricity | 100 (38.8%) | 10 (47.6%) |
| Fuel Oil or Kerosene | 2 (0.8%) | 3 (14.3%) |
| Coal or Coke | 0 (0.0%) | 0 (0.0%) |
| All other Fuels | 7 (2.7%) | 0 (0.0%) |
| No Fuel Used | 0 (0.0%) | 0 (0.0%) |
| Total | 258 (100.0%) | 21 (100.0%) |
Household Vehicle Usage in Middle Point
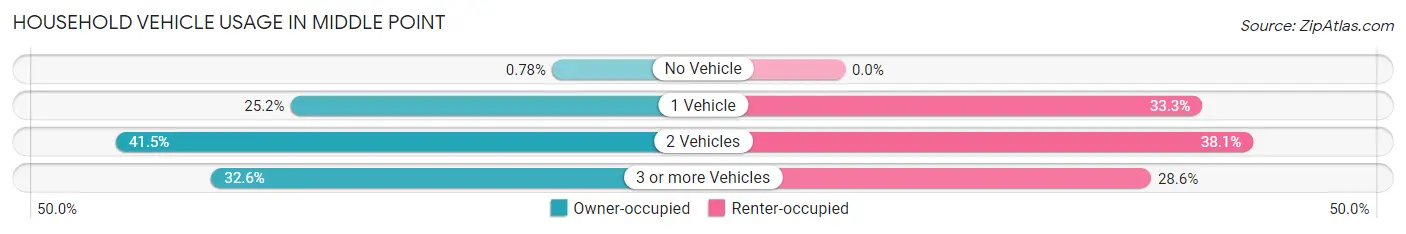
| Vehicles per Household | Owner-occupied | Renter-occupied |
| No Vehicle | 2 (0.8%) | 0 (0.0%) |
| 1 Vehicle | 65 (25.2%) | 7 (33.3%) |
| 2 Vehicles | 107 (41.5%) | 8 (38.1%) |
| 3 or more Vehicles | 84 (32.6%) | 6 (28.6%) |
| Total | 258 (100.0%) | 21 (100.0%) |
Real Estate & Mortgages in Middle Point
Real Estate and Mortgage Overview in Middle Point
| Characteristic | Without Mortgage | With Mortgage |
| Housing Units | 113 | 145 |
| Median Property Value | $75,900 | $84,100 |
| Median Household Income | $59,688 | $6 |
| Monthly Housing Costs | $495 | $0 |
| Real Estate Taxes | $856 | $1 |
Property Value by Mortgage Status in Middle Point
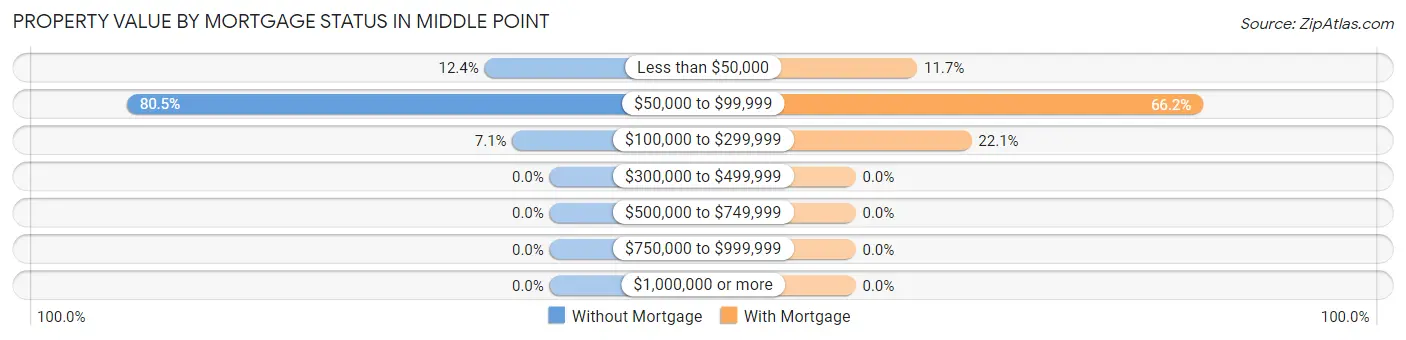
| Property Value | Without Mortgage | With Mortgage |
| Less than $50,000 | 14 (12.4%) | 17 (11.7%) |
| $50,000 to $99,999 | 91 (80.5%) | 96 (66.2%) |
| $100,000 to $299,999 | 8 (7.1%) | 32 (22.1%) |
| $300,000 to $499,999 | 0 (0.0%) | 0 (0.0%) |
| $500,000 to $749,999 | 0 (0.0%) | 0 (0.0%) |
| $750,000 to $999,999 | 0 (0.0%) | 0 (0.0%) |
| $1,000,000 or more | 0 (0.0%) | 0 (0.0%) |
| Total | 113 (100.0%) | 145 (100.0%) |
Household Income by Mortgage Status in Middle Point
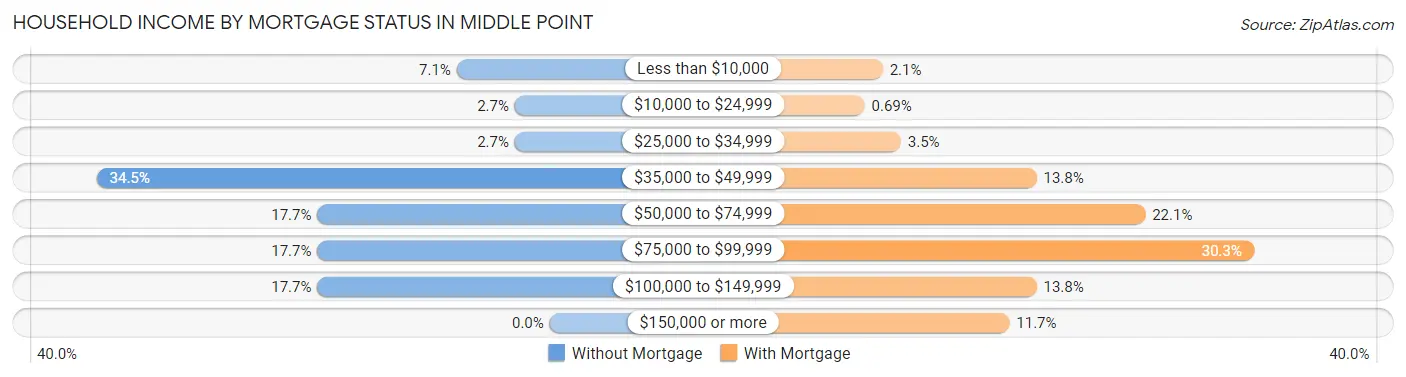
| Household Income | Without Mortgage | With Mortgage |
| Less than $10,000 | 8 (7.1%) | 3 (2.1%) |
| $10,000 to $24,999 | 3 (2.6%) | 1 (0.7%) |
| $25,000 to $34,999 | 3 (2.6%) | 5 (3.5%) |
| $35,000 to $49,999 | 39 (34.5%) | 20 (13.8%) |
| $50,000 to $74,999 | 20 (17.7%) | 32 (22.1%) |
| $75,000 to $99,999 | 20 (17.7%) | 44 (30.3%) |
| $100,000 to $149,999 | 20 (17.7%) | 20 (13.8%) |
| $150,000 or more | 0 (0.0%) | 17 (11.7%) |
| Total | 113 (100.0%) | 145 (100.0%) |
Property Value to Household Income Ratio in Middle Point
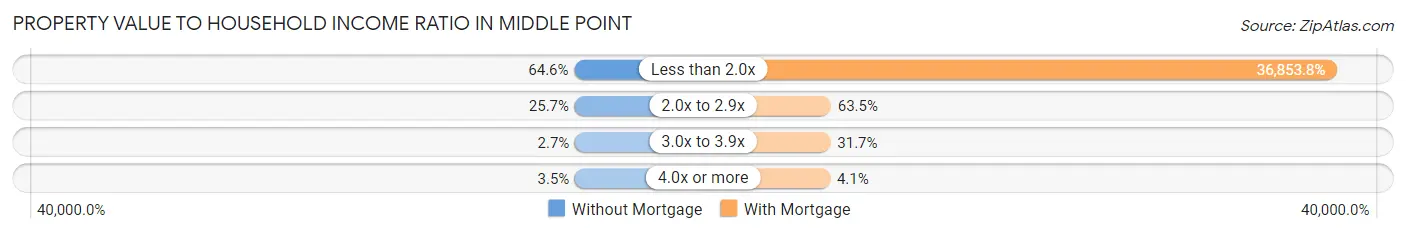
| Value-to-Income Ratio | Without Mortgage | With Mortgage |
| Less than 2.0x | 73 (64.6%) | 53,438 (36,853.8%) |
| 2.0x to 2.9x | 29 (25.7%) | 92 (63.4%) |
| 3.0x to 3.9x | 3 (2.6%) | 46 (31.7%) |
| 4.0x or more | 4 (3.5%) | 6 (4.1%) |
| Total | 113 (100.0%) | 145 (100.0%) |
Real Estate Taxes by Mortgage Status in Middle Point
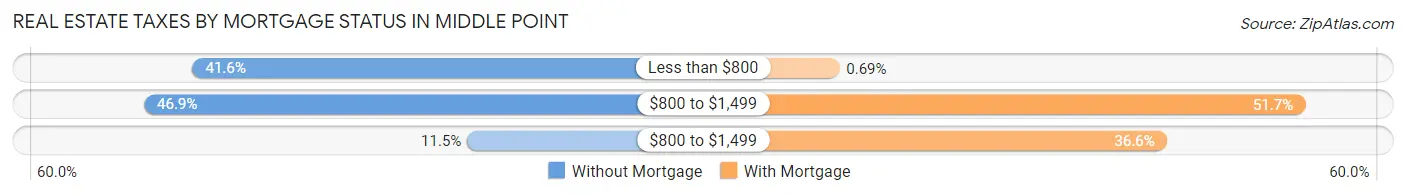
| Property Taxes | Without Mortgage | With Mortgage |
| Less than $800 | 47 (41.6%) | 1 (0.7%) |
| $800 to $1,499 | 53 (46.9%) | 75 (51.7%) |
| $800 to $1,499 | 13 (11.5%) | 53 (36.5%) |
| Total | 113 (100.0%) | 145 (100.0%) |
Health & Disability in Middle Point
Health Insurance Coverage by Age in Middle Point
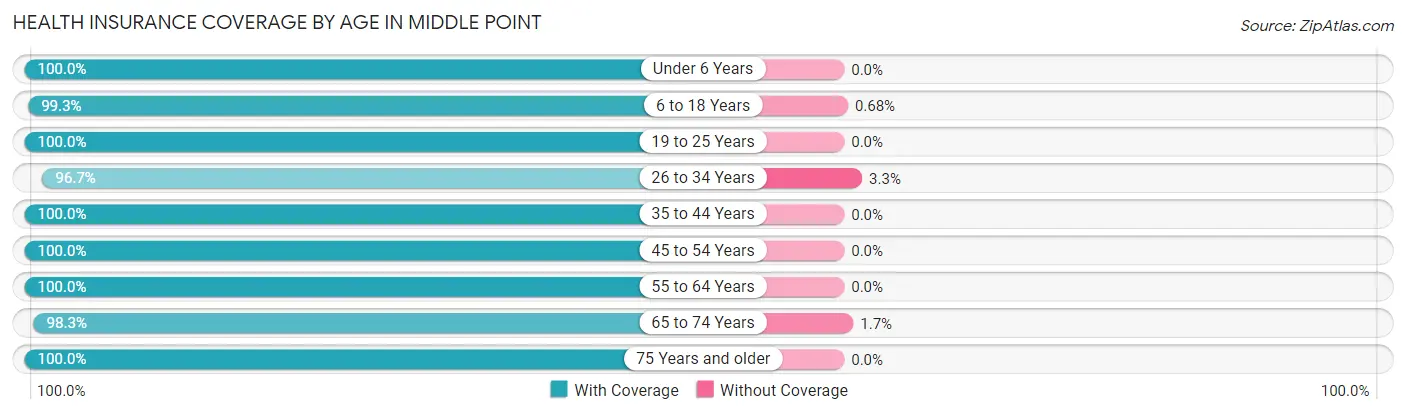
| Age Bracket | With Coverage | Without Coverage |
| Under 6 Years | 41 (100.0%) | 0 (0.0%) |
| 6 to 18 Years | 145 (99.3%) | 1 (0.7%) |
| 19 to 25 Years | 20 (100.0%) | 0 (0.0%) |
| 26 to 34 Years | 87 (96.7%) | 3 (3.3%) |
| 35 to 44 Years | 104 (100.0%) | 0 (0.0%) |
| 45 to 54 Years | 98 (100.0%) | 0 (0.0%) |
| 55 to 64 Years | 65 (100.0%) | 0 (0.0%) |
| 65 to 74 Years | 58 (98.3%) | 1 (1.7%) |
| 75 Years and older | 23 (100.0%) | 0 (0.0%) |
| Total | 641 (99.2%) | 5 (0.8%) |
Health Insurance Coverage by Citizenship Status in Middle Point
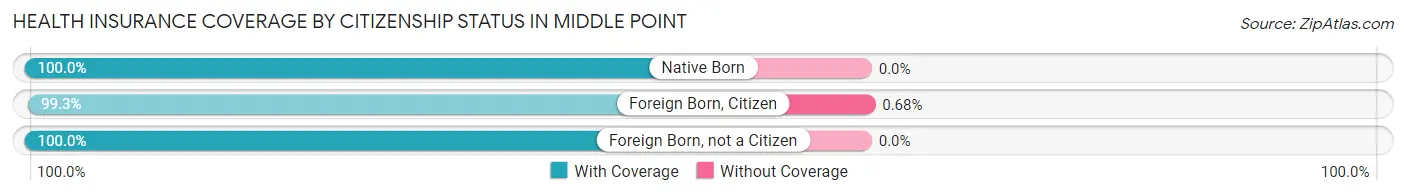
| Citizenship Status | With Coverage | Without Coverage |
| Native Born | 41 (100.0%) | 0 (0.0%) |
| Foreign Born, Citizen | 145 (99.3%) | 1 (0.7%) |
| Foreign Born, not a Citizen | 20 (100.0%) | 0 (0.0%) |
Health Insurance Coverage by Household Income in Middle Point
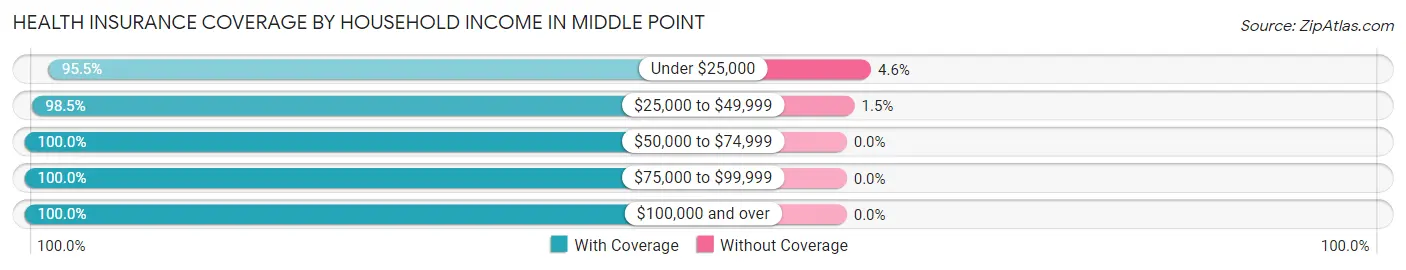
| Household Income | With Coverage | Without Coverage |
| Under $25,000 | 42 (95.5%) | 2 (4.5%) |
| $25,000 to $49,999 | 203 (98.5%) | 3 (1.5%) |
| $50,000 to $74,999 | 152 (100.0%) | 0 (0.0%) |
| $75,000 to $99,999 | 131 (100.0%) | 0 (0.0%) |
| $100,000 and over | 113 (100.0%) | 0 (0.0%) |
Public vs Private Health Insurance Coverage by Age in Middle Point
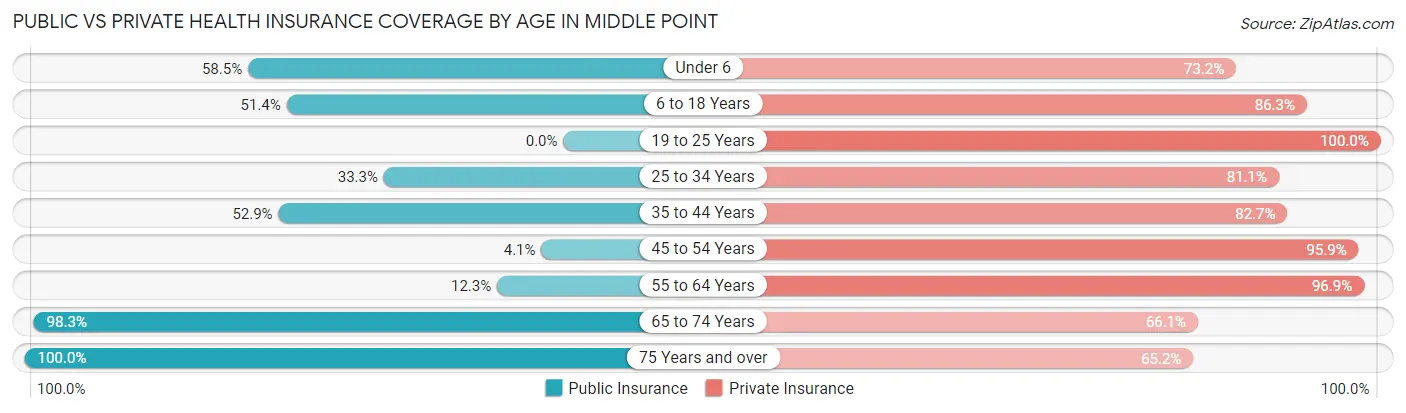
| Age Bracket | Public Insurance | Private Insurance |
| Under 6 | 24 (58.5%) | 30 (73.2%) |
| 6 to 18 Years | 75 (51.4%) | 126 (86.3%) |
| 19 to 25 Years | 0 (0.0%) | 20 (100.0%) |
| 25 to 34 Years | 30 (33.3%) | 73 (81.1%) |
| 35 to 44 Years | 55 (52.9%) | 86 (82.7%) |
| 45 to 54 Years | 4 (4.1%) | 94 (95.9%) |
| 55 to 64 Years | 8 (12.3%) | 63 (96.9%) |
| 65 to 74 Years | 58 (98.3%) | 39 (66.1%) |
| 75 Years and over | 23 (100.0%) | 15 (65.2%) |
| Total | 277 (42.9%) | 546 (84.5%) |
Disability Status by Sex by Age in Middle Point
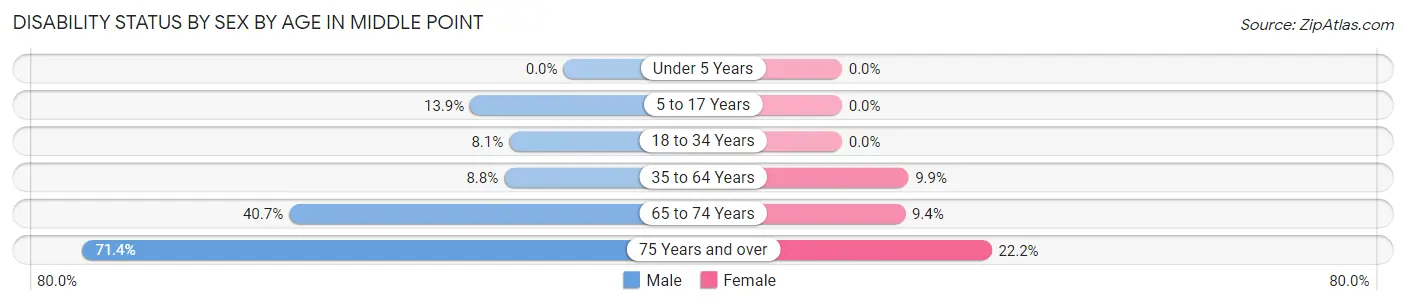
| Age Bracket | Male | Female |
| Under 5 Years | 0 (0.0%) | 0 (0.0%) |
| 5 to 17 Years | 14 (13.9%) | 0 (0.0%) |
| 18 to 34 Years | 5 (8.1%) | 0 (0.0%) |
| 35 to 64 Years | 11 (8.8%) | 14 (9.9%) |
| 65 to 74 Years | 11 (40.7%) | 3 (9.4%) |
| 75 Years and over | 10 (71.4%) | 2 (22.2%) |
Disability Class by Sex by Age in Middle Point
Disability Class: Hearing Difficulty
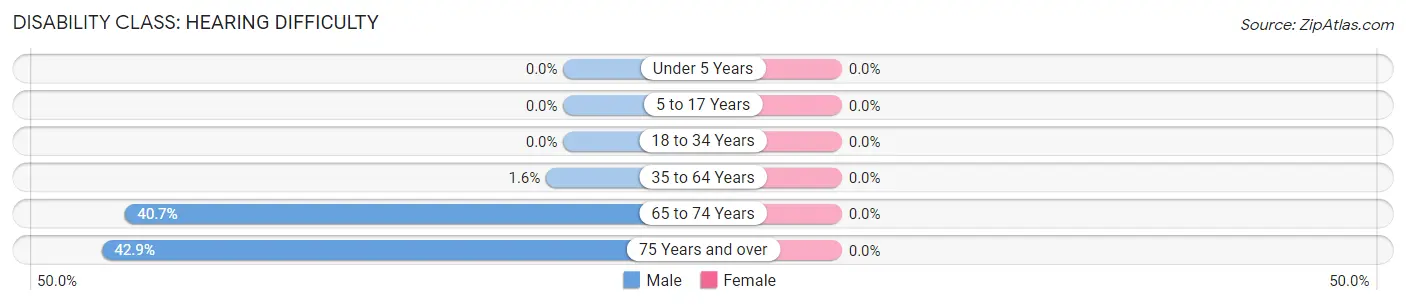
| Age Bracket | Male | Female |
| Under 5 Years | 0 (0.0%) | 0 (0.0%) |
| 5 to 17 Years | 0 (0.0%) | 0 (0.0%) |
| 18 to 34 Years | 0 (0.0%) | 0 (0.0%) |
| 35 to 64 Years | 2 (1.6%) | 0 (0.0%) |
| 65 to 74 Years | 11 (40.7%) | 0 (0.0%) |
| 75 Years and over | 6 (42.9%) | 0 (0.0%) |
Disability Class: Vision Difficulty
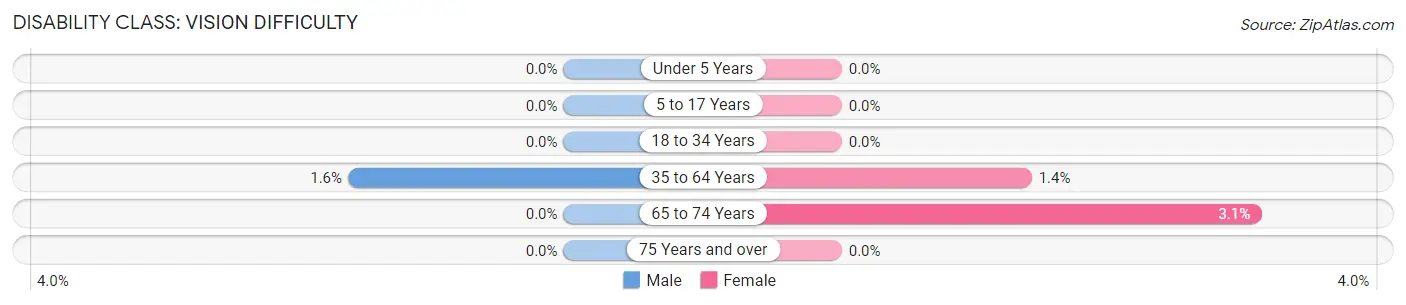
| Age Bracket | Male | Female |
| Under 5 Years | 0 (0.0%) | 0 (0.0%) |
| 5 to 17 Years | 0 (0.0%) | 0 (0.0%) |
| 18 to 34 Years | 0 (0.0%) | 0 (0.0%) |
| 35 to 64 Years | 2 (1.6%) | 2 (1.4%) |
| 65 to 74 Years | 0 (0.0%) | 1 (3.1%) |
| 75 Years and over | 0 (0.0%) | 0 (0.0%) |
Disability Class: Cognitive Difficulty
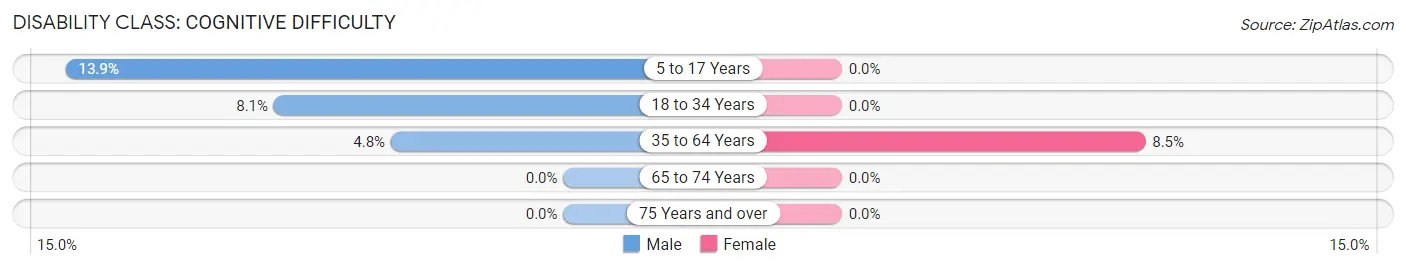
| Age Bracket | Male | Female |
| 5 to 17 Years | 14 (13.9%) | 0 (0.0%) |
| 18 to 34 Years | 5 (8.1%) | 0 (0.0%) |
| 35 to 64 Years | 6 (4.8%) | 12 (8.5%) |
| 65 to 74 Years | 0 (0.0%) | 0 (0.0%) |
| 75 Years and over | 0 (0.0%) | 0 (0.0%) |
Disability Class: Ambulatory Difficulty
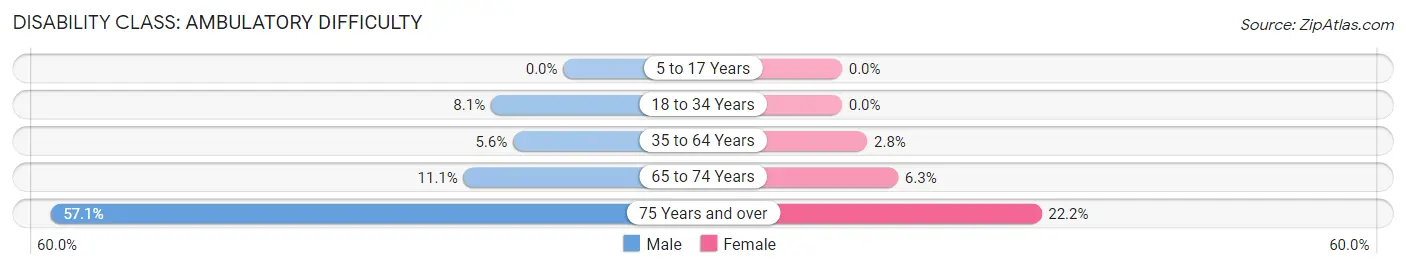
| Age Bracket | Male | Female |
| 5 to 17 Years | 0 (0.0%) | 0 (0.0%) |
| 18 to 34 Years | 5 (8.1%) | 0 (0.0%) |
| 35 to 64 Years | 7 (5.6%) | 4 (2.8%) |
| 65 to 74 Years | 3 (11.1%) | 2 (6.2%) |
| 75 Years and over | 8 (57.1%) | 2 (22.2%) |
Disability Class: Self-Care Difficulty
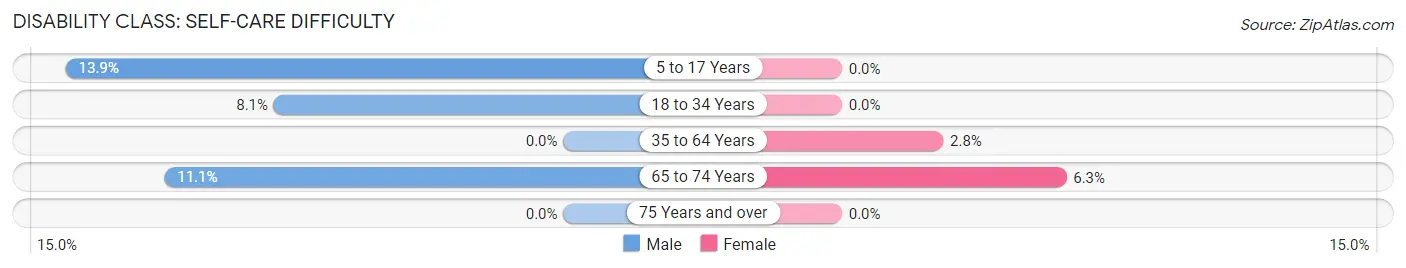
| Age Bracket | Male | Female |
| 5 to 17 Years | 14 (13.9%) | 0 (0.0%) |
| 18 to 34 Years | 5 (8.1%) | 0 (0.0%) |
| 35 to 64 Years | 0 (0.0%) | 4 (2.8%) |
| 65 to 74 Years | 3 (11.1%) | 2 (6.2%) |
| 75 Years and over | 0 (0.0%) | 0 (0.0%) |
Technology Access in Middle Point
Computing Device Access in Middle Point
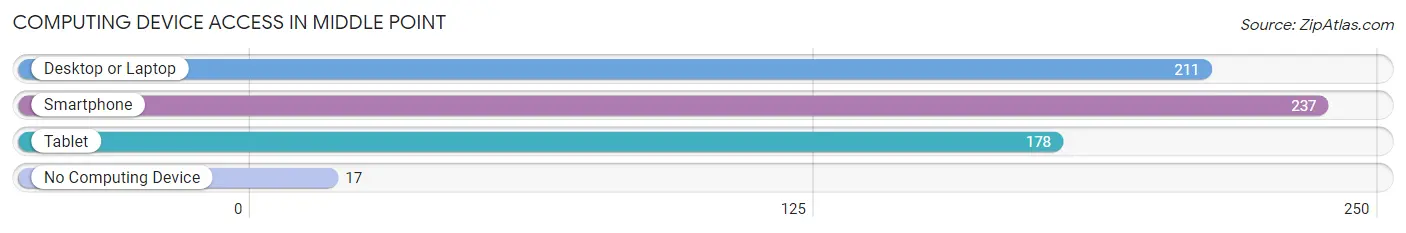
| Device Type | # Households | % Households |
| Desktop or Laptop | 211 | 75.6% |
| Smartphone | 237 | 85.0% |
| Tablet | 178 | 63.8% |
| No Computing Device | 17 | 6.1% |
| Total | 279 | 100.0% |
Internet Access in Middle Point
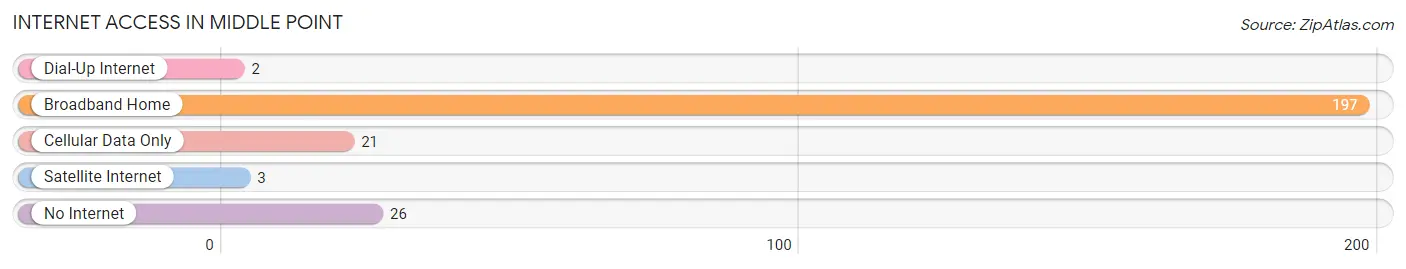
| Internet Type | # Households | % Households |
| Dial-Up Internet | 2 | 0.7% |
| Broadband Home | 197 | 70.6% |
| Cellular Data Only | 21 | 7.5% |
| Satellite Internet | 3 | 1.1% |
| No Internet | 26 | 9.3% |
| Total | 279 | 100.0% |
Middle Point Summary
Introduction
Middle Point is a village located in Van Wert County, Ohio. It is situated in the northwest corner of the state, approximately 50 miles south of Toledo and 50 miles north of Dayton. The village has a population of approximately 1,000 people and is part of the Van Wert Micropolitan Statistical Area. The village is known for its small-town charm and is home to a variety of businesses, including a grocery store, a hardware store, a bank, and a post office.
History
Middle Point was founded in 1837 by a group of settlers from Pennsylvania. The village was originally known as “Middle Point” because it was located between two other settlements, Van Wert and Paulding. The village was incorporated in 1867 and has remained a small, rural community ever since.
The village was home to a variety of businesses throughout its history, including a sawmill, a grist mill, a blacksmith shop, and a general store. The village also had a post office, which opened in 1867 and is still in operation today.
Geography
Middle Point is located in the northwest corner of Ohio, approximately 50 miles south of Toledo and 50 miles north of Dayton. The village is situated in the flat, fertile farmland of Van Wert County. The village is surrounded by small towns and villages, including Convoy, Ohio, and Delphos, Ohio.
The village is located on the banks of the Auglaize River, which flows through the village and provides a source of recreation for the residents. The village is also located near several state parks, including Grand Lake St. Marys State Park and Van Wert County Park.
Economy
The economy of Middle Point is largely based on agriculture. The village is home to several farms, which produce a variety of crops, including corn, soybeans, and wheat. The village is also home to a variety of small businesses, including a grocery store, a hardware store, a bank, and a post office.
The village is also home to several manufacturing companies, including a plastics manufacturer and a metal fabrication company. The village is also home to a variety of service-based businesses, including a restaurant, a barber shop, and a beauty salon.
Demographics
As of the 2010 census, the population of Middle Point was 1,000 people. The village is predominantly white, with 95.2% of the population identifying as white. The village is also home to a small Hispanic population, with 4.8% of the population identifying as Hispanic or Latino.
The median household income in Middle Point is $41,250, and the median home value is $90,000. The village has a poverty rate of 11.2%, which is slightly higher than the national average.
Conclusion
Middle Point is a small village located in Van Wert County, Ohio. The village has a population of approximately 1,000 people and is known for its small-town charm. The village is home to a variety of businesses, including a grocery store, a hardware store, a bank, and a post office. The village is also home to several farms and manufacturing companies. The village is predominantly white, with 95.2% of the population identifying as white. The median household income in Middle Point is $41,250, and the median home value is $90,000.
Common Questions
What is Per Capita Income in Middle Point?
Per Capita income in Middle Point is $27,572.
What is the Median Family Income in Middle Point?
Median Family Income in Middle Point is $61,591.
What is the Median Household income in Middle Point?
Median Household Income in Middle Point is $54,479.
What is Income or Wage Gap in Middle Point?
Income or Wage Gap in Middle Point is 31.7%.
Women in Middle Point earn 68.3 cents for every dollar earned by a man.
What is Inequality or Gini Index in Middle Point?
Inequality or Gini Index in Middle Point is 0.31.
What is the Total Population of Middle Point?
Total Population of Middle Point is 646.
What is the Total Male Population of Middle Point?
Total Male Population of Middle Point is 348.
What is the Total Female Population of Middle Point?
Total Female Population of Middle Point is 298.
What is the Ratio of Males per 100 Females in Middle Point?
There are 116.78 Males per 100 Females in Middle Point.
What is the Ratio of Females per 100 Males in Middle Point?
There are 85.63 Females per 100 Males in Middle Point.
What is the Median Population Age in Middle Point?
Median Population Age in Middle Point is 37.0 Years.
What is the Average Family Size in Middle Point
Average Family Size in Middle Point is 2.8 People.
What is the Average Household Size in Middle Point
Average Household Size in Middle Point is 2.3 People.
How Large is the Labor Force in Middle Point?
There are 380 People in the Labor Forcein in Middle Point.
What is the Percentage of People in the Labor Force in Middle Point?
72.2% of People are in the Labor Force in Middle Point.
What is the Unemployment Rate in Middle Point?
Unemployment Rate in Middle Point is 1.3%.