Neffs, OH Map & Demographics
Neffs Map
Neffs Overview
$25,031
PER CAPITA INCOME
$39,464
AVG FAMILY INCOME
$35,000
AVG HOUSEHOLD INCOME
21.4%
WAGE / INCOME GAP [ % ]
78.6¢/ $1
WAGE / INCOME GAP [ $ ]
0.40
INEQUALITY / GINI INDEX
1,093
TOTAL POPULATION
551
MALE POPULATION
542
FEMALE POPULATION
101.66
MALES / 100 FEMALES
98.37
FEMALES / 100 MALES
55.8
MEDIAN AGE
2.6
AVG FAMILY SIZE
2.3
AVG HOUSEHOLD SIZE
513
LABOR FORCE [ PEOPLE ]
54.6%
PERCENT IN LABOR FORCE
4.1%
UNEMPLOYMENT RATE
Neffs Zip Codes
Neffs Area Codes
Income in Neffs
Income Overview in Neffs
Per Capita Income in Neffs is $25,031, while median incomes of families and households are $39,464 and $35,000 respectively.
| Characteristic | Number | Measure |
| Per Capita Income | 1,093 | $25,031 |
| Median Family Income | 329 | $39,464 |
| Mean Family Income | 329 | $59,118 |
| Median Household Income | 482 | $35,000 |
| Mean Household Income | 482 | $54,930 |
| Income Deficit | 329 | $0 |
| Wage / Income Gap (%) | 1,093 | 21.36% |
| Wage / Income Gap ($) | 1,093 | 78.64¢ per $1 |
| Gini / Inequality Index | 1,093 | 0.40 |
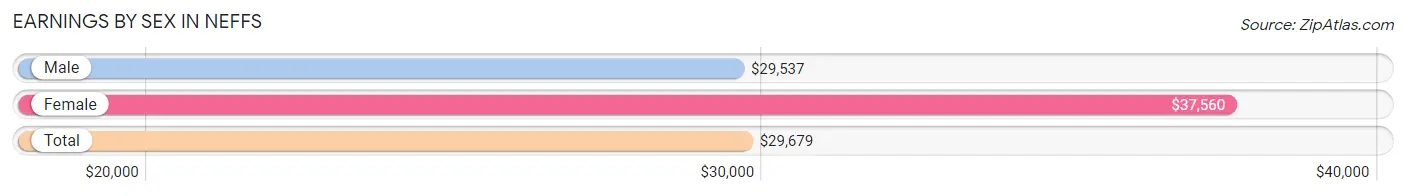
Earnings by Sex in Neffs
Average Earnings in Neffs are $29,679, $29,537 for men and $37,560 for women, a difference of 21.4%.
| Sex | Number | Average Earnings |
| Male | 318 (62.0%) | $29,537 |
| Female | 195 (38.0%) | $37,560 |
| Total | 513 (100.0%) | $29,679 |
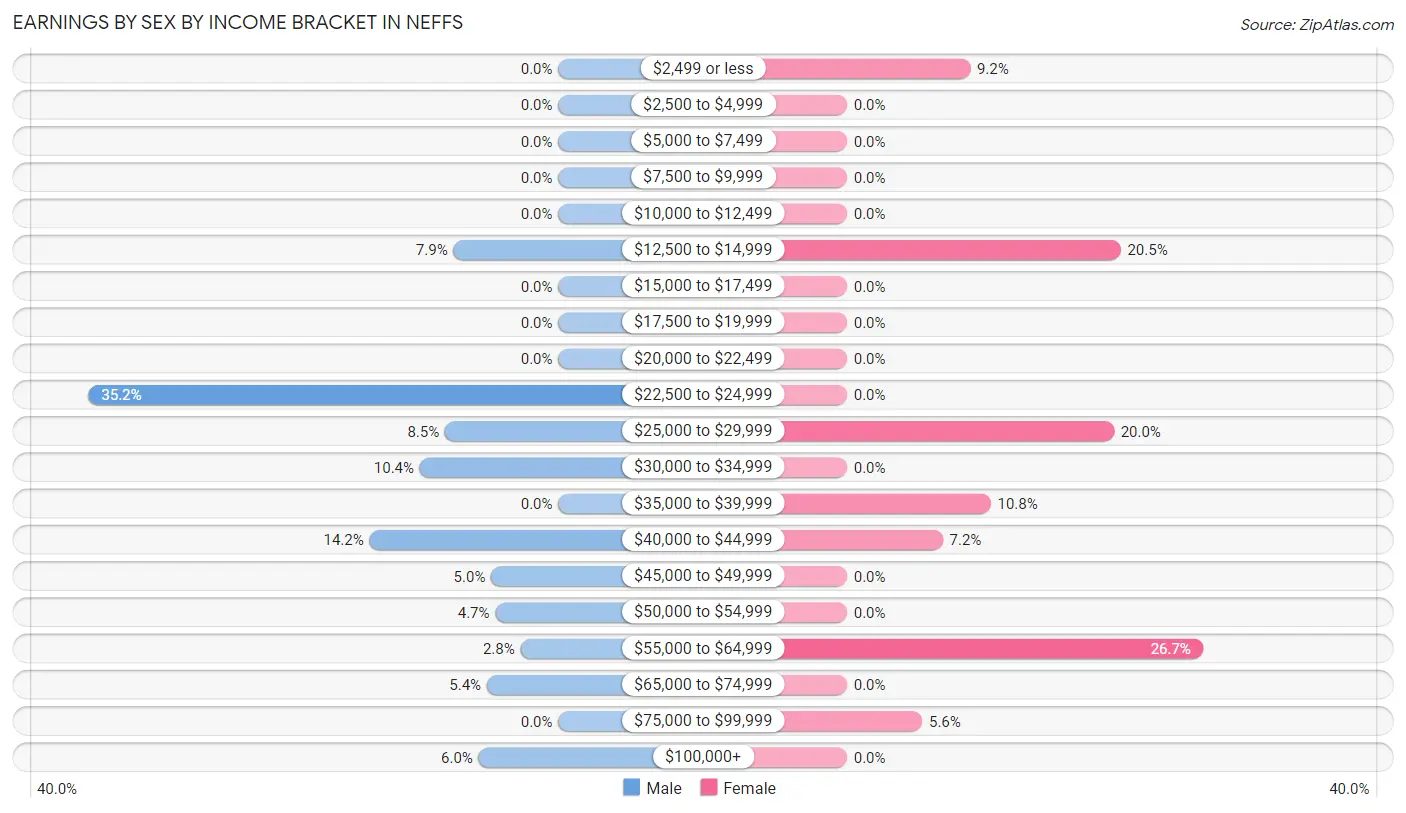
Earnings by Sex by Income Bracket in Neffs
The most common earnings brackets in Neffs are $22,500 to $24,999 for men (112 | 35.2%) and $55,000 to $64,999 for women (52 | 26.7%).
| Income | Male | Female |
| $2,499 or less | 0 (0.0%) | 18 (9.2%) |
| $2,500 to $4,999 | 0 (0.0%) | 0 (0.0%) |
| $5,000 to $7,499 | 0 (0.0%) | 0 (0.0%) |
| $7,500 to $9,999 | 0 (0.0%) | 0 (0.0%) |
| $10,000 to $12,499 | 0 (0.0%) | 0 (0.0%) |
| $12,500 to $14,999 | 25 (7.9%) | 40 (20.5%) |
| $15,000 to $17,499 | 0 (0.0%) | 0 (0.0%) |
| $17,500 to $19,999 | 0 (0.0%) | 0 (0.0%) |
| $20,000 to $22,499 | 0 (0.0%) | 0 (0.0%) |
| $22,500 to $24,999 | 112 (35.2%) | 0 (0.0%) |
| $25,000 to $29,999 | 27 (8.5%) | 39 (20.0%) |
| $30,000 to $34,999 | 33 (10.4%) | 0 (0.0%) |
| $35,000 to $39,999 | 0 (0.0%) | 21 (10.8%) |
| $40,000 to $44,999 | 45 (14.1%) | 14 (7.2%) |
| $45,000 to $49,999 | 16 (5.0%) | 0 (0.0%) |
| $50,000 to $54,999 | 15 (4.7%) | 0 (0.0%) |
| $55,000 to $64,999 | 9 (2.8%) | 52 (26.7%) |
| $65,000 to $74,999 | 17 (5.3%) | 0 (0.0%) |
| $75,000 to $99,999 | 0 (0.0%) | 11 (5.6%) |
| $100,000+ | 19 (6.0%) | 0 (0.0%) |
| Total | 318 (100.0%) | 195 (100.0%) |
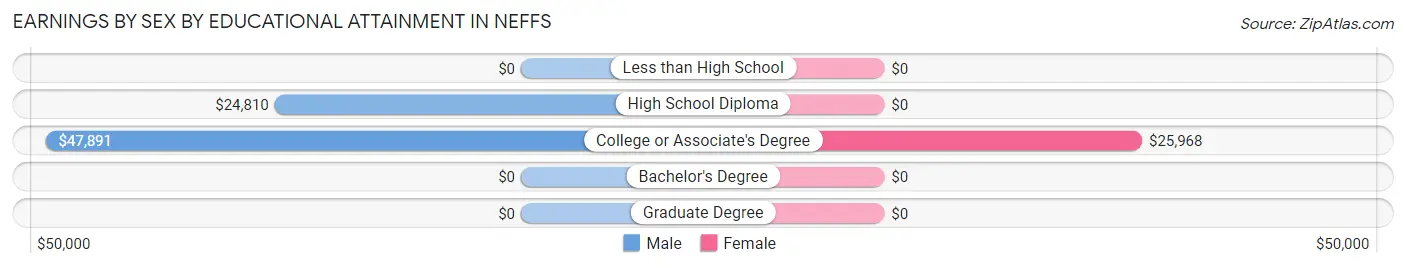
Earnings by Sex by Educational Attainment in Neffs
| Educational Attainment | Male Income | Female Income |
| Less than High School | - | - |
| High School Diploma | $24,810 | $0 |
| College or Associate's Degree | $47,891 | $25,968 |
| Bachelor's Degree | - | - |
| Graduate Degree | - | - |
| Total | $32,727 | $0 |
Family Income in Neffs
Family Income Brackets in Neffs
According to the Neffs family income data, there are 137 families falling into the $25,000 to $34,999 income range, which is the most common income bracket and makes up 41.6% of all families.
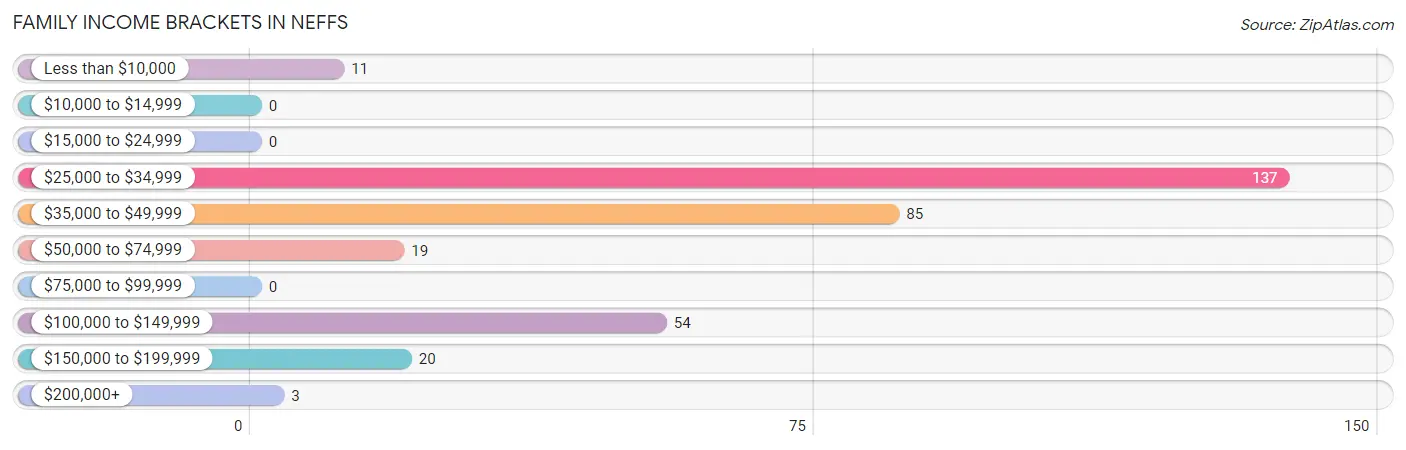
| Income Bracket | # Families | % Families |
| Less than $10,000 | 11 | 3.3% |
| $10,000 to $14,999 | 0 | 0.0% |
| $15,000 to $24,999 | 0 | 0.0% |
| $25,000 to $34,999 | 137 | 41.6% |
| $35,000 to $49,999 | 85 | 25.8% |
| $50,000 to $74,999 | 19 | 5.8% |
| $75,000 to $99,999 | 0 | 0.0% |
| $100,000 to $149,999 | 54 | 16.4% |
| $150,000 to $199,999 | 20 | 6.1% |
| $200,000+ | 3 | 0.9% |
Family Income by Famaliy Size in Neffs
3-person families (67 | 20.4%) account for the highest median family income in Neffs with $43,393 per family, while 3-person families (67 | 20.4%) have the highest median income of $14,464 per family member.
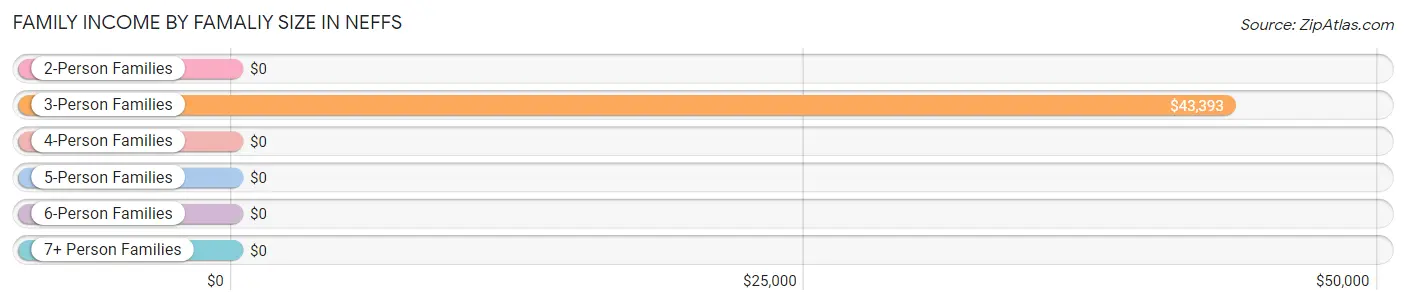
| Income Bracket | # Families | Median Income |
| 2-Person Families | 229 (69.6%) | $0 |
| 3-Person Families | 67 (20.4%) | $43,393 |
| 4-Person Families | 24 (7.3%) | $0 |
| 5-Person Families | 9 (2.7%) | $0 |
| 6-Person Families | 0 (0.0%) | $0 |
| 7+ Person Families | 0 (0.0%) | $0 |
| Total | 329 (100.0%) | $39,464 |
Family Income by Number of Earners in Neffs
The median family income in Neffs is $39,464, with families comprising 3+ earners (31) having the highest median family income of $151,250, while families with 1 earner (198) have the lowest median family income of $26,807, accounting for 9.4% and 60.2% of families, respectively.
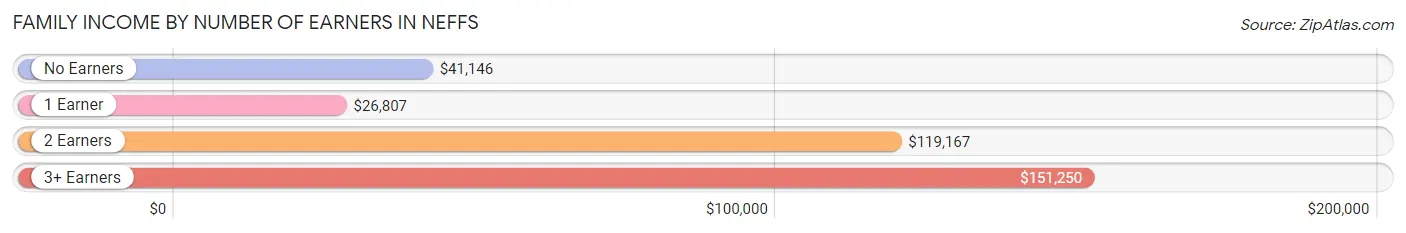
| Number of Earners | # Families | Median Income |
| No Earners | 44 (13.4%) | $41,146 |
| 1 Earner | 198 (60.2%) | $26,807 |
| 2 Earners | 56 (17.0%) | $119,167 |
| 3+ Earners | 31 (9.4%) | $151,250 |
| Total | 329 (100.0%) | $39,464 |
Household Income in Neffs
Household Income Brackets in Neffs
With 171 households falling in the category, the $25,000 to $34,999 income range is the most frequent in Neffs, accounting for 35.5% of all households. In contrast, only 3 households (0.6%) fall into the $200,000+ income bracket, making it the least populous group.
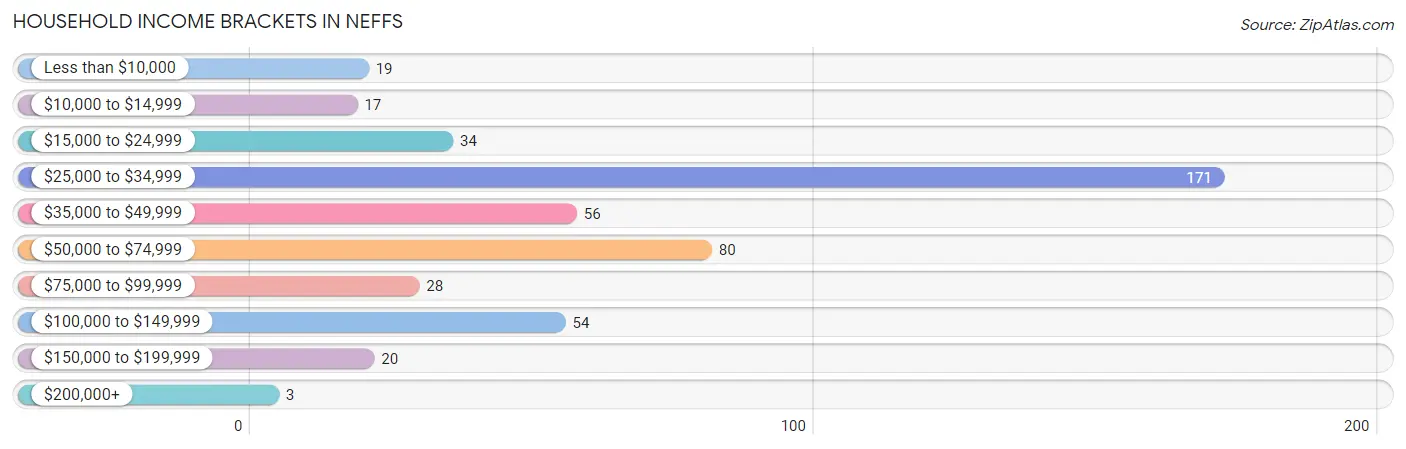
| Income Bracket | # Households | % Households |
| Less than $10,000 | 19 | 3.9% |
| $10,000 to $14,999 | 17 | 3.5% |
| $15,000 to $24,999 | 34 | 7.1% |
| $25,000 to $34,999 | 171 | 35.5% |
| $35,000 to $49,999 | 56 | 11.6% |
| $50,000 to $74,999 | 80 | 16.6% |
| $75,000 to $99,999 | 28 | 5.8% |
| $100,000 to $149,999 | 54 | 11.2% |
| $150,000 to $199,999 | 20 | 4.1% |
| $200,000+ | 3 | 0.6% |
Household Income by Householder Age in Neffs
The median household income in Neffs is $35,000, with the highest median household income of $71,429 found in the 25 to 44 years age bracket for the primary householder. A total of 62 households (12.9%) fall into this category. Meanwhile, the 15 to 24 years age bracket for the primary householder has the lowest median household income of $0, with 21 households (4.4%) in this group.
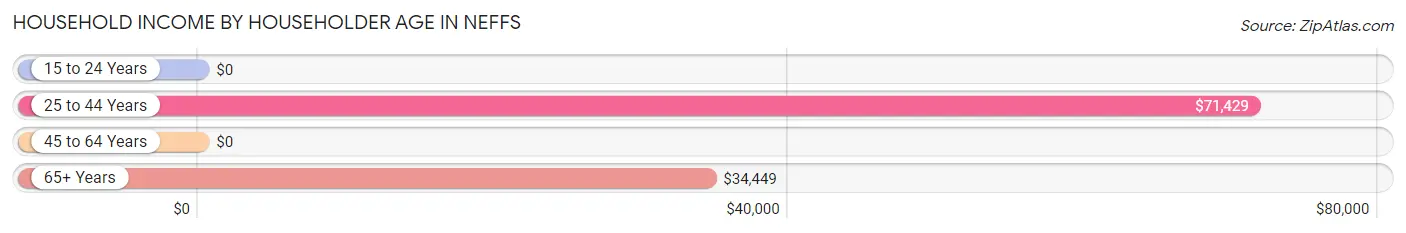
| Income Bracket | # Households | Median Income |
| 15 to 24 Years | 21 (4.4%) | $0 |
| 25 to 44 Years | 62 (12.9%) | $71,429 |
| 45 to 64 Years | 240 (49.8%) | $0 |
| 65+ Years | 159 (33.0%) | $34,449 |
| Total | 482 (100.0%) | $35,000 |
Poverty in Neffs
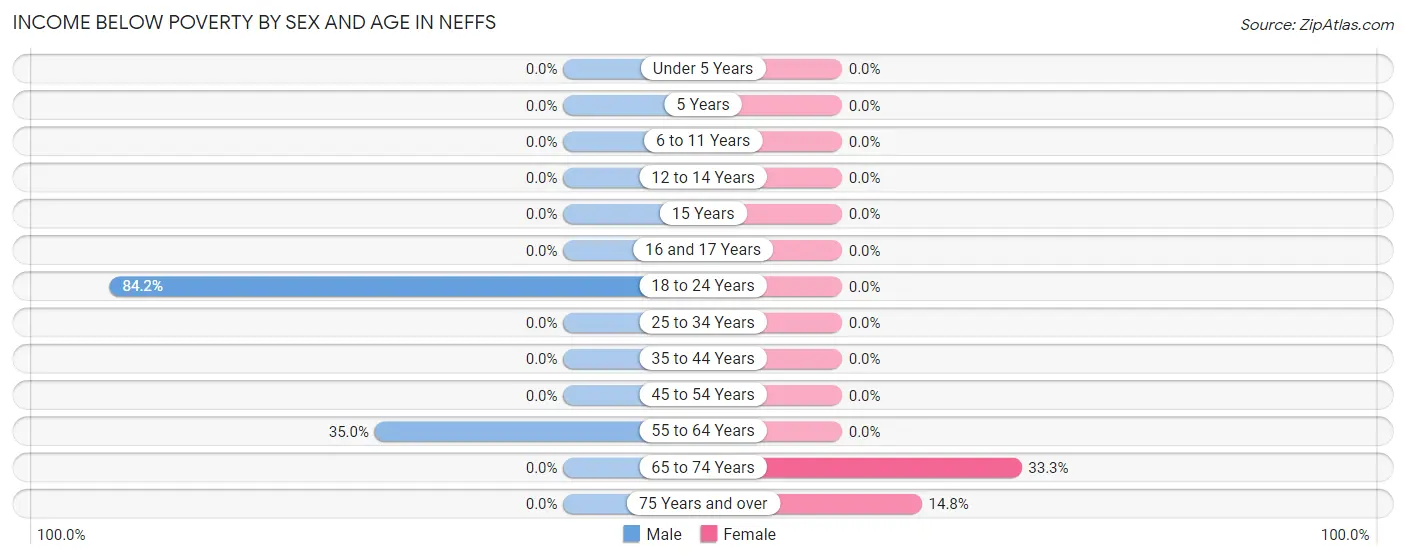
Income Below Poverty by Sex and Age in Neffs
With 13.1% poverty level for males and 5.3% for females among the residents of Neffs, 18 to 24 year old males and 65 to 74 year old females are the most vulnerable to poverty, with 16 males (84.2%) and 21 females (33.3%) in their respective age groups living below the poverty level.
| Age Bracket | Male | Female |
| Under 5 Years | 0 (0.0%) | 0 (0.0%) |
| 5 Years | 0 (0.0%) | 0 (0.0%) |
| 6 to 11 Years | 0 (0.0%) | 0 (0.0%) |
| 12 to 14 Years | 0 (0.0%) | 0 (0.0%) |
| 15 Years | 0 (0.0%) | 0 (0.0%) |
| 16 and 17 Years | 0 (0.0%) | 0 (0.0%) |
| 18 to 24 Years | 16 (84.2%) | 0 (0.0%) |
| 25 to 34 Years | 0 (0.0%) | 0 (0.0%) |
| 35 to 44 Years | 0 (0.0%) | 0 (0.0%) |
| 45 to 54 Years | 0 (0.0%) | 0 (0.0%) |
| 55 to 64 Years | 56 (35.0%) | 0 (0.0%) |
| 65 to 74 Years | 0 (0.0%) | 21 (33.3%) |
| 75 Years and over | 0 (0.0%) | 8 (14.8%) |
| Total | 72 (13.1%) | 29 (5.3%) |
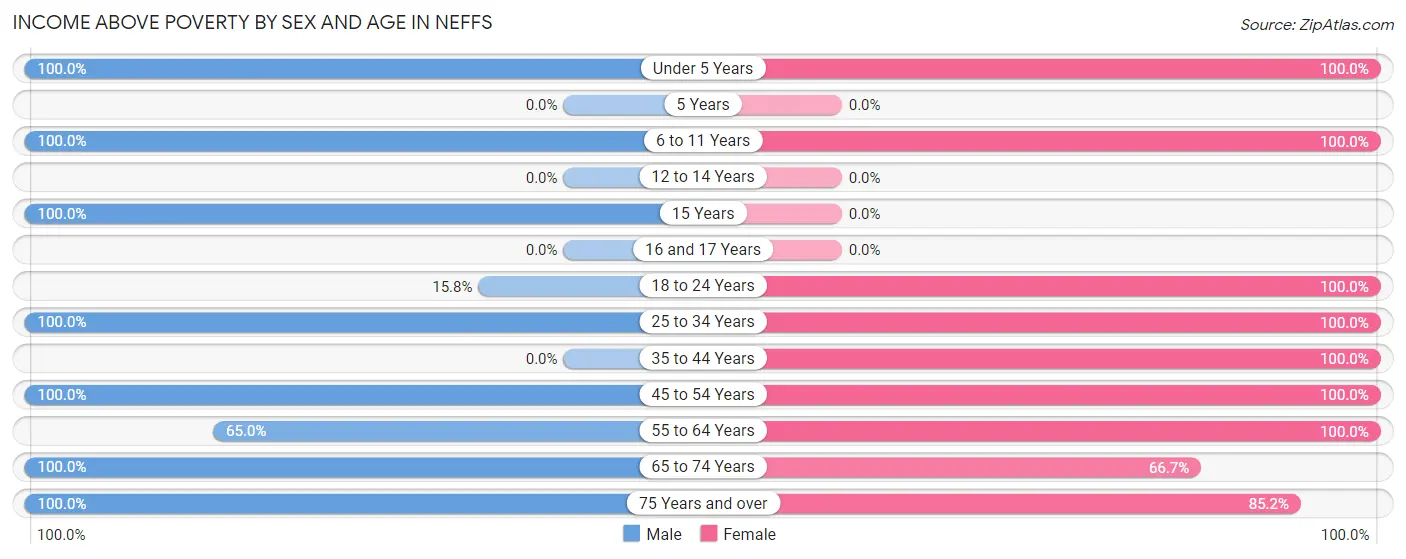
Income Above Poverty by Sex and Age in Neffs
According to the poverty statistics in Neffs, males aged under 5 years and females aged under 5 years are the age groups that are most secure financially, with 100.0% of males and 100.0% of females in these age groups living above the poverty line.
| Age Bracket | Male | Female |
| Under 5 Years | 48 (100.0%) | 33 (100.0%) |
| 5 Years | 0 (0.0%) | 0 (0.0%) |
| 6 to 11 Years | 31 (100.0%) | 32 (100.0%) |
| 12 to 14 Years | 0 (0.0%) | 0 (0.0%) |
| 15 Years | 9 (100.0%) | 0 (0.0%) |
| 16 and 17 Years | 0 (0.0%) | 0 (0.0%) |
| 18 to 24 Years | 3 (15.8%) | 76 (100.0%) |
| 25 to 34 Years | 56 (100.0%) | 40 (100.0%) |
| 35 to 44 Years | 0 (0.0%) | 31 (100.0%) |
| 45 to 54 Years | 140 (100.0%) | 22 (100.0%) |
| 55 to 64 Years | 104 (65.0%) | 191 (100.0%) |
| 65 to 74 Years | 43 (100.0%) | 42 (66.7%) |
| 75 Years and over | 45 (100.0%) | 46 (85.2%) |
| Total | 479 (86.9%) | 513 (94.7%) |
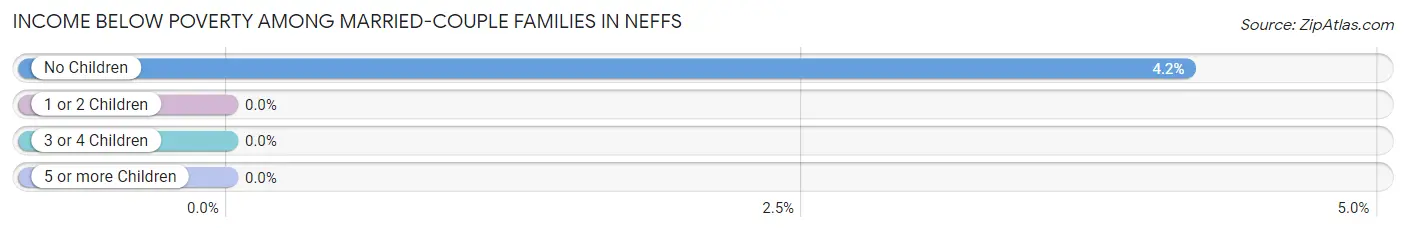
Income Below Poverty Among Married-Couple Families in Neffs
The poverty statistics for married-couple families in Neffs show that 4.2% or 11 of the total 264 families live below the poverty line. Families with no children have the highest poverty rate of 4.2%, comprising of 11 families. On the other hand, families with no children have the lowest poverty rate of 4.2%, which includes 11 families.
| Children | Above Poverty | Below Poverty |
| No Children | 253 (95.8%) | 11 (4.2%) |
| 1 or 2 Children | 0 (0.0%) | 0 (0.0%) |
| 3 or 4 Children | 0 (0.0%) | 0 (0.0%) |
| 5 or more Children | 0 (0.0%) | 0 (0.0%) |
| Total | 253 (95.8%) | 11 (4.2%) |
Income Below Poverty Among Single-Parent Households in Neffs
| Children | Single Father | Single Mother |
| No Children | 0 (0.0%) | 0 (0.0%) |
| 1 or 2 Children | 0 (0.0%) | 0 (0.0%) |
| 3 or 4 Children | 0 (0.0%) | 0 (0.0%) |
| 5 or more Children | 0 (0.0%) | 0 (0.0%) |
| Total | 0 (0.0%) | 0 (0.0%) |
Income Below Poverty Among Married-Couple vs Single-Parent Households in Neffs
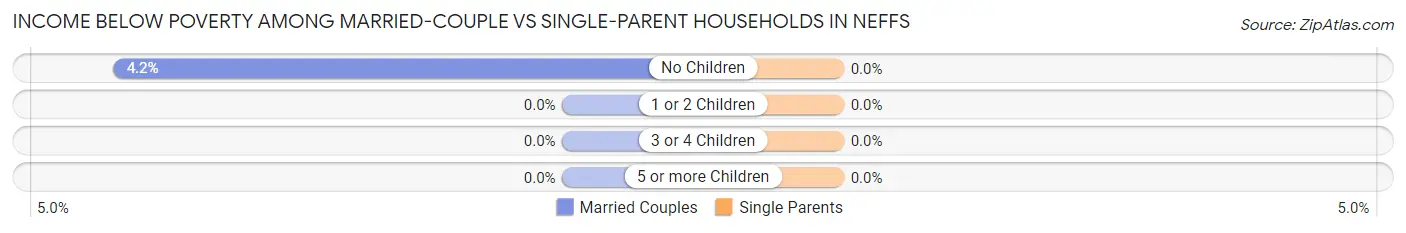
| Children | Married-Couple Families | Single-Parent Households |
| No Children | 11 (4.2%) | 0 (0.0%) |
| 1 or 2 Children | 0 (0.0%) | 0 (0.0%) |
| 3 or 4 Children | 0 (0.0%) | 0 (0.0%) |
| 5 or more Children | 0 (0.0%) | 0 (0.0%) |
| Total | 11 (4.2%) | 0 (0.0%) |
Race in Neffs
The most populous races in Neffs are , and White / Caucasian (1,093 | 100.0%).
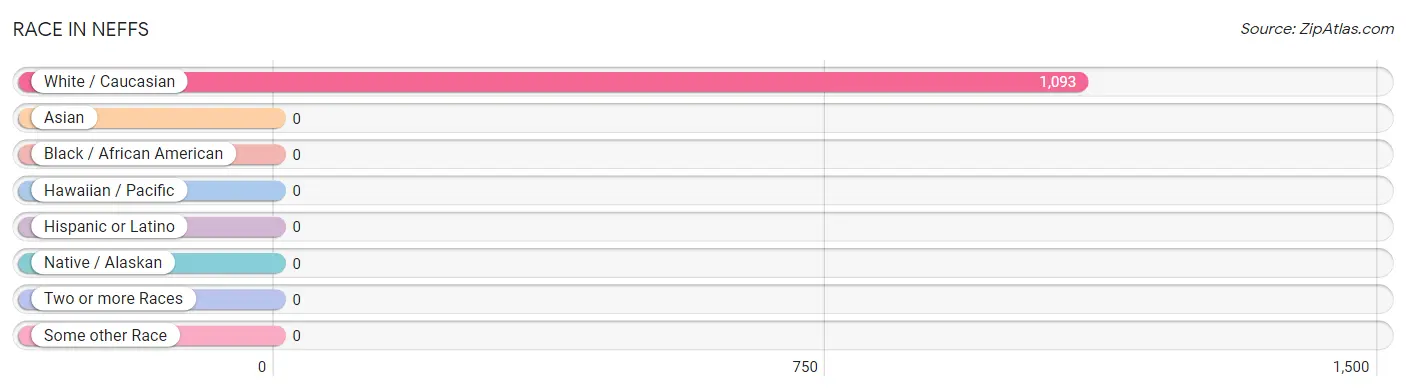
| Race | # Population | % Population |
| Asian | 0 | 0.0% |
| Black / African American | 0 | 0.0% |
| Hawaiian / Pacific | 0 | 0.0% |
| Hispanic or Latino | 0 | 0.0% |
| Native / Alaskan | 0 | 0.0% |
| White / Caucasian | 1,093 | 100.0% |
| Two or more Races | 0 | 0.0% |
| Some other Race | 0 | 0.0% |
| Total | 1,093 | 100.0% |
Ancestry in Neffs
The most populous ancestries reported in Neffs are German (210 | 19.2%), Irish (110 | 10.1%), Italian (70 | 6.4%), English (61 | 5.6%), and Polish (56 | 5.1%), together accounting for 46.4% of all Neffs residents.
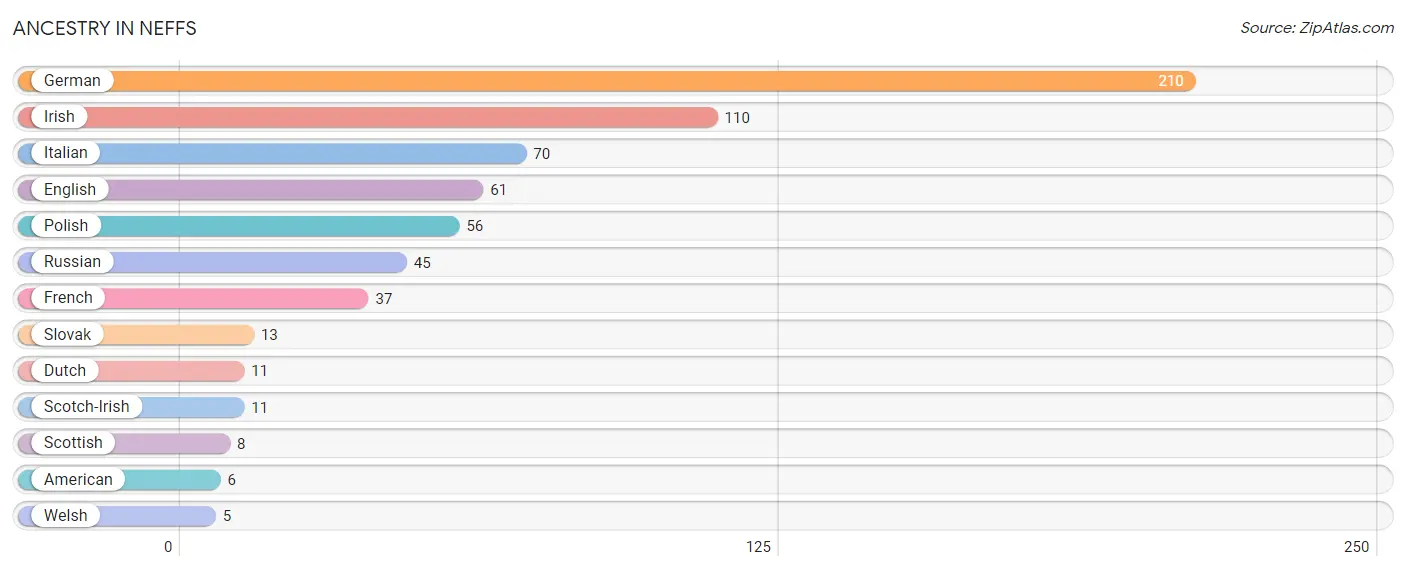
| Ancestry | # Population | % Population |
| American | 6 | 0.5% |
| Dutch | 11 | 1.0% |
| English | 61 | 5.6% |
| French | 37 | 3.4% |
| German | 210 | 19.2% |
| Irish | 110 | 10.1% |
| Italian | 70 | 6.4% |
| Polish | 56 | 5.1% |
| Russian | 45 | 4.1% |
| Scotch-Irish | 11 | 1.0% |
| Scottish | 8 | 0.7% |
| Slovak | 13 | 1.2% |
| Welsh | 5 | 0.5% | View All 13 Rows |
Immigrants in Neffs

| Immigration Origin | # Population | % Population | View All 0 Rows |
Sex and Age in Neffs
Sex and Age in Neffs
The most populous age groups in Neffs are 50 to 54 Years (121 | 22.0%) for men and 55 to 59 Years (176 | 32.5%) for women.
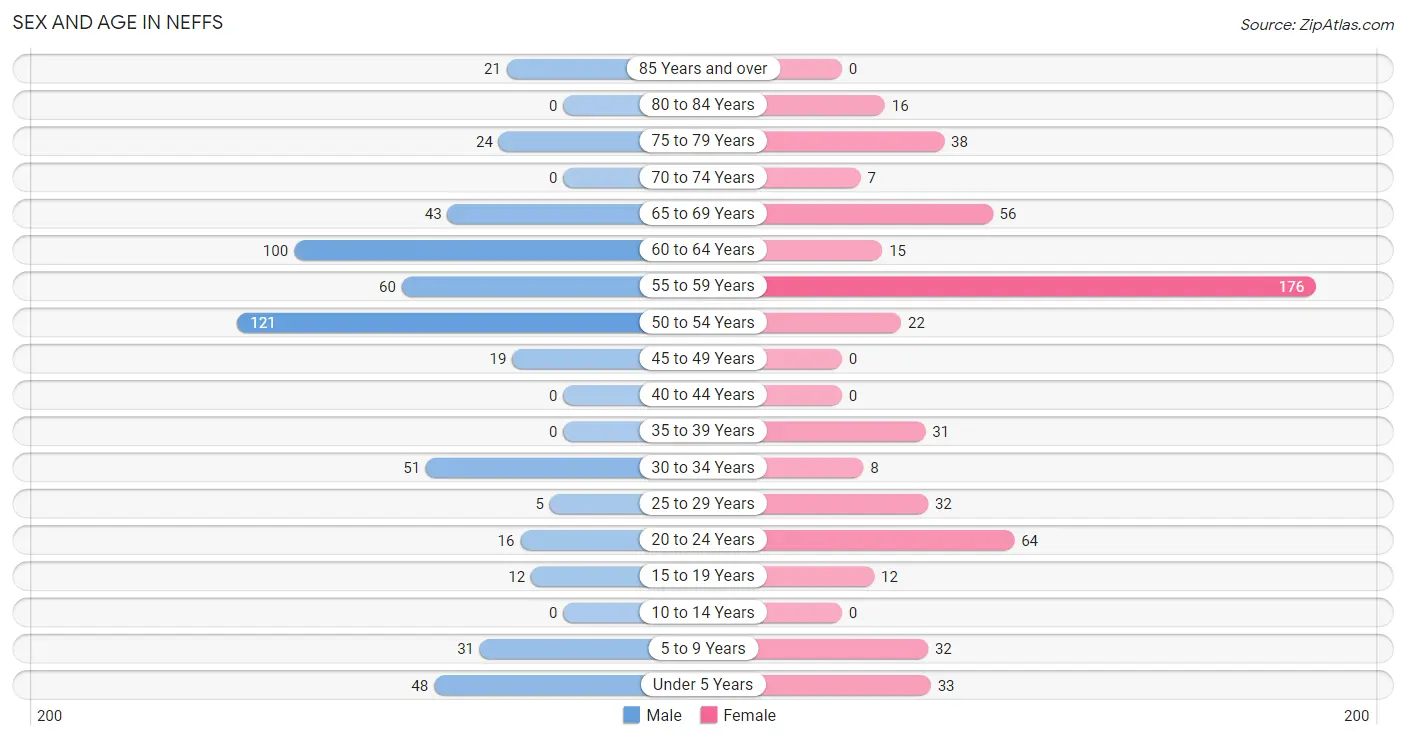
| Age Bracket | Male | Female |
| Under 5 Years | 48 (8.7%) | 33 (6.1%) |
| 5 to 9 Years | 31 (5.6%) | 32 (5.9%) |
| 10 to 14 Years | 0 (0.0%) | 0 (0.0%) |
| 15 to 19 Years | 12 (2.2%) | 12 (2.2%) |
| 20 to 24 Years | 16 (2.9%) | 64 (11.8%) |
| 25 to 29 Years | 5 (0.9%) | 32 (5.9%) |
| 30 to 34 Years | 51 (9.3%) | 8 (1.5%) |
| 35 to 39 Years | 0 (0.0%) | 31 (5.7%) |
| 40 to 44 Years | 0 (0.0%) | 0 (0.0%) |
| 45 to 49 Years | 19 (3.5%) | 0 (0.0%) |
| 50 to 54 Years | 121 (22.0%) | 22 (4.1%) |
| 55 to 59 Years | 60 (10.9%) | 176 (32.5%) |
| 60 to 64 Years | 100 (18.1%) | 15 (2.8%) |
| 65 to 69 Years | 43 (7.8%) | 56 (10.3%) |
| 70 to 74 Years | 0 (0.0%) | 7 (1.3%) |
| 75 to 79 Years | 24 (4.4%) | 38 (7.0%) |
| 80 to 84 Years | 0 (0.0%) | 16 (2.9%) |
| 85 Years and over | 21 (3.8%) | 0 (0.0%) |
| Total | 551 (100.0%) | 542 (100.0%) |
Families and Households in Neffs
Median Family Size in Neffs
The median family size in Neffs is 2.58 persons per family, with single female/mother families (21 | 6.4%) accounting for the largest median family size of 4.86 persons per family. On the other hand, married-couple families (264 | 80.2%) represent the smallest median family size with 2.20 persons per family.
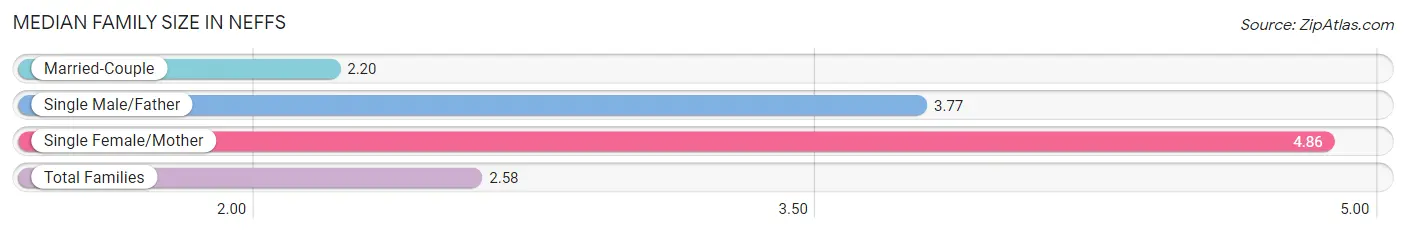
| Family Type | # Families | Family Size |
| Married-Couple | 264 (80.2%) | 2.20 |
| Single Male/Father | 44 (13.4%) | 3.77 |
| Single Female/Mother | 21 (6.4%) | 4.86 |
| Total Families | 329 (100.0%) | 2.58 |
Median Household Size in Neffs
The median household size in Neffs is 2.27 persons per household, with single female/mother households (21 | 4.4%) accounting for the largest median household size of 4.86 persons per household. non-family households (153 | 31.7%) represent the smallest median household size with 1.29 persons per household.
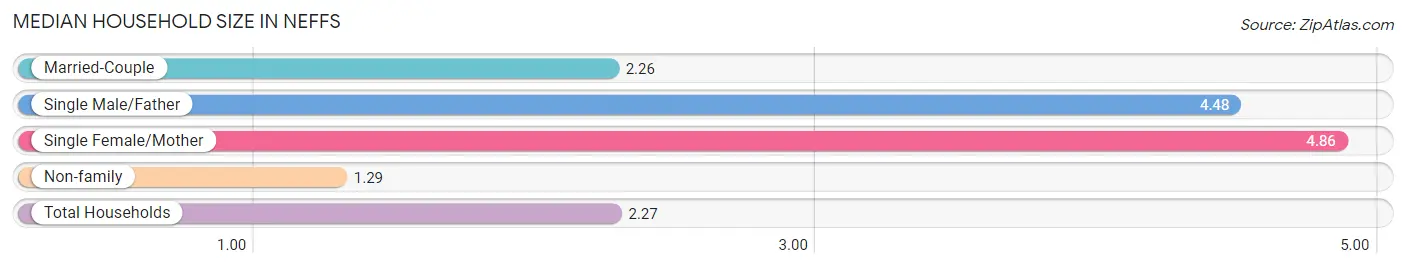
| Household Type | # Households | Household Size |
| Married-Couple | 264 (54.8%) | 2.26 |
| Single Male/Father | 44 (9.1%) | 4.48 |
| Single Female/Mother | 21 (4.4%) | 4.86 |
| Non-family | 153 (31.7%) | 1.29 |
| Total Households | 482 (100.0%) | 2.27 |
Household Size by Marriage Status in Neffs
Out of a total of 482 households in Neffs, 329 (68.3%) are family households, while 153 (31.7%) are nonfamily households. The most numerous type of family households are 2-person households, comprising 229, and the most common type of nonfamily households are 1-person households, comprising 125.
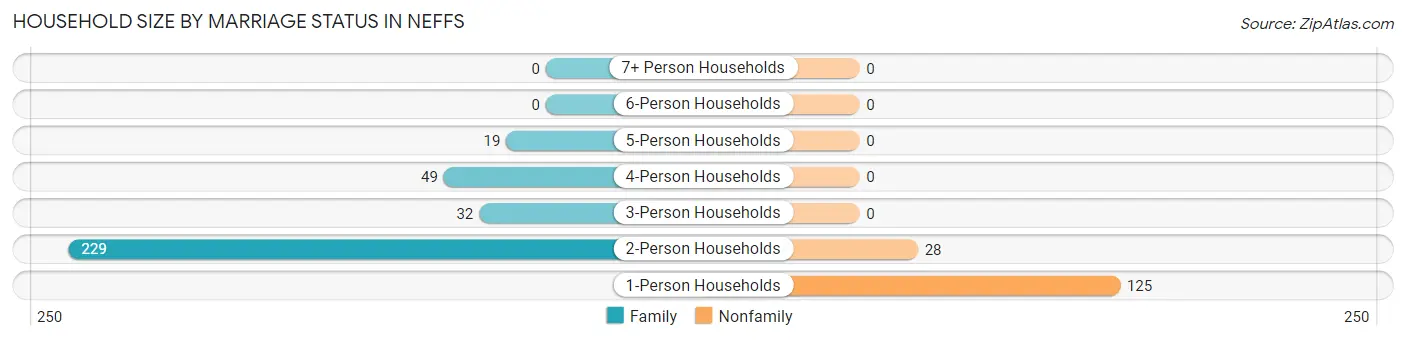
| Household Size | Family Households | Nonfamily Households |
| 1-Person Households | - | 125 (25.9%) |
| 2-Person Households | 229 (47.5%) | 28 (5.8%) |
| 3-Person Households | 32 (6.6%) | 0 (0.0%) |
| 4-Person Households | 49 (10.2%) | 0 (0.0%) |
| 5-Person Households | 19 (3.9%) | 0 (0.0%) |
| 6-Person Households | 0 (0.0%) | 0 (0.0%) |
| 7+ Person Households | 0 (0.0%) | 0 (0.0%) |
| Total | 329 (68.3%) | 153 (31.7%) |
Female Fertility in Neffs
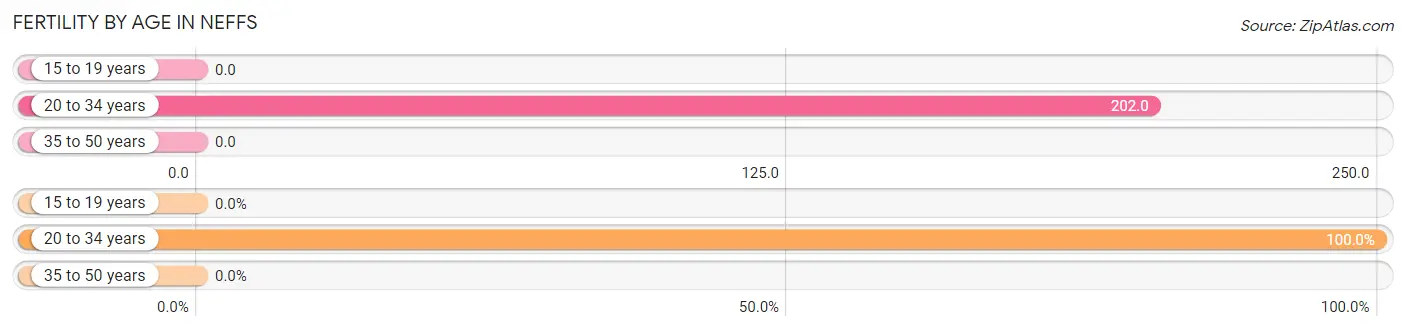
Fertility by Age in Neffs
Average fertility rate in Neffs is 143.0 births per 1,000 women. Women in the age bracket of 20 to 34 years have the highest fertility rate with 202.0 births per 1,000 women. Women in the age bracket of 20 to 34 years acount for 100.0% of all women with births.
| Age Bracket | Women with Births | Births / 1,000 Women |
| 15 to 19 years | 0 (0.0%) | 0.0 |
| 20 to 34 years | 21 (100.0%) | 202.0 |
| 35 to 50 years | 0 (0.0%) | 0.0 |
| Total | 21 (100.0%) | 143.0 |
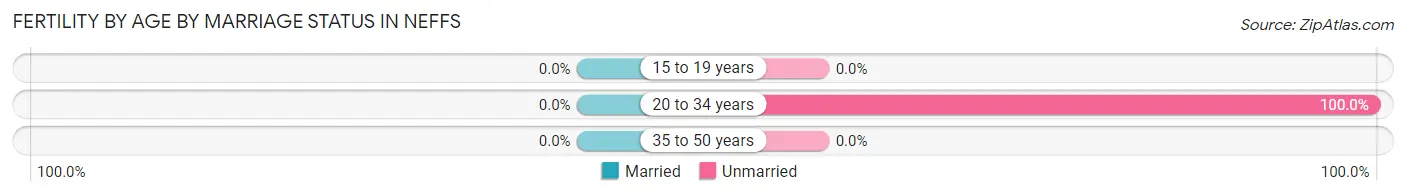
Fertility by Age by Marriage Status in Neffs
| Age Bracket | Married | Unmarried |
| 15 to 19 years | 0 (0.0%) | 0 (0.0%) |
| 20 to 34 years | 0 (0.0%) | 21 (100.0%) |
| 35 to 50 years | 0 (0.0%) | 0 (0.0%) |
| Total | 0 (0.0%) | 21 (100.0%) |
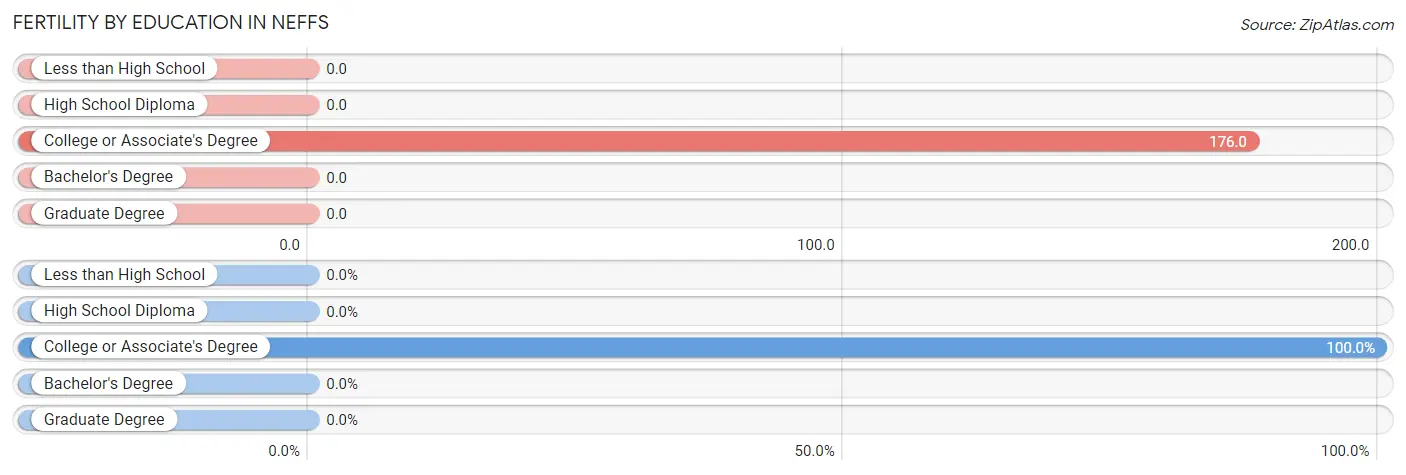
Fertility by Education in Neffs
| Educational Attainment | Women with Births | Births / 1,000 Women |
| Less than High School | 0 (0.0%) | 0.0 |
| High School Diploma | 0 (0.0%) | 0.0 |
| College or Associate's Degree | 21 (100.0%) | 176.0 |
| Bachelor's Degree | 0 (0.0%) | 0.0 |
| Graduate Degree | 0 (0.0%) | 0.0 |
| Total | 21 (100.0%) | 143.0 |
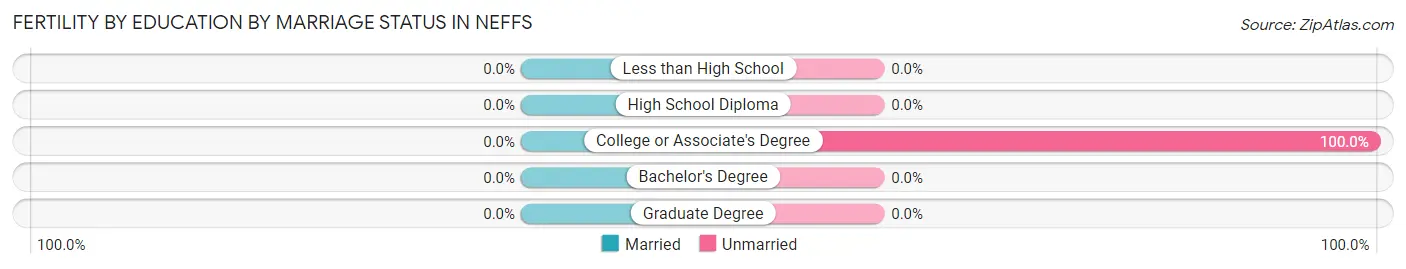
Fertility by Education by Marriage Status in Neffs
| Educational Attainment | Married | Unmarried |
| Less than High School | 0 (0.0%) | 0 (0.0%) |
| High School Diploma | 0 (0.0%) | 0 (0.0%) |
| College or Associate's Degree | 0 (0.0%) | 21 (100.0%) |
| Bachelor's Degree | 0 (0.0%) | 0 (0.0%) |
| Graduate Degree | 0 (0.0%) | 0 (0.0%) |
| Total | 0 (0.0%) | 21 (100.0%) |
Employment Characteristics in Neffs
Employment by Class of Employer in Neffs
Among the 492 employed individuals in Neffs, private company employees (465 | 94.5%), not-for-profit organizations (16 | 3.3%), and local government employees (11 | 2.2%) make up the most common classes of employment.
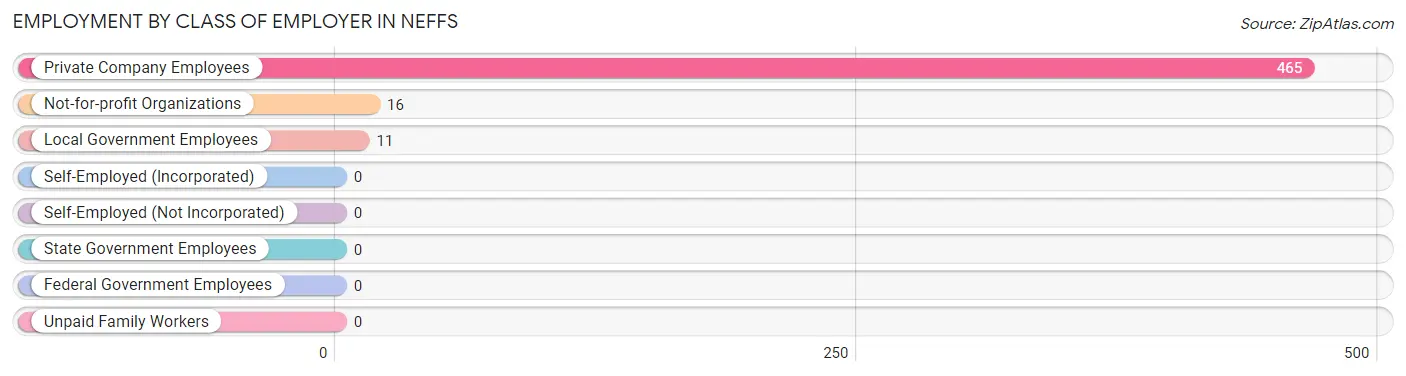
| Employer Class | # Employees | % Employees |
| Private Company Employees | 465 | 94.5% |
| Self-Employed (Incorporated) | 0 | 0.0% |
| Self-Employed (Not Incorporated) | 0 | 0.0% |
| Not-for-profit Organizations | 16 | 3.3% |
| Local Government Employees | 11 | 2.2% |
| State Government Employees | 0 | 0.0% |
| Federal Government Employees | 0 | 0.0% |
| Unpaid Family Workers | 0 | 0.0% |
| Total | 492 | 100.0% |
Employment Status by Age in Neffs
According to the labor force statistics for Neffs, out of the total population over 16 years of age (940), 54.6% or 513 individuals are in the labor force, with 4.1% or 21 of them unemployed. The age group with the highest labor force participation rate is 25 to 29 years, with 100.0% or 37 individuals in the labor force. Within the labor force, the 75 years and over age range has the highest percentage of unemployed individuals, with 100.0% or 6 of them being unemployed.
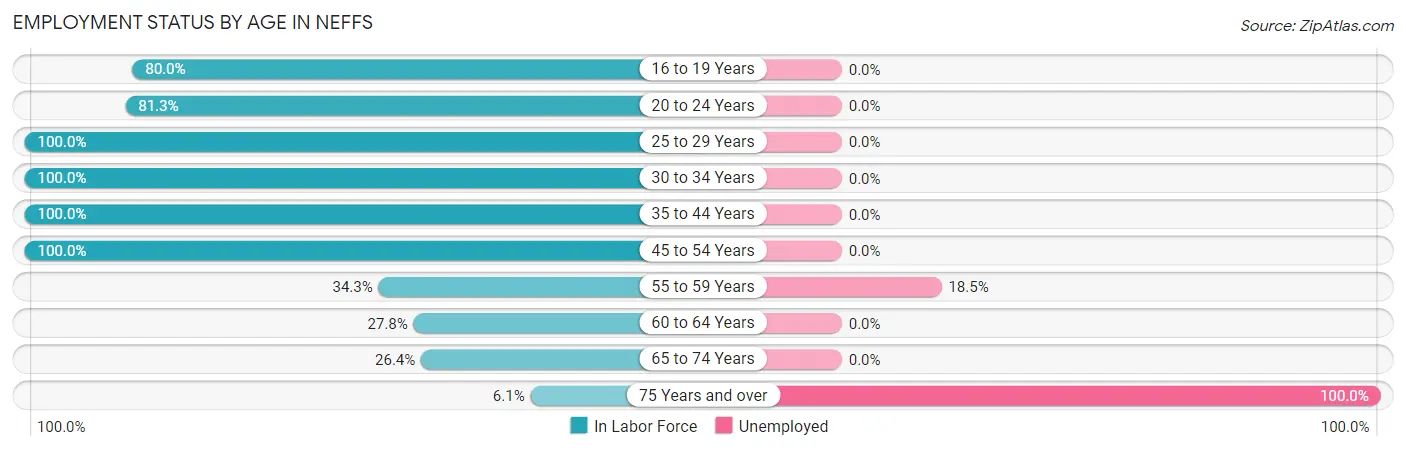
| Age Bracket | In Labor Force | Unemployed |
| 16 to 19 Years | 12 (80.0%) | 0 (0.0%) |
| 20 to 24 Years | 65 (81.3%) | 0 (0.0%) |
| 25 to 29 Years | 37 (100.0%) | 0 (0.0%) |
| 30 to 34 Years | 59 (100.0%) | 0 (0.0%) |
| 35 to 44 Years | 31 (100.0%) | 0 (0.0%) |
| 45 to 54 Years | 162 (100.0%) | 0 (0.0%) |
| 55 to 59 Years | 81 (34.3%) | 15 (18.5%) |
| 60 to 64 Years | 32 (27.8%) | 0 (0.0%) |
| 65 to 74 Years | 28 (26.4%) | 0 (0.0%) |
| 75 Years and over | 6 (6.1%) | 6 (100.0%) |
| Total | 513 (54.6%) | 21 (4.1%) |
Employment Status by Educational Attainment in Neffs
According to labor force statistics for Neffs, 62.8% of individuals (402) out of the total population between 25 and 64 years of age (640) are in the labor force, with 3.7% or 15 of them being unemployed. The group with the highest labor force participation rate are those with the educational attainment of bachelor's degree or higher, with 100.0% or 38 individuals in the labor force. Within the labor force, individuals with high school diploma education have the highest percentage of unemployment, with 6.3% or 15 of them being unemployed.
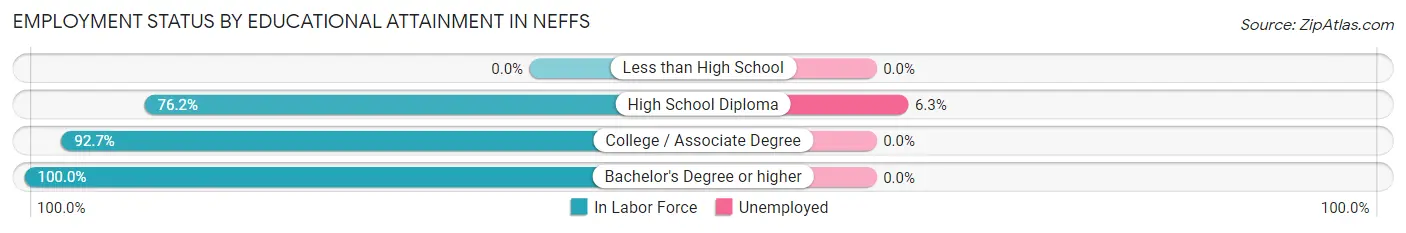
| Educational Attainment | In Labor Force | Unemployed |
| Less than High School | 0 (0.0%) | 0 (0.0%) |
| High School Diploma | 237 (76.2%) | 20 (6.3%) |
| College / Associate Degree | 127 (92.7%) | 0 (0.0%) |
| Bachelor's Degree or higher | 38 (100.0%) | 0 (0.0%) |
| Total | 402 (62.8%) | 24 (3.7%) |
Employment Occupations by Sex in Neffs
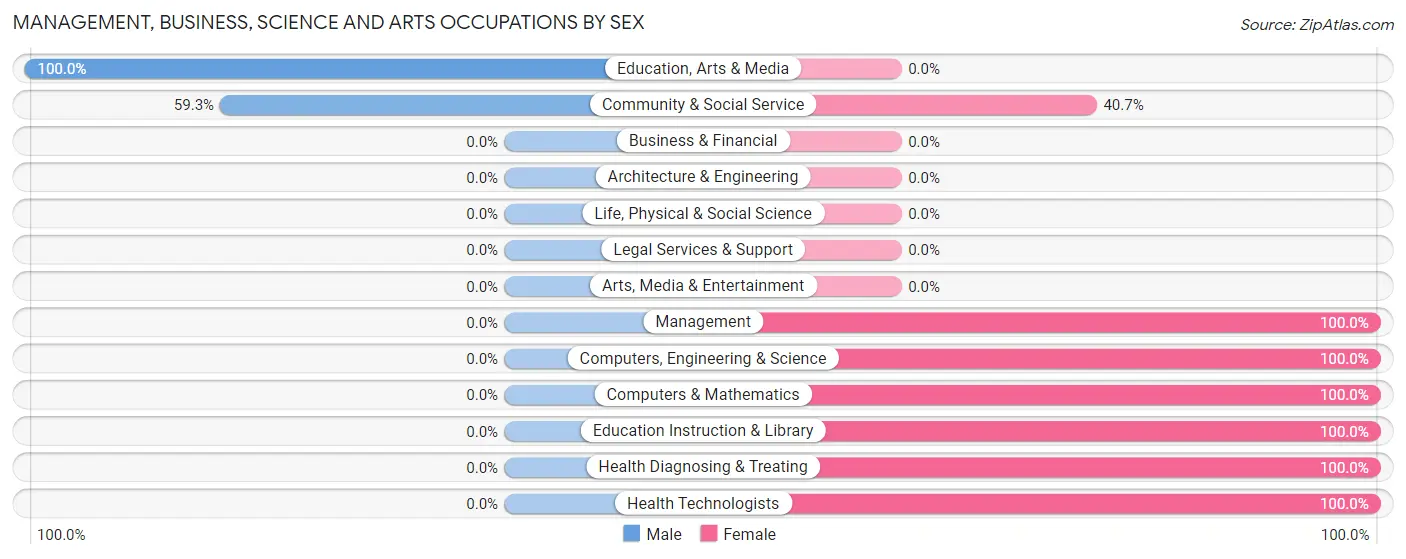
Management, Business, Science and Arts Occupations
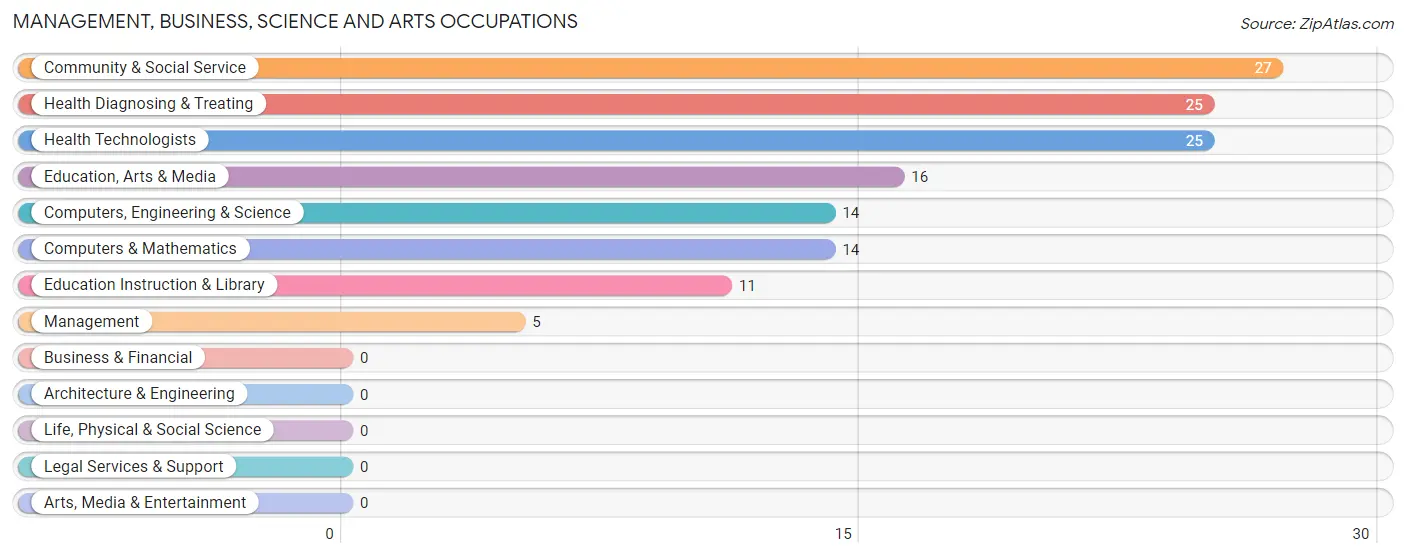
The most common Management, Business, Science and Arts occupations in Neffs are Community & Social Service (27 | 5.5%), Health Diagnosing & Treating (25 | 5.1%), Health Technologists (25 | 5.1%), Education, Arts & Media (16 | 3.3%), and Computers, Engineering & Science (14 | 2.9%).
Management, Business, Science and Arts Occupations by Sex
Within the Management, Business, Science and Arts occupations in Neffs, the most male-oriented occupations are Education, Arts & Media (100.0%), and Community & Social Service (59.3%), while the most female-oriented occupations are Management (100.0%), Computers, Engineering & Science (100.0%), and Computers & Mathematics (100.0%).
| Occupation | Male | Female |
| Management | 0 (0.0%) | 5 (100.0%) |
| Business & Financial | 0 (0.0%) | 0 (0.0%) |
| Computers, Engineering & Science | 0 (0.0%) | 14 (100.0%) |
| Computers & Mathematics | 0 (0.0%) | 14 (100.0%) |
| Architecture & Engineering | 0 (0.0%) | 0 (0.0%) |
| Life, Physical & Social Science | 0 (0.0%) | 0 (0.0%) |
| Community & Social Service | 16 (59.3%) | 11 (40.7%) |
| Education, Arts & Media | 16 (100.0%) | 0 (0.0%) |
| Legal Services & Support | 0 (0.0%) | 0 (0.0%) |
| Education Instruction & Library | 0 (0.0%) | 11 (100.0%) |
| Arts, Media & Entertainment | 0 (0.0%) | 0 (0.0%) |
| Health Diagnosing & Treating | 0 (0.0%) | 25 (100.0%) |
| Health Technologists | 0 (0.0%) | 25 (100.0%) |
| Total (Category) | 16 (22.5%) | 55 (77.5%) |
| Total (Overall) | 303 (61.6%) | 189 (38.4%) |
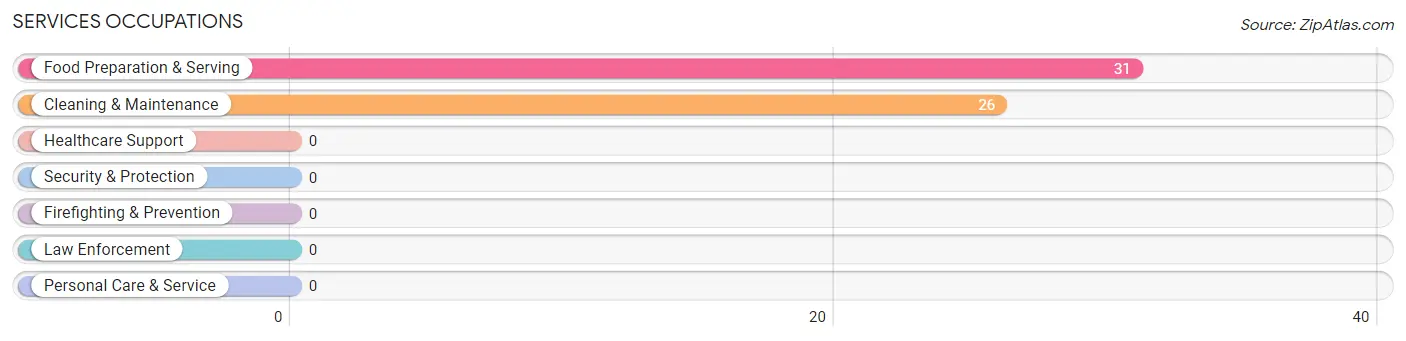
Services Occupations
The most common Services occupations in Neffs are Food Preparation & Serving (31 | 6.3%), and Cleaning & Maintenance (26 | 5.3%).
Services Occupations by Sex
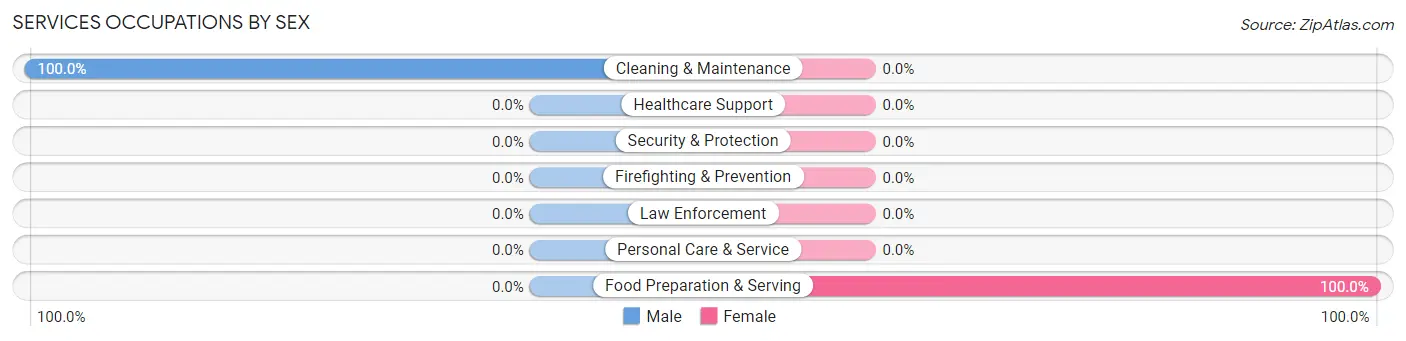
| Occupation | Male | Female |
| Healthcare Support | 0 (0.0%) | 0 (0.0%) |
| Security & Protection | 0 (0.0%) | 0 (0.0%) |
| Firefighting & Prevention | 0 (0.0%) | 0 (0.0%) |
| Law Enforcement | 0 (0.0%) | 0 (0.0%) |
| Food Preparation & Serving | 0 (0.0%) | 31 (100.0%) |
| Cleaning & Maintenance | 26 (100.0%) | 0 (0.0%) |
| Personal Care & Service | 0 (0.0%) | 0 (0.0%) |
| Total (Category) | 26 (45.6%) | 31 (54.4%) |
| Total (Overall) | 303 (61.6%) | 189 (38.4%) |
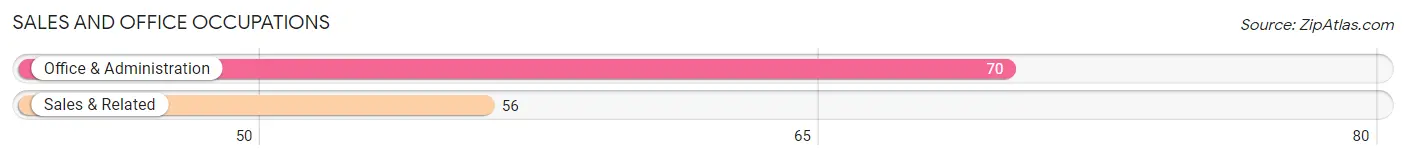
Sales and Office Occupations
The most common Sales and Office occupations in Neffs are Office & Administration (70 | 14.2%), and Sales & Related (56 | 11.4%).
Sales and Office Occupations by Sex
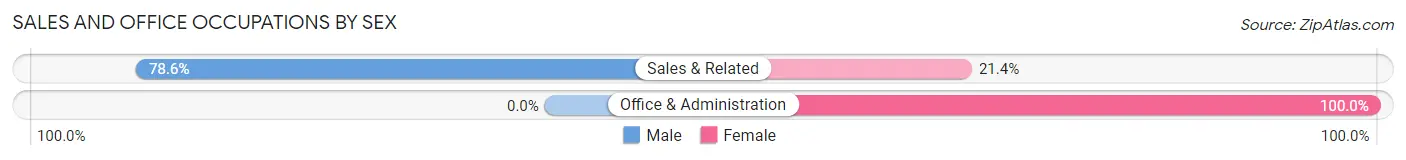
| Occupation | Male | Female |
| Sales & Related | 44 (78.6%) | 12 (21.4%) |
| Office & Administration | 0 (0.0%) | 70 (100.0%) |
| Total (Category) | 44 (34.9%) | 82 (65.1%) |
| Total (Overall) | 303 (61.6%) | 189 (38.4%) |
Natural Resources, Construction and Maintenance Occupations
The most common Natural Resources, Construction and Maintenance occupations in Neffs are , and Installation, Maintenance & Repair (137 | 27.9%).
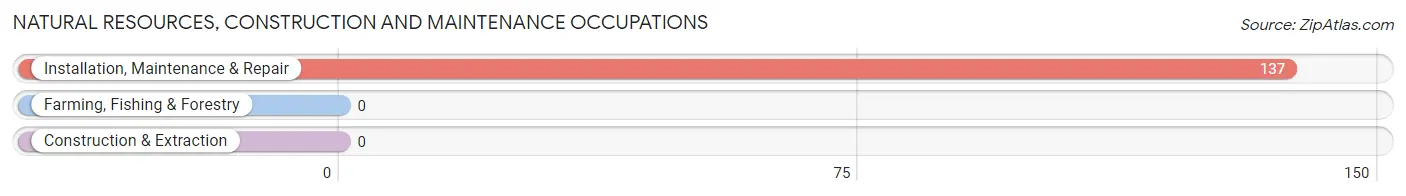
Natural Resources, Construction and Maintenance Occupations by Sex
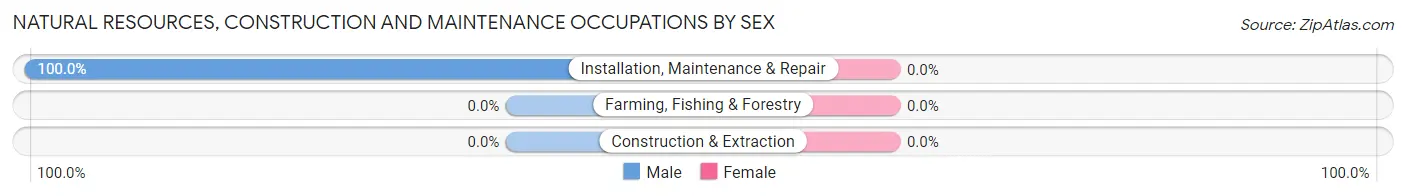
| Occupation | Male | Female |
| Farming, Fishing & Forestry | 0 (0.0%) | 0 (0.0%) |
| Construction & Extraction | 0 (0.0%) | 0 (0.0%) |
| Installation, Maintenance & Repair | 137 (100.0%) | 0 (0.0%) |
| Total (Category) | 137 (100.0%) | 0 (0.0%) |
| Total (Overall) | 303 (61.6%) | 189 (38.4%) |
Production, Transportation and Moving Occupations
The most common Production, Transportation and Moving occupations in Neffs are Material Moving (48 | 9.8%), Transportation (43 | 8.7%), and Production (10 | 2.0%).
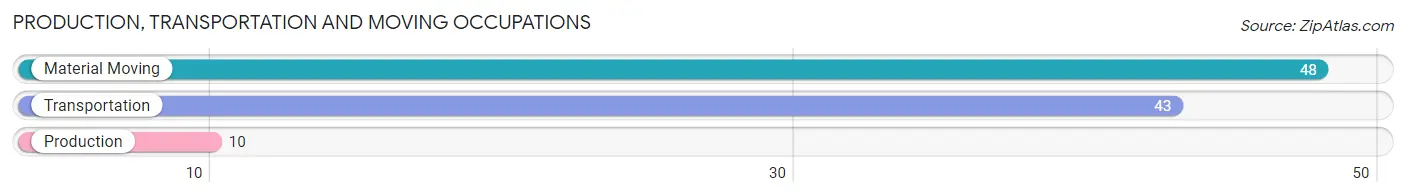
Production, Transportation and Moving Occupations by Sex
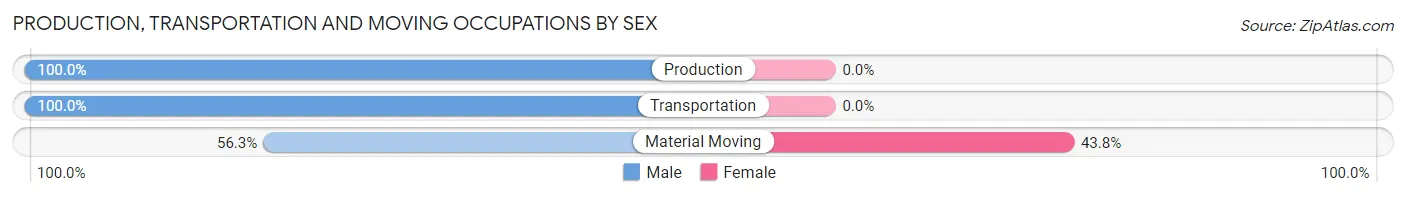
| Occupation | Male | Female |
| Production | 10 (100.0%) | 0 (0.0%) |
| Transportation | 43 (100.0%) | 0 (0.0%) |
| Material Moving | 27 (56.2%) | 21 (43.8%) |
| Total (Category) | 80 (79.2%) | 21 (20.8%) |
| Total (Overall) | 303 (61.6%) | 189 (38.4%) |
Employment Industries by Sex in Neffs
Employment Industries in Neffs
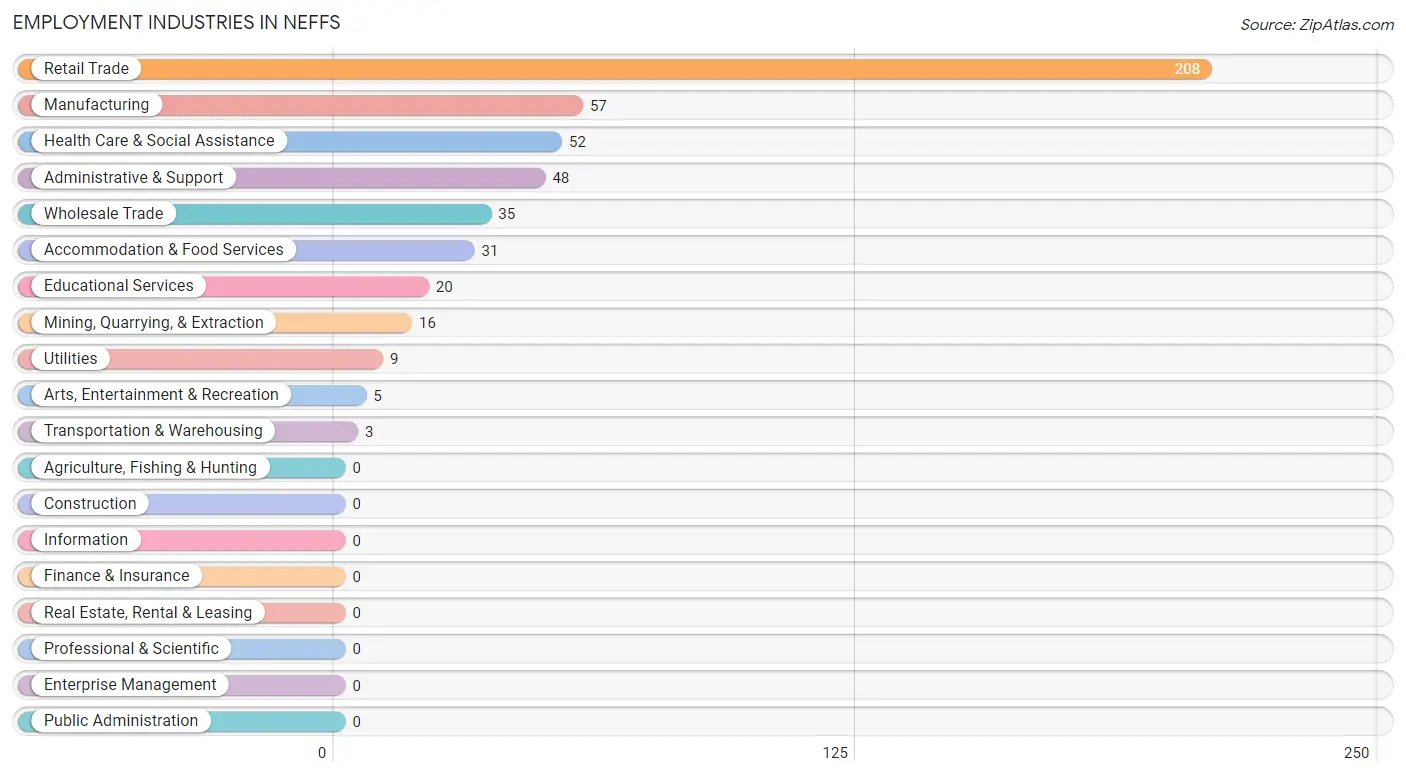
The major employment industries in Neffs include Retail Trade (208 | 42.3%), Manufacturing (57 | 11.6%), Health Care & Social Assistance (52 | 10.6%), Administrative & Support (48 | 9.8%), and Wholesale Trade (35 | 7.1%).
Employment Industries by Sex in Neffs
The Neffs industries that see more men than women are Mining, Quarrying, & Extraction (100.0%), Transportation & Warehousing (100.0%), and Utilities (100.0%), whereas the industries that tend to have a higher number of women are Arts, Entertainment & Recreation (100.0%), Accommodation & Food Services (100.0%), and Health Care & Social Assistance (69.2%).
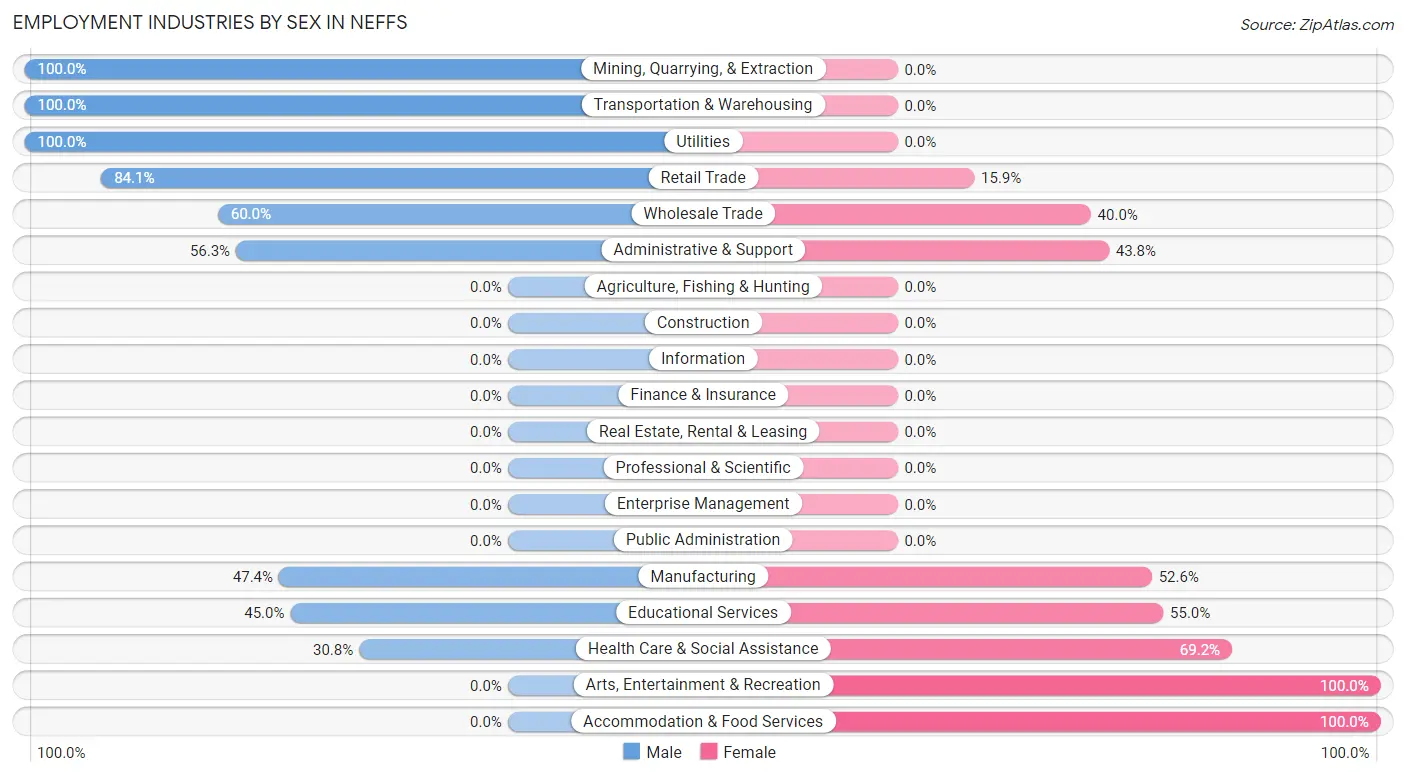
| Industry | Male | Female |
| Agriculture, Fishing & Hunting | 0 (0.0%) | 0 (0.0%) |
| Mining, Quarrying, & Extraction | 16 (100.0%) | 0 (0.0%) |
| Construction | 0 (0.0%) | 0 (0.0%) |
| Manufacturing | 27 (47.4%) | 30 (52.6%) |
| Wholesale Trade | 21 (60.0%) | 14 (40.0%) |
| Retail Trade | 175 (84.1%) | 33 (15.9%) |
| Transportation & Warehousing | 3 (100.0%) | 0 (0.0%) |
| Utilities | 9 (100.0%) | 0 (0.0%) |
| Information | 0 (0.0%) | 0 (0.0%) |
| Finance & Insurance | 0 (0.0%) | 0 (0.0%) |
| Real Estate, Rental & Leasing | 0 (0.0%) | 0 (0.0%) |
| Professional & Scientific | 0 (0.0%) | 0 (0.0%) |
| Enterprise Management | 0 (0.0%) | 0 (0.0%) |
| Administrative & Support | 27 (56.2%) | 21 (43.8%) |
| Educational Services | 9 (45.0%) | 11 (55.0%) |
| Health Care & Social Assistance | 16 (30.8%) | 36 (69.2%) |
| Arts, Entertainment & Recreation | 0 (0.0%) | 5 (100.0%) |
| Accommodation & Food Services | 0 (0.0%) | 31 (100.0%) |
| Public Administration | 0 (0.0%) | 0 (0.0%) |
| Total | 303 (61.6%) | 189 (38.4%) |
Education in Neffs
School Enrollment in Neffs
The most common levels of schooling among the 128 students in Neffs are elementary school (63 | 49.2%), college / undergraduate (56 | 43.8%), and high school (9 | 7.0%).
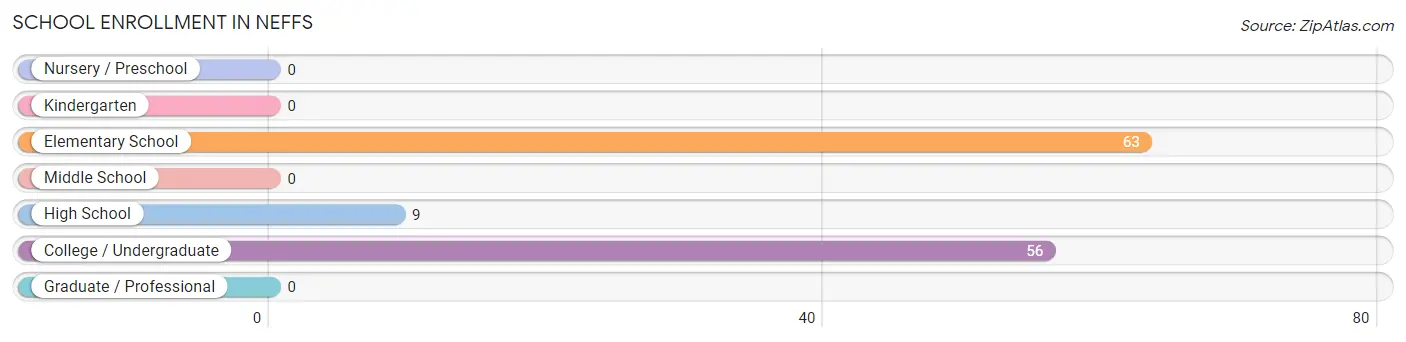
| School Level | # Students | % Students |
| Nursery / Preschool | 0 | 0.0% |
| Kindergarten | 0 | 0.0% |
| Elementary School | 63 | 49.2% |
| Middle School | 0 | 0.0% |
| High School | 9 | 7.0% |
| College / Undergraduate | 56 | 43.8% |
| Graduate / Professional | 0 | 0.0% |
| Total | 128 | 100.0% |
School Enrollment by Age by Funding Source in Neffs
Out of a total of 128 students who are enrolled in schools in Neffs, 3 (2.3%) attend a private institution, while the remaining 125 (97.7%) are enrolled in public schools. The age group of 18 to 19 year olds has the highest likelihood of being enrolled in private schools, with 3 (20.0% in the age bracket) enrolled. Conversely, the age group of 5 to 9 year old has the lowest likelihood of being enrolled in a private school, with 63 (100.0% in the age bracket) attending a public institution.
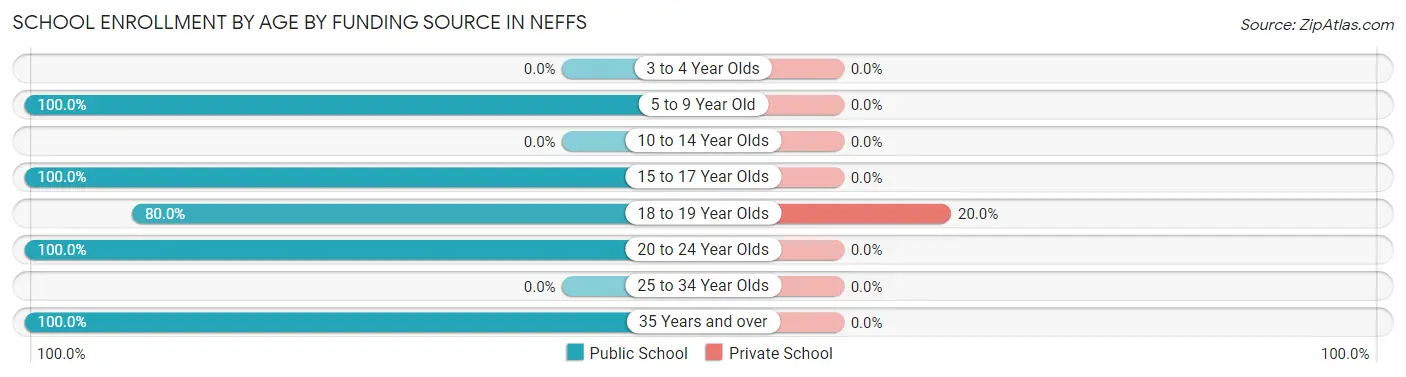
| Age Bracket | Public School | Private School |
| 3 to 4 Year Olds | 0 (0.0%) | 0 (0.0%) |
| 5 to 9 Year Old | 63 (100.0%) | 0 (0.0%) |
| 10 to 14 Year Olds | 0 (0.0%) | 0 (0.0%) |
| 15 to 17 Year Olds | 9 (100.0%) | 0 (0.0%) |
| 18 to 19 Year Olds | 12 (80.0%) | 3 (20.0%) |
| 20 to 24 Year Olds | 15 (100.0%) | 0 (0.0%) |
| 25 to 34 Year Olds | 0 (0.0%) | 0 (0.0%) |
| 35 Years and over | 26 (100.0%) | 0 (0.0%) |
| Total | 125 (97.7%) | 3 (2.3%) |
Educational Attainment by Field of Study in Neffs
Science & technology (27 | 61.4%), education (11 | 25.0%), and business (6 | 13.6%) are the most common fields of study among 44 individuals in Neffs who have obtained a bachelor's degree or higher.
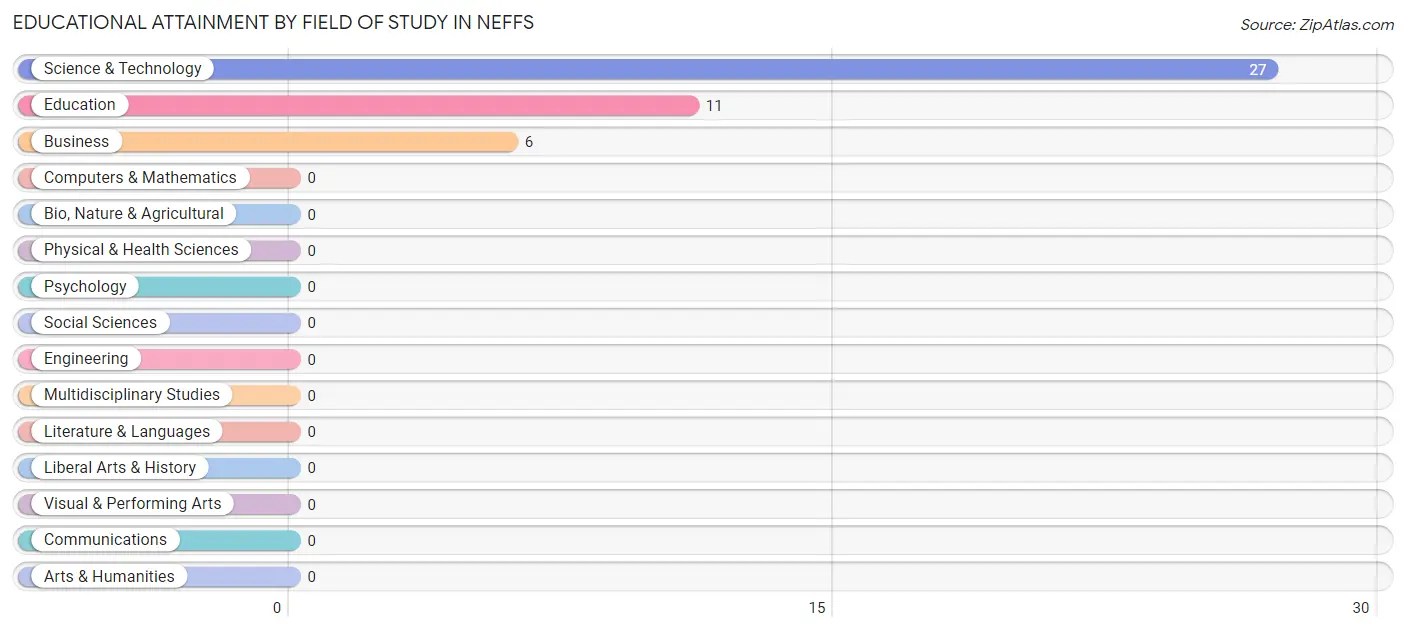
| Field of Study | # Graduates | % Graduates |
| Computers & Mathematics | 0 | 0.0% |
| Bio, Nature & Agricultural | 0 | 0.0% |
| Physical & Health Sciences | 0 | 0.0% |
| Psychology | 0 | 0.0% |
| Social Sciences | 0 | 0.0% |
| Engineering | 0 | 0.0% |
| Multidisciplinary Studies | 0 | 0.0% |
| Science & Technology | 27 | 61.4% |
| Business | 6 | 13.6% |
| Education | 11 | 25.0% |
| Literature & Languages | 0 | 0.0% |
| Liberal Arts & History | 0 | 0.0% |
| Visual & Performing Arts | 0 | 0.0% |
| Communications | 0 | 0.0% |
| Arts & Humanities | 0 | 0.0% |
| Total | 44 | 100.0% |
Transportation & Commute in Neffs
Vehicle Availability by Sex in Neffs
The most prevalent vehicle ownership categories in Neffs are males with 2 vehicles (154, accounting for 50.8%) and females with 2 vehicles (5, making up 81.5%).
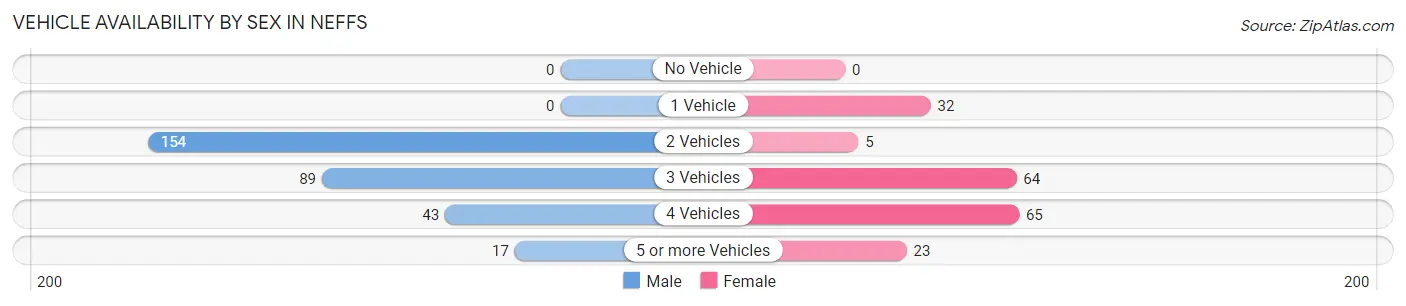
| Vehicles Available | Male | Female |
| No Vehicle | 0 (0.0%) | 0 (0.0%) |
| 1 Vehicle | 0 (0.0%) | 32 (16.9%) |
| 2 Vehicles | 154 (50.8%) | 5 (2.6%) |
| 3 Vehicles | 89 (29.4%) | 64 (33.9%) |
| 4 Vehicles | 43 (14.2%) | 65 (34.4%) |
| 5 or more Vehicles | 17 (5.6%) | 23 (12.2%) |
| Total | 303 (100.0%) | 189 (100.0%) |
Commute Time in Neffs
The most frequently occuring commute durations in Neffs are 20 to 24 minutes (147 commuters, 29.9%), 30 to 34 minutes (127 commuters, 25.8%), and 25 to 29 minutes (82 commuters, 16.7%).
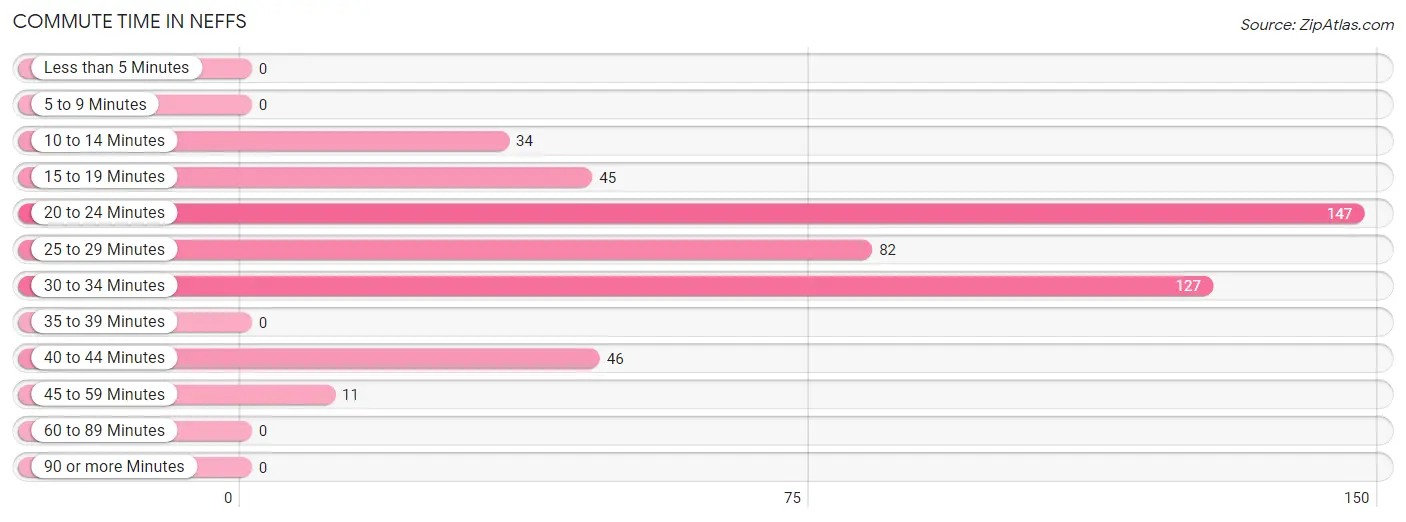
| Commute Time | # Commuters | % Commuters |
| Less than 5 Minutes | 0 | 0.0% |
| 5 to 9 Minutes | 0 | 0.0% |
| 10 to 14 Minutes | 34 | 6.9% |
| 15 to 19 Minutes | 45 | 9.1% |
| 20 to 24 Minutes | 147 | 29.9% |
| 25 to 29 Minutes | 82 | 16.7% |
| 30 to 34 Minutes | 127 | 25.8% |
| 35 to 39 Minutes | 0 | 0.0% |
| 40 to 44 Minutes | 46 | 9.3% |
| 45 to 59 Minutes | 11 | 2.2% |
| 60 to 89 Minutes | 0 | 0.0% |
| 90 or more Minutes | 0 | 0.0% |
Commute Time by Sex in Neffs
The most common commute times in Neffs are 30 to 34 minutes (127 commuters, 41.9%) for males and 20 to 24 minutes (119 commuters, 63.0%) for females.
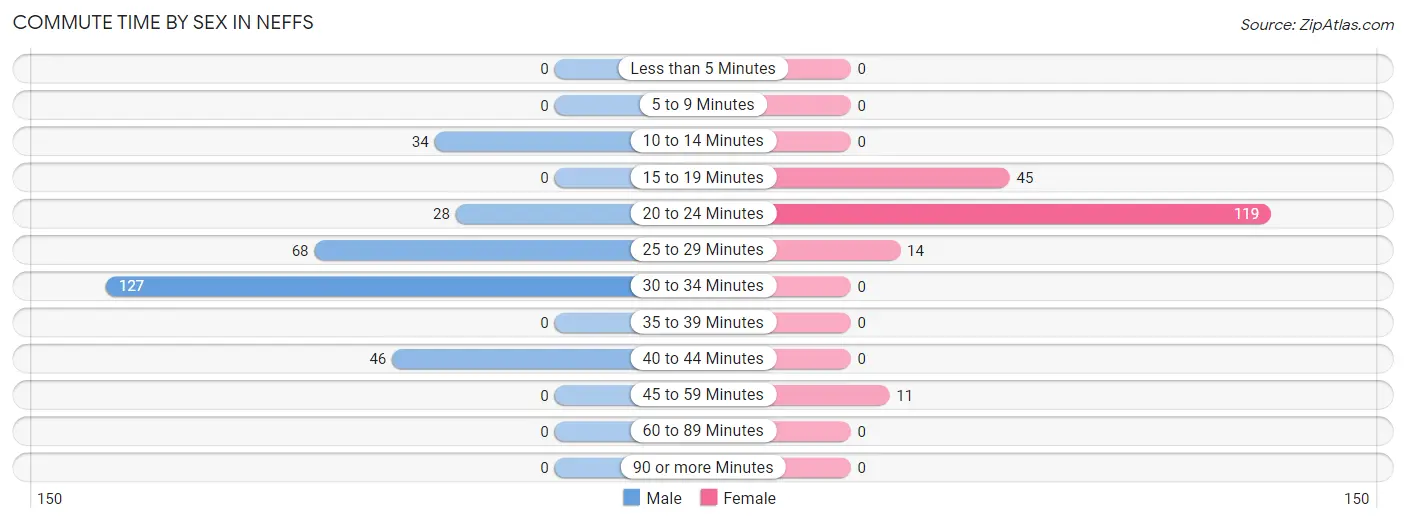
| Commute Time | Male | Female |
| Less than 5 Minutes | 0 (0.0%) | 0 (0.0%) |
| 5 to 9 Minutes | 0 (0.0%) | 0 (0.0%) |
| 10 to 14 Minutes | 34 (11.2%) | 0 (0.0%) |
| 15 to 19 Minutes | 0 (0.0%) | 45 (23.8%) |
| 20 to 24 Minutes | 28 (9.2%) | 119 (63.0%) |
| 25 to 29 Minutes | 68 (22.4%) | 14 (7.4%) |
| 30 to 34 Minutes | 127 (41.9%) | 0 (0.0%) |
| 35 to 39 Minutes | 0 (0.0%) | 0 (0.0%) |
| 40 to 44 Minutes | 46 (15.2%) | 0 (0.0%) |
| 45 to 59 Minutes | 0 (0.0%) | 11 (5.8%) |
| 60 to 89 Minutes | 0 (0.0%) | 0 (0.0%) |
| 90 or more Minutes | 0 (0.0%) | 0 (0.0%) |
Time of Departure to Work by Sex in Neffs
The most frequent times of departure to work in Neffs are 7:30 AM to 7:59 AM (128, 42.2%) for males and 12:00 PM to 3:59 PM (52, 27.5%) for females.
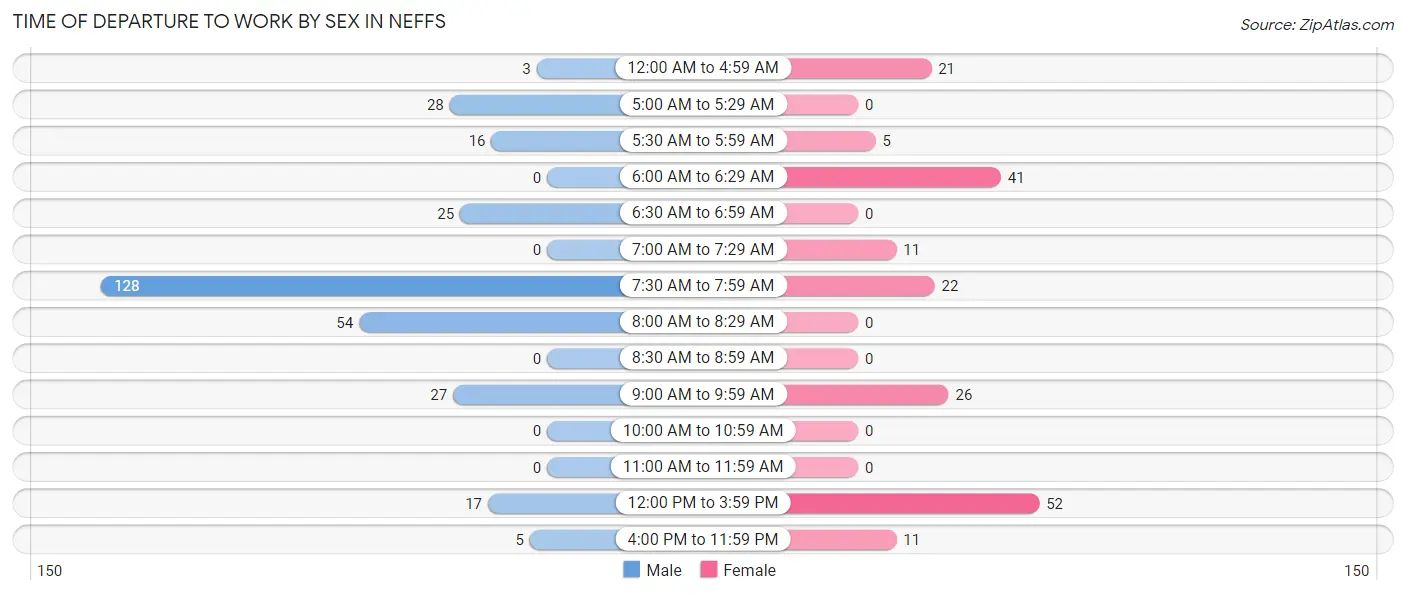
| Time of Departure | Male | Female |
| 12:00 AM to 4:59 AM | 3 (1.0%) | 21 (11.1%) |
| 5:00 AM to 5:29 AM | 28 (9.2%) | 0 (0.0%) |
| 5:30 AM to 5:59 AM | 16 (5.3%) | 5 (2.6%) |
| 6:00 AM to 6:29 AM | 0 (0.0%) | 41 (21.7%) |
| 6:30 AM to 6:59 AM | 25 (8.3%) | 0 (0.0%) |
| 7:00 AM to 7:29 AM | 0 (0.0%) | 11 (5.8%) |
| 7:30 AM to 7:59 AM | 128 (42.2%) | 22 (11.6%) |
| 8:00 AM to 8:29 AM | 54 (17.8%) | 0 (0.0%) |
| 8:30 AM to 8:59 AM | 0 (0.0%) | 0 (0.0%) |
| 9:00 AM to 9:59 AM | 27 (8.9%) | 26 (13.8%) |
| 10:00 AM to 10:59 AM | 0 (0.0%) | 0 (0.0%) |
| 11:00 AM to 11:59 AM | 0 (0.0%) | 0 (0.0%) |
| 12:00 PM to 3:59 PM | 17 (5.6%) | 52 (27.5%) |
| 4:00 PM to 11:59 PM | 5 (1.7%) | 11 (5.8%) |
| Total | 303 (100.0%) | 189 (100.0%) |
Housing Occupancy in Neffs
Occupancy by Ownership in Neffs
Of the total 482 dwellings in Neffs, owner-occupied units account for 452 (93.8%), while renter-occupied units make up 30 (6.2%).
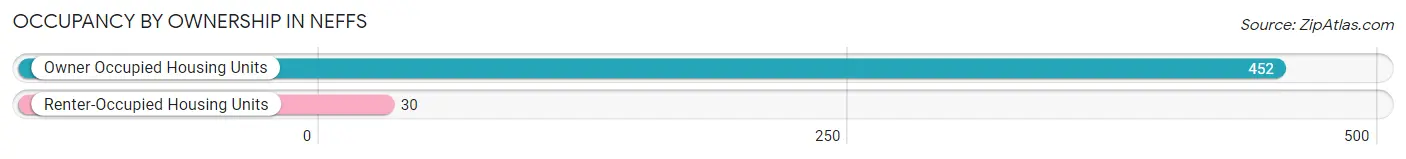
| Occupancy | # Housing Units | % Housing Units |
| Owner Occupied Housing Units | 452 | 93.8% |
| Renter-Occupied Housing Units | 30 | 6.2% |
| Total Occupied Housing Units | 482 | 100.0% |
Occupancy by Household Size in Neffs
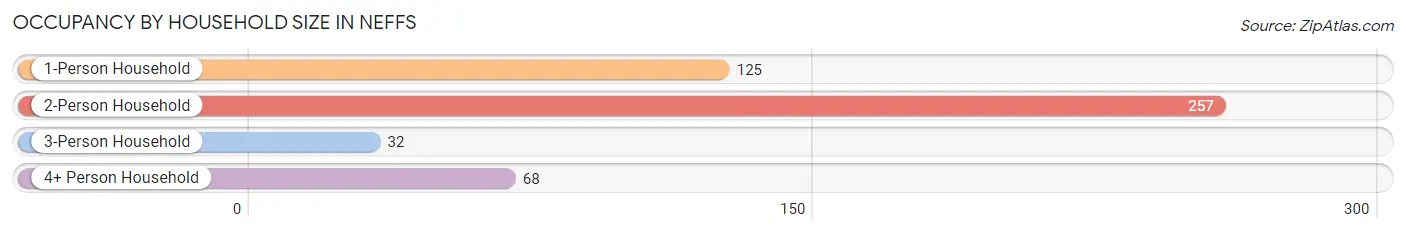
| Household Size | # Housing Units | % Housing Units |
| 1-Person Household | 125 | 25.9% |
| 2-Person Household | 257 | 53.3% |
| 3-Person Household | 32 | 6.6% |
| 4+ Person Household | 68 | 14.1% |
| Total Housing Units | 482 | 100.0% |
Occupancy by Ownership by Household Size in Neffs
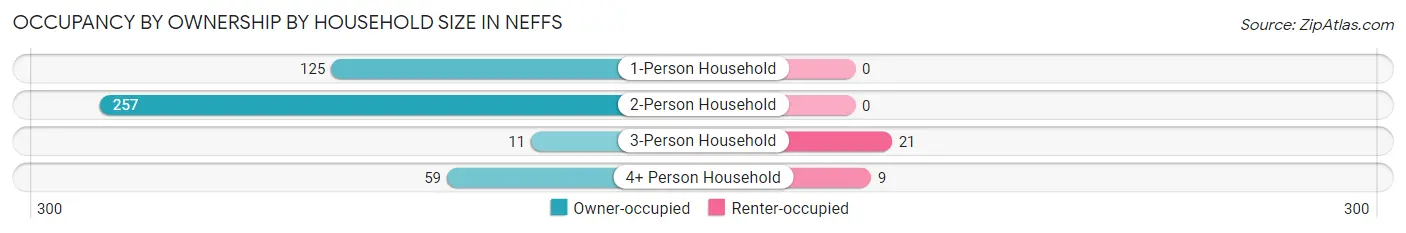
| Household Size | Owner-occupied | Renter-occupied |
| 1-Person Household | 125 (100.0%) | 0 (0.0%) |
| 2-Person Household | 257 (100.0%) | 0 (0.0%) |
| 3-Person Household | 11 (34.4%) | 21 (65.6%) |
| 4+ Person Household | 59 (86.8%) | 9 (13.2%) |
| Total Housing Units | 452 (93.8%) | 30 (6.2%) |
Occupancy by Educational Attainment in Neffs
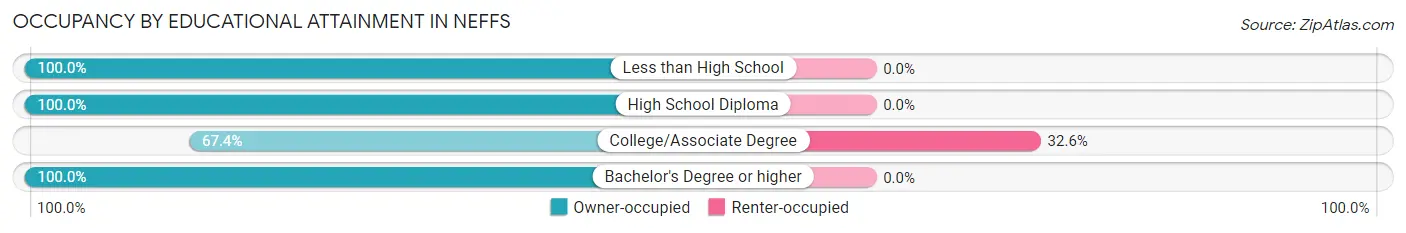
| Household Size | Owner-occupied | Renter-occupied |
| Less than High School | 182 (100.0%) | 0 (0.0%) |
| High School Diploma | 164 (100.0%) | 0 (0.0%) |
| College/Associate Degree | 62 (67.4%) | 30 (32.6%) |
| Bachelor's Degree or higher | 44 (100.0%) | 0 (0.0%) |
Occupancy by Age of Householder in Neffs
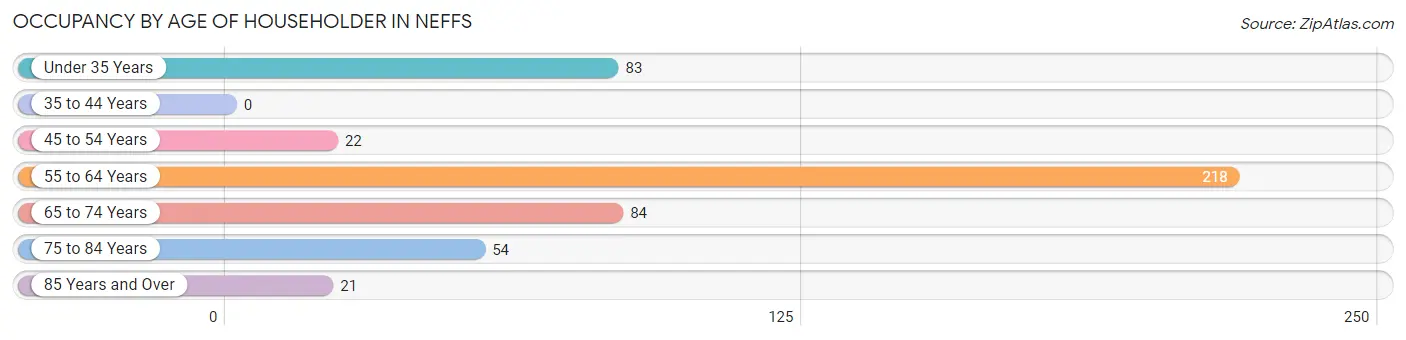
| Age Bracket | # Households | % Households |
| Under 35 Years | 83 | 17.2% |
| 35 to 44 Years | 0 | 0.0% |
| 45 to 54 Years | 22 | 4.6% |
| 55 to 64 Years | 218 | 45.2% |
| 65 to 74 Years | 84 | 17.4% |
| 75 to 84 Years | 54 | 11.2% |
| 85 Years and Over | 21 | 4.4% |
| Total | 482 | 100.0% |
Housing Finances in Neffs
Median Income by Occupancy in Neffs
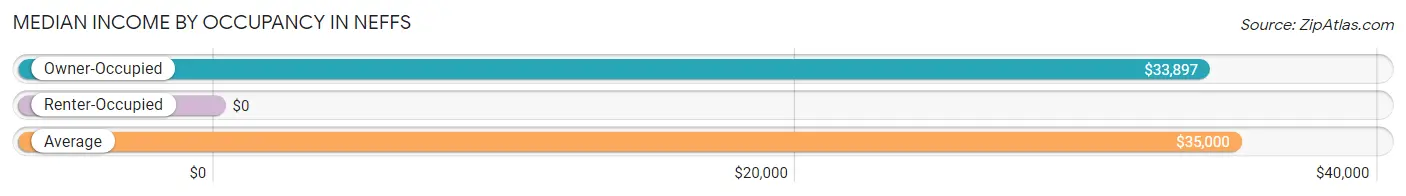
| Occupancy Type | # Households | Median Income |
| Owner-Occupied | 452 (93.8%) | $33,897 |
| Renter-Occupied | 30 (6.2%) | $0 |
| Average | 482 (100.0%) | $35,000 |
Occupancy by Householder Income Bracket in Neffs
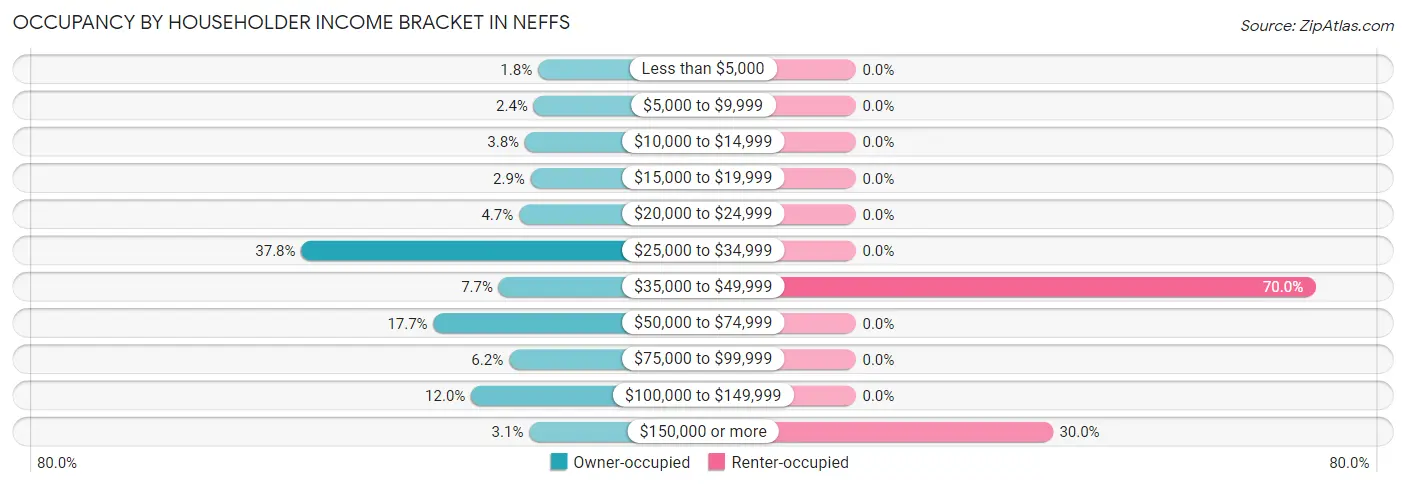
| Income Bracket | Owner-occupied | Renter-occupied |
| Less than $5,000 | 8 (1.8%) | 0 (0.0%) |
| $5,000 to $9,999 | 11 (2.4%) | 0 (0.0%) |
| $10,000 to $14,999 | 17 (3.8%) | 0 (0.0%) |
| $15,000 to $19,999 | 13 (2.9%) | 0 (0.0%) |
| $20,000 to $24,999 | 21 (4.6%) | 0 (0.0%) |
| $25,000 to $34,999 | 171 (37.8%) | 0 (0.0%) |
| $35,000 to $49,999 | 35 (7.7%) | 21 (70.0%) |
| $50,000 to $74,999 | 80 (17.7%) | 0 (0.0%) |
| $75,000 to $99,999 | 28 (6.2%) | 0 (0.0%) |
| $100,000 to $149,999 | 54 (11.9%) | 0 (0.0%) |
| $150,000 or more | 14 (3.1%) | 9 (30.0%) |
| Total | 452 (100.0%) | 30 (100.0%) |
Monthly Housing Cost Tiers in Neffs
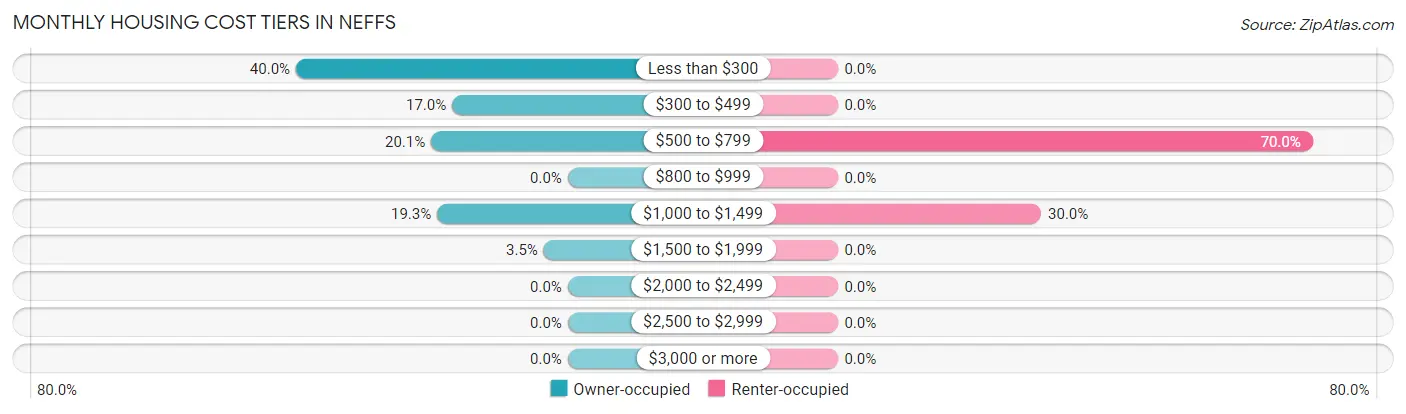
| Monthly Cost | Owner-occupied | Renter-occupied |
| Less than $300 | 181 (40.0%) | 0 (0.0%) |
| $300 to $499 | 77 (17.0%) | 0 (0.0%) |
| $500 to $799 | 91 (20.1%) | 21 (70.0%) |
| $800 to $999 | 0 (0.0%) | 0 (0.0%) |
| $1,000 to $1,499 | 87 (19.3%) | 9 (30.0%) |
| $1,500 to $1,999 | 16 (3.5%) | 0 (0.0%) |
| $2,000 to $2,499 | 0 (0.0%) | 0 (0.0%) |
| $2,500 to $2,999 | 0 (0.0%) | 0 (0.0%) |
| $3,000 or more | 0 (0.0%) | 0 (0.0%) |
| Total | 452 (100.0%) | 30 (100.0%) |
Physical Housing Characteristics in Neffs
Housing Structures in Neffs
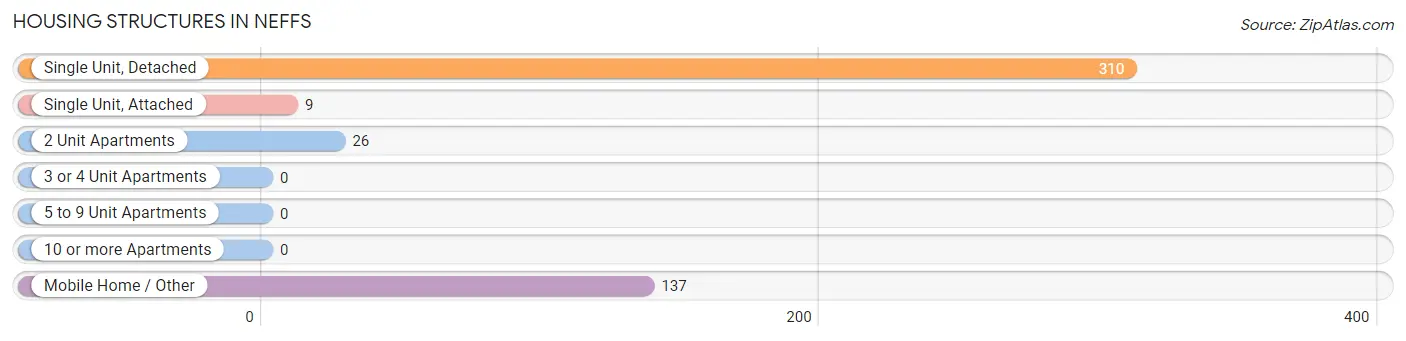
| Structure Type | # Housing Units | % Housing Units |
| Single Unit, Detached | 310 | 64.3% |
| Single Unit, Attached | 9 | 1.9% |
| 2 Unit Apartments | 26 | 5.4% |
| 3 or 4 Unit Apartments | 0 | 0.0% |
| 5 to 9 Unit Apartments | 0 | 0.0% |
| 10 or more Apartments | 0 | 0.0% |
| Mobile Home / Other | 137 | 28.4% |
| Total | 482 | 100.0% |
Housing Structures by Occupancy in Neffs
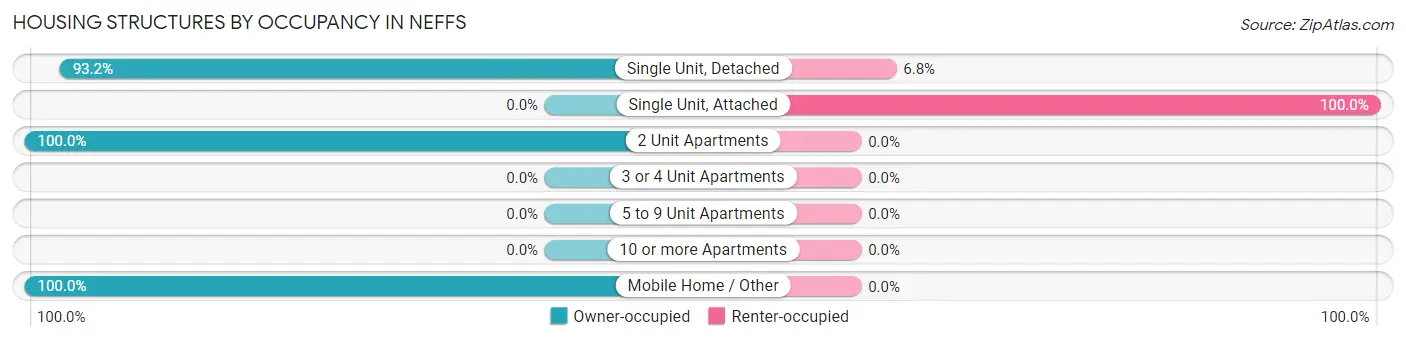
| Structure Type | Owner-occupied | Renter-occupied |
| Single Unit, Detached | 289 (93.2%) | 21 (6.8%) |
| Single Unit, Attached | 0 (0.0%) | 9 (100.0%) |
| 2 Unit Apartments | 26 (100.0%) | 0 (0.0%) |
| 3 or 4 Unit Apartments | 0 (0.0%) | 0 (0.0%) |
| 5 to 9 Unit Apartments | 0 (0.0%) | 0 (0.0%) |
| 10 or more Apartments | 0 (0.0%) | 0 (0.0%) |
| Mobile Home / Other | 137 (100.0%) | 0 (0.0%) |
| Total | 452 (93.8%) | 30 (6.2%) |
Housing Structures by Number of Rooms in Neffs
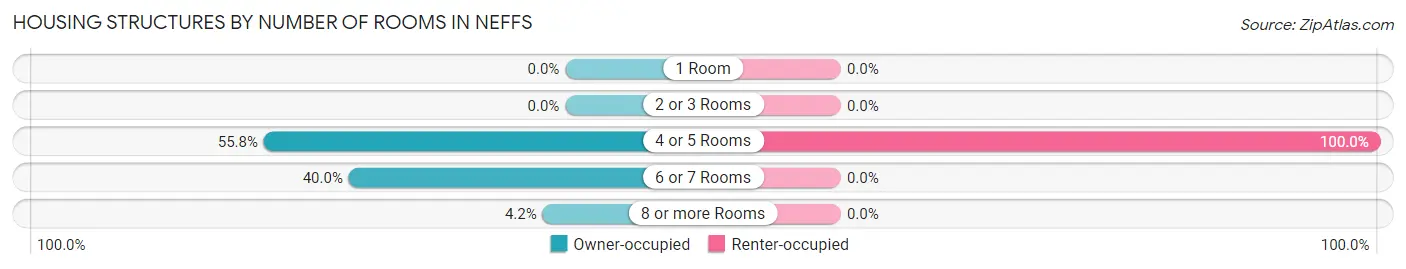
| Number of Rooms | Owner-occupied | Renter-occupied |
| 1 Room | 0 (0.0%) | 0 (0.0%) |
| 2 or 3 Rooms | 0 (0.0%) | 0 (0.0%) |
| 4 or 5 Rooms | 252 (55.7%) | 30 (100.0%) |
| 6 or 7 Rooms | 181 (40.0%) | 0 (0.0%) |
| 8 or more Rooms | 19 (4.2%) | 0 (0.0%) |
| Total | 452 (100.0%) | 30 (100.0%) |
Housing Structure by Heating Type in Neffs
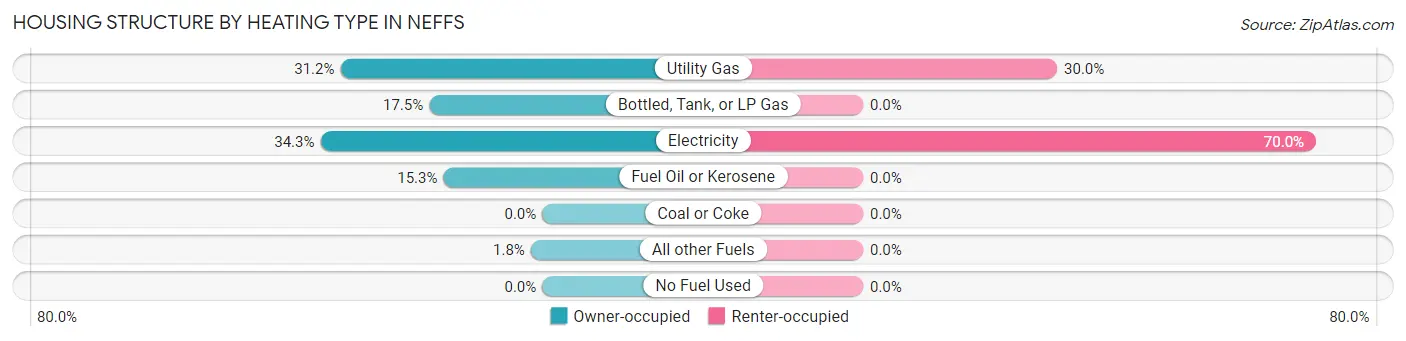
| Heating Type | Owner-occupied | Renter-occupied |
| Utility Gas | 141 (31.2%) | 9 (30.0%) |
| Bottled, Tank, or LP Gas | 79 (17.5%) | 0 (0.0%) |
| Electricity | 155 (34.3%) | 21 (70.0%) |
| Fuel Oil or Kerosene | 69 (15.3%) | 0 (0.0%) |
| Coal or Coke | 0 (0.0%) | 0 (0.0%) |
| All other Fuels | 8 (1.8%) | 0 (0.0%) |
| No Fuel Used | 0 (0.0%) | 0 (0.0%) |
| Total | 452 (100.0%) | 30 (100.0%) |
Household Vehicle Usage in Neffs
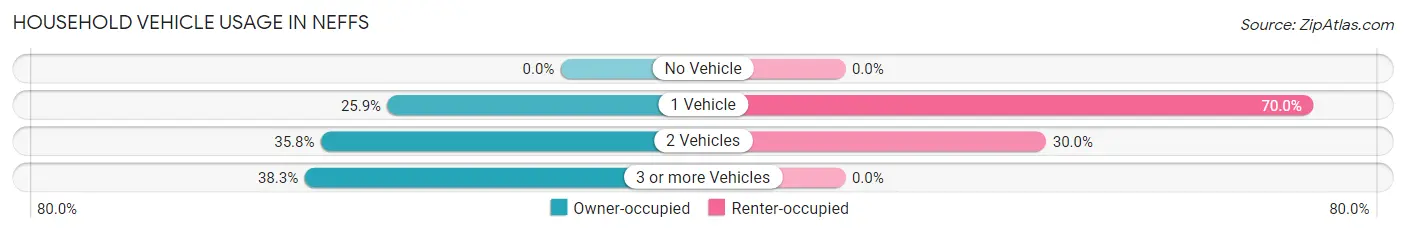
| Vehicles per Household | Owner-occupied | Renter-occupied |
| No Vehicle | 0 (0.0%) | 0 (0.0%) |
| 1 Vehicle | 117 (25.9%) | 21 (70.0%) |
| 2 Vehicles | 162 (35.8%) | 9 (30.0%) |
| 3 or more Vehicles | 173 (38.3%) | 0 (0.0%) |
| Total | 452 (100.0%) | 30 (100.0%) |
Real Estate & Mortgages in Neffs
Real Estate and Mortgage Overview in Neffs
| Characteristic | Without Mortgage | With Mortgage |
| Housing Units | 353 | 99 |
| Median Property Value | - | - |
| Median Household Income | $26,943 | $0 |
| Monthly Housing Costs | $299 | $0 |
| Real Estate Taxes | - | - |
Property Value by Mortgage Status in Neffs
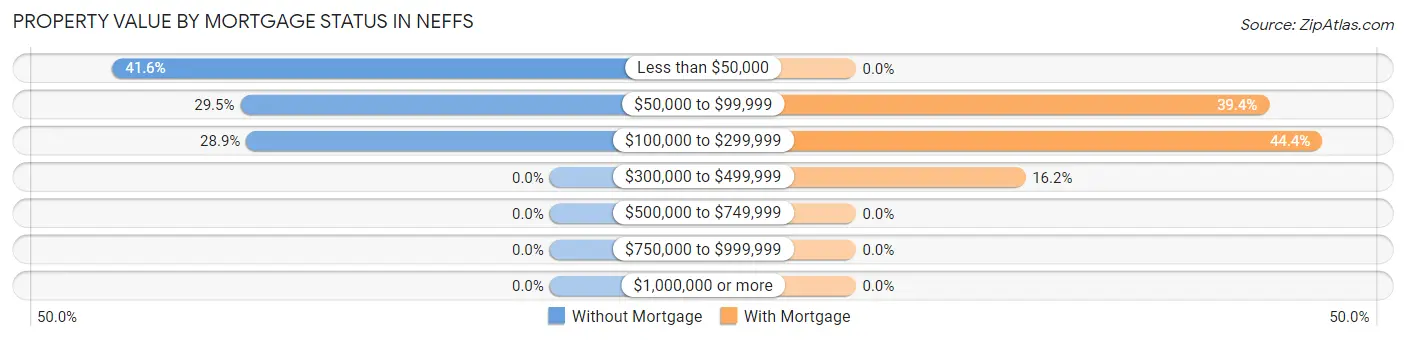
| Property Value | Without Mortgage | With Mortgage |
| Less than $50,000 | 147 (41.6%) | 0 (0.0%) |
| $50,000 to $99,999 | 104 (29.5%) | 39 (39.4%) |
| $100,000 to $299,999 | 102 (28.9%) | 44 (44.4%) |
| $300,000 to $499,999 | 0 (0.0%) | 16 (16.2%) |
| $500,000 to $749,999 | 0 (0.0%) | 0 (0.0%) |
| $750,000 to $999,999 | 0 (0.0%) | 0 (0.0%) |
| $1,000,000 or more | 0 (0.0%) | 0 (0.0%) |
| Total | 353 (100.0%) | 99 (100.0%) |
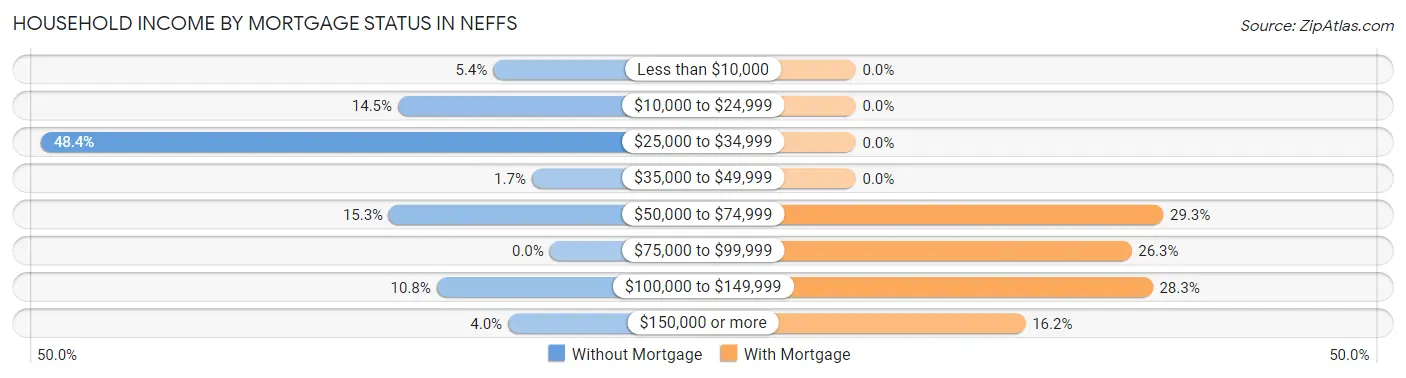
Household Income by Mortgage Status in Neffs
| Household Income | Without Mortgage | With Mortgage |
| Less than $10,000 | 19 (5.4%) | 0 (0.0%) |
| $10,000 to $24,999 | 51 (14.4%) | 0 (0.0%) |
| $25,000 to $34,999 | 171 (48.4%) | 0 (0.0%) |
| $35,000 to $49,999 | 6 (1.7%) | 0 (0.0%) |
| $50,000 to $74,999 | 54 (15.3%) | 29 (29.3%) |
| $75,000 to $99,999 | 0 (0.0%) | 26 (26.3%) |
| $100,000 to $149,999 | 38 (10.8%) | 28 (28.3%) |
| $150,000 or more | 14 (4.0%) | 16 (16.2%) |
| Total | 353 (100.0%) | 99 (100.0%) |
Property Value to Household Income Ratio in Neffs
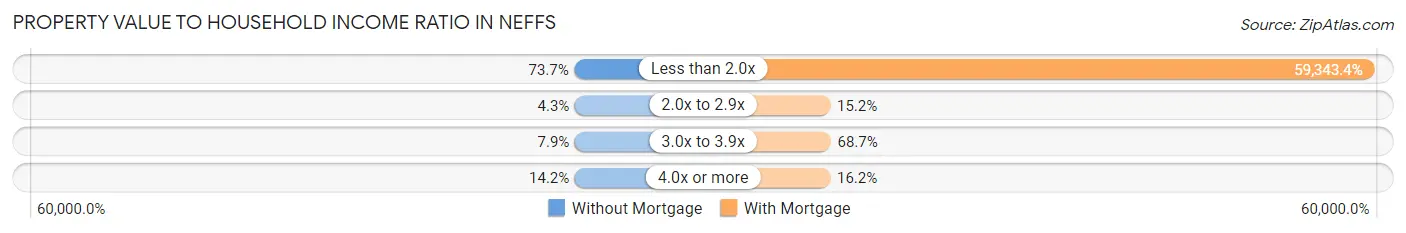
| Value-to-Income Ratio | Without Mortgage | With Mortgage |
| Less than 2.0x | 260 (73.7%) | 58,750 (59,343.4%) |
| 2.0x to 2.9x | 15 (4.3%) | 15 (15.1%) |
| 3.0x to 3.9x | 28 (7.9%) | 68 (68.7%) |
| 4.0x or more | 50 (14.2%) | 16 (16.2%) |
| Total | 353 (100.0%) | 99 (100.0%) |
Real Estate Taxes by Mortgage Status in Neffs
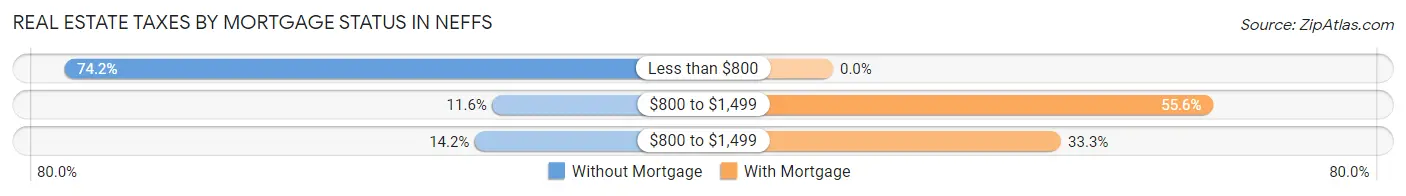
| Property Taxes | Without Mortgage | With Mortgage |
| Less than $800 | 262 (74.2%) | 0 (0.0%) |
| $800 to $1,499 | 41 (11.6%) | 55 (55.6%) |
| $800 to $1,499 | 50 (14.2%) | 33 (33.3%) |
| Total | 353 (100.0%) | 99 (100.0%) |
Health & Disability in Neffs
Health Insurance Coverage by Age in Neffs
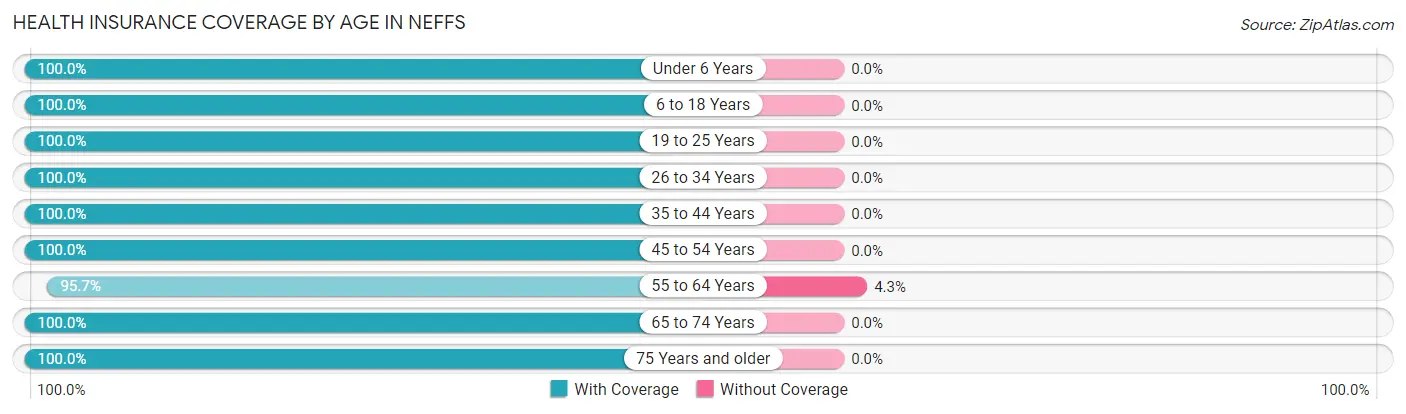
| Age Bracket | With Coverage | Without Coverage |
| Under 6 Years | 81 (100.0%) | 0 (0.0%) |
| 6 to 18 Years | 75 (100.0%) | 0 (0.0%) |
| 19 to 25 Years | 118 (100.0%) | 0 (0.0%) |
| 26 to 34 Years | 70 (100.0%) | 0 (0.0%) |
| 35 to 44 Years | 31 (100.0%) | 0 (0.0%) |
| 45 to 54 Years | 162 (100.0%) | 0 (0.0%) |
| 55 to 64 Years | 336 (95.7%) | 15 (4.3%) |
| 65 to 74 Years | 106 (100.0%) | 0 (0.0%) |
| 75 Years and older | 99 (100.0%) | 0 (0.0%) |
| Total | 1,078 (98.6%) | 15 (1.4%) |
Health Insurance Coverage by Citizenship Status in Neffs
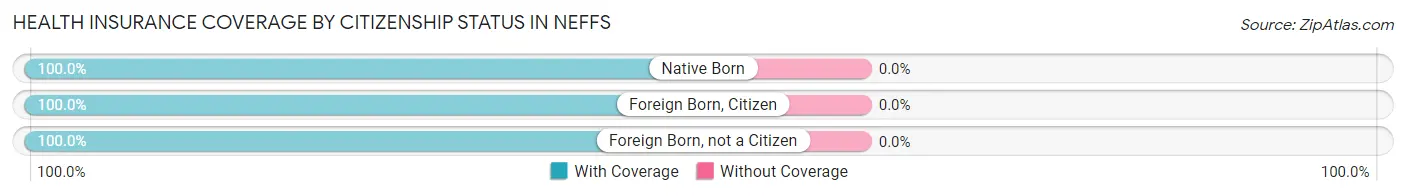
| Citizenship Status | With Coverage | Without Coverage |
| Native Born | 81 (100.0%) | 0 (0.0%) |
| Foreign Born, Citizen | 75 (100.0%) | 0 (0.0%) |
| Foreign Born, not a Citizen | 118 (100.0%) | 0 (0.0%) |
Health Insurance Coverage by Household Income in Neffs
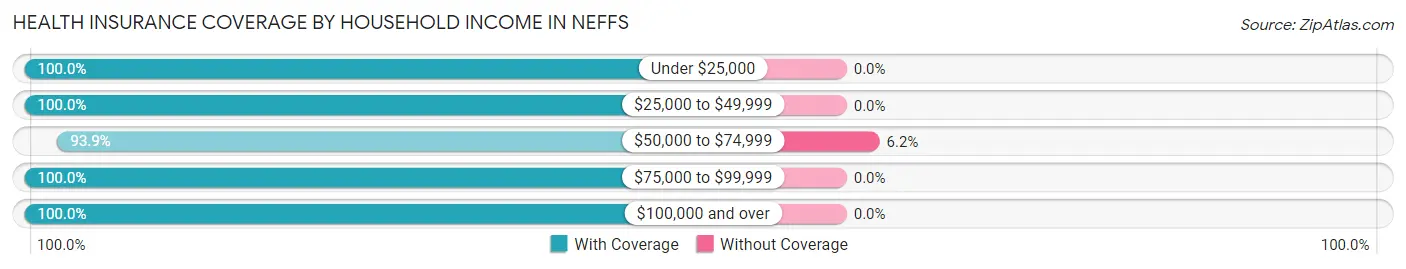
| Household Income | With Coverage | Without Coverage |
| Under $25,000 | 82 (100.0%) | 0 (0.0%) |
| $25,000 to $49,999 | 449 (100.0%) | 0 (0.0%) |
| $50,000 to $74,999 | 229 (93.9%) | 15 (6.1%) |
| $75,000 to $99,999 | 73 (100.0%) | 0 (0.0%) |
| $100,000 and over | 245 (100.0%) | 0 (0.0%) |
Public vs Private Health Insurance Coverage by Age in Neffs
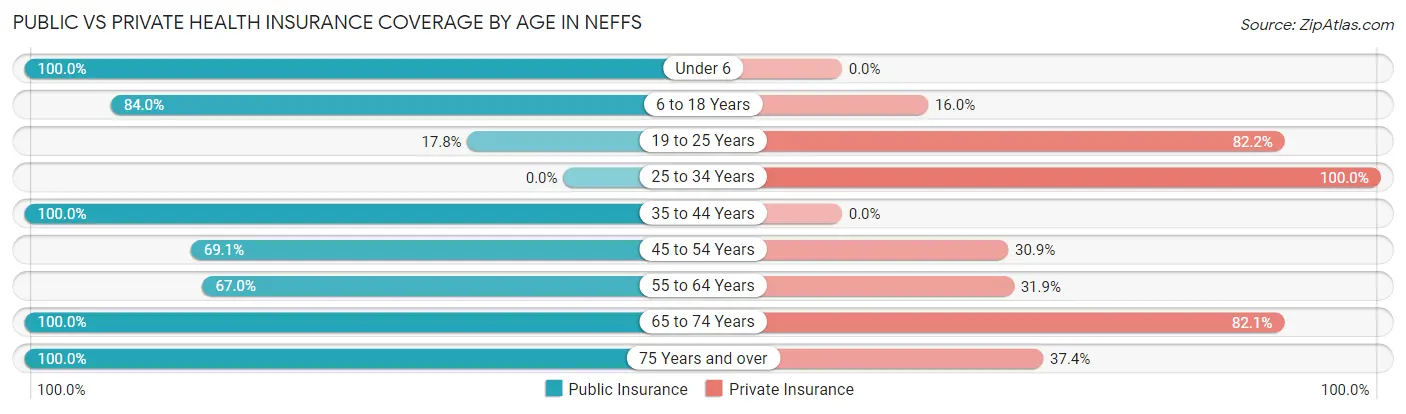
| Age Bracket | Public Insurance | Private Insurance |
| Under 6 | 81 (100.0%) | 0 (0.0%) |
| 6 to 18 Years | 63 (84.0%) | 12 (16.0%) |
| 19 to 25 Years | 21 (17.8%) | 97 (82.2%) |
| 25 to 34 Years | 0 (0.0%) | 70 (100.0%) |
| 35 to 44 Years | 31 (100.0%) | 0 (0.0%) |
| 45 to 54 Years | 112 (69.1%) | 50 (30.9%) |
| 55 to 64 Years | 235 (66.9%) | 112 (31.9%) |
| 65 to 74 Years | 106 (100.0%) | 87 (82.1%) |
| 75 Years and over | 99 (100.0%) | 37 (37.4%) |
| Total | 748 (68.4%) | 465 (42.5%) |
Disability Status by Sex by Age in Neffs
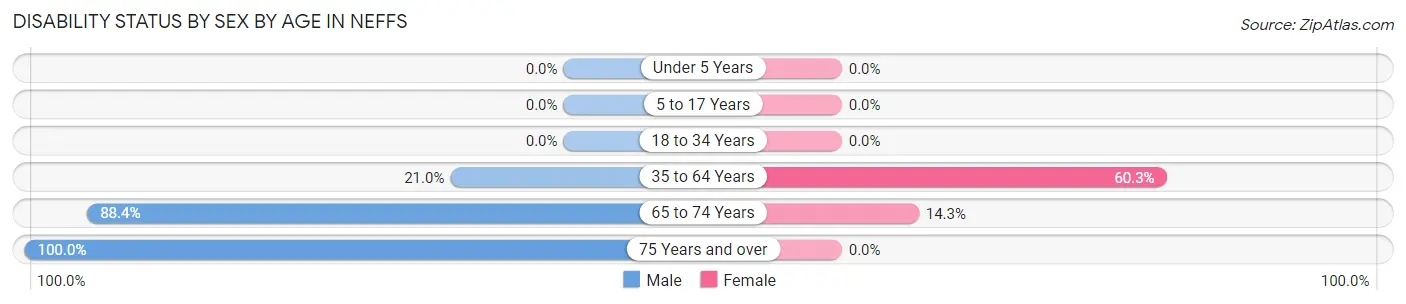
| Age Bracket | Male | Female |
| Under 5 Years | 0 (0.0%) | 0 (0.0%) |
| 5 to 17 Years | 0 (0.0%) | 0 (0.0%) |
| 18 to 34 Years | 0 (0.0%) | 0 (0.0%) |
| 35 to 64 Years | 63 (21.0%) | 147 (60.3%) |
| 65 to 74 Years | 38 (88.4%) | 9 (14.3%) |
| 75 Years and over | 45 (100.0%) | 0 (0.0%) |
Disability Class by Sex by Age in Neffs
Disability Class: Hearing Difficulty
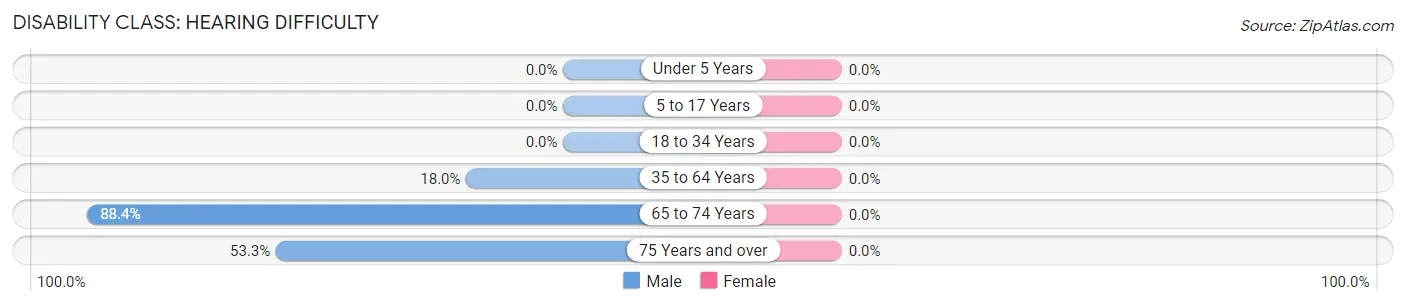
| Age Bracket | Male | Female |
| Under 5 Years | 0 (0.0%) | 0 (0.0%) |
| 5 to 17 Years | 0 (0.0%) | 0 (0.0%) |
| 18 to 34 Years | 0 (0.0%) | 0 (0.0%) |
| 35 to 64 Years | 54 (18.0%) | 0 (0.0%) |
| 65 to 74 Years | 38 (88.4%) | 0 (0.0%) |
| 75 Years and over | 24 (53.3%) | 0 (0.0%) |
Disability Class: Vision Difficulty
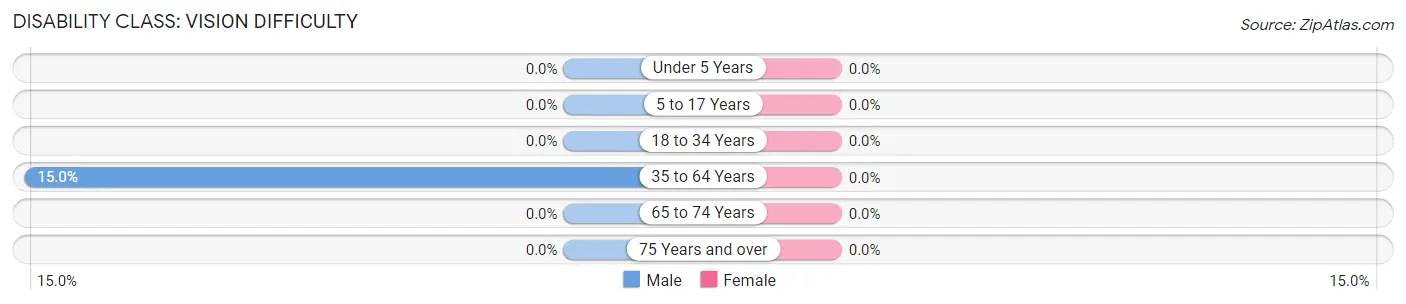
| Age Bracket | Male | Female |
| Under 5 Years | 0 (0.0%) | 0 (0.0%) |
| 5 to 17 Years | 0 (0.0%) | 0 (0.0%) |
| 18 to 34 Years | 0 (0.0%) | 0 (0.0%) |
| 35 to 64 Years | 45 (15.0%) | 0 (0.0%) |
| 65 to 74 Years | 0 (0.0%) | 0 (0.0%) |
| 75 Years and over | 0 (0.0%) | 0 (0.0%) |
Disability Class: Cognitive Difficulty
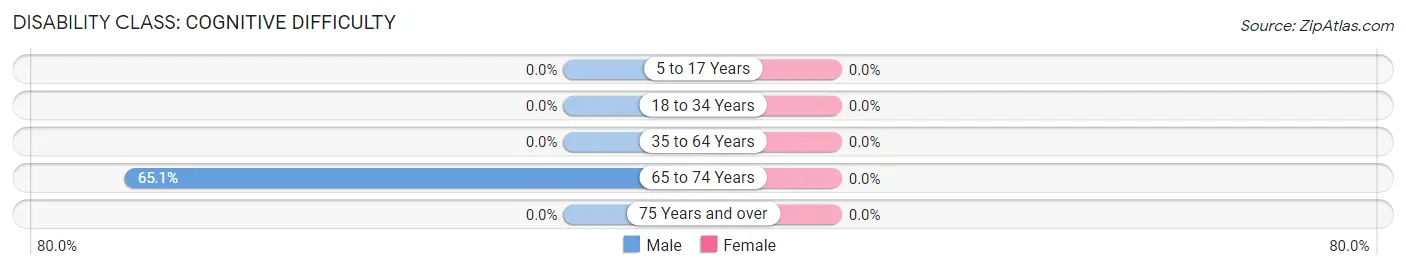
| Age Bracket | Male | Female |
| 5 to 17 Years | 0 (0.0%) | 0 (0.0%) |
| 18 to 34 Years | 0 (0.0%) | 0 (0.0%) |
| 35 to 64 Years | 0 (0.0%) | 0 (0.0%) |
| 65 to 74 Years | 28 (65.1%) | 0 (0.0%) |
| 75 Years and over | 0 (0.0%) | 0 (0.0%) |
Disability Class: Ambulatory Difficulty
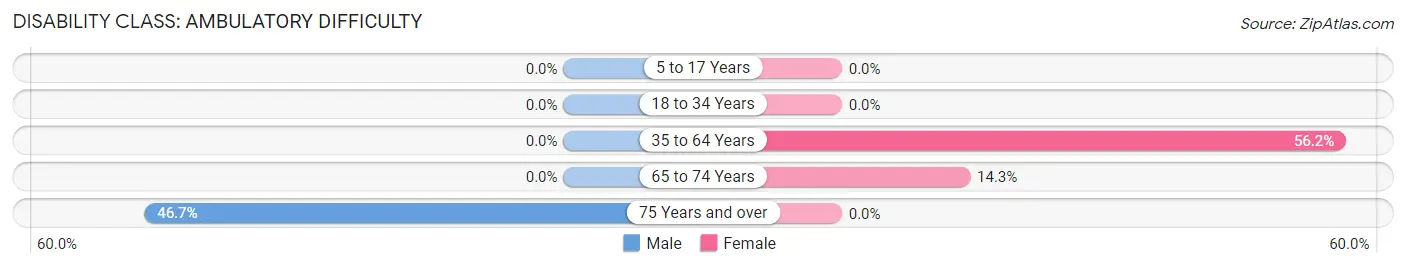
| Age Bracket | Male | Female |
| 5 to 17 Years | 0 (0.0%) | 0 (0.0%) |
| 18 to 34 Years | 0 (0.0%) | 0 (0.0%) |
| 35 to 64 Years | 0 (0.0%) | 137 (56.1%) |
| 65 to 74 Years | 0 (0.0%) | 9 (14.3%) |
| 75 Years and over | 21 (46.7%) | 0 (0.0%) |
Disability Class: Self-Care Difficulty
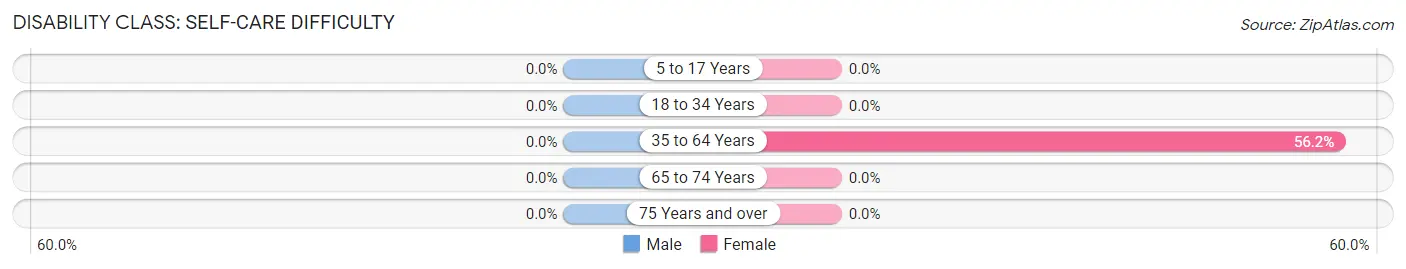
| Age Bracket | Male | Female |
| 5 to 17 Years | 0 (0.0%) | 0 (0.0%) |
| 18 to 34 Years | 0 (0.0%) | 0 (0.0%) |
| 35 to 64 Years | 0 (0.0%) | 137 (56.1%) |
| 65 to 74 Years | 0 (0.0%) | 0 (0.0%) |
| 75 Years and over | 0 (0.0%) | 0 (0.0%) |
Technology Access in Neffs
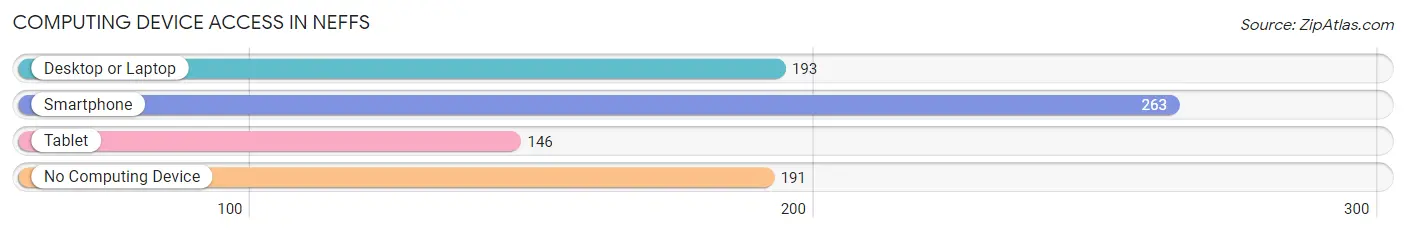
Computing Device Access in Neffs
| Device Type | # Households | % Households |
| Desktop or Laptop | 193 | 40.0% |
| Smartphone | 263 | 54.6% |
| Tablet | 146 | 30.3% |
| No Computing Device | 191 | 39.6% |
| Total | 482 | 100.0% |
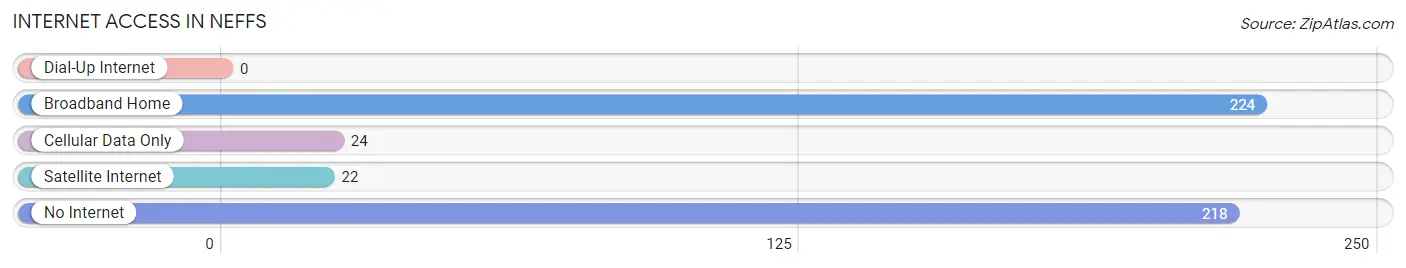
Internet Access in Neffs
| Internet Type | # Households | % Households |
| Dial-Up Internet | 0 | 0.0% |
| Broadband Home | 224 | 46.5% |
| Cellular Data Only | 24 | 5.0% |
| Satellite Internet | 22 | 4.6% |
| No Internet | 218 | 45.2% |
| Total | 482 | 100.0% |
Neffs Summary
Neffs is a small unincorporated community located in Belmont County, Ohio. It is situated in the northern part of the county, approximately five miles south of the city of St. Clairsville. Neffs is part of the Wheeling, West Virginia metropolitan area.
History
Neffs was founded in 1817 by John Neff, a German immigrant who had settled in the area. Neffs was originally known as Neffstown, and was the first settlement in Belmont County. The town was laid out in 1818, and the first post office was established in 1820. Neffs was incorporated as a village in 1837, and the first school was built in 1845.
Geography
Neffs is located at 39°51'25"N 81°14'45"W (39.856944, -81.245833). It is situated in the northern part of Belmont County, approximately five miles south of the city of St. Clairsville. Neffs is part of the Wheeling, West Virginia metropolitan area.
The terrain around Neffs is mostly flat, with some rolling hills. The area is heavily forested, with a mix of deciduous and coniferous trees. The climate is humid continental, with cold winters and hot, humid summers.
Economy
The economy of Neffs is largely based on agriculture. The area is home to several farms, which produce a variety of crops, including corn, soybeans, wheat, and hay. There are also several small businesses in the area, including a gas station, a grocery store, and a hardware store.
Demographics
As of the 2010 census, the population of Neffs was 1,093. The racial makeup of the town was 97.3% White, 0.7% African American, 0.2% Native American, 0.2% Asian, and 1.6% from other races. The median household income was $41,250, and the median family income was $48,750.
The town is served by the Belmont County School District, which includes Neffs Elementary School and Neffs Middle School. The nearest high school is St. Clairsville High School, located five miles away in St. Clairsville.
Common Questions
What is Per Capita Income in Neffs?
Per Capita income in Neffs is $25,031.
What is the Median Family Income in Neffs?
Median Family Income in Neffs is $39,464.
What is the Median Household income in Neffs?
Median Household Income in Neffs is $35,000.
What is Income or Wage Gap in Neffs?
Income or Wage Gap in Neffs is 21.4%.
Women in Neffs earn 78.6 cents for every dollar earned by a man.
What is Inequality or Gini Index in Neffs?
Inequality or Gini Index in Neffs is 0.40.
What is the Total Population of Neffs?
Total Population of Neffs is 1,093.
What is the Total Male Population of Neffs?
Total Male Population of Neffs is 551.
What is the Total Female Population of Neffs?
Total Female Population of Neffs is 542.
What is the Ratio of Males per 100 Females in Neffs?
There are 101.66 Males per 100 Females in Neffs.
What is the Ratio of Females per 100 Males in Neffs?
There are 98.37 Females per 100 Males in Neffs.
What is the Median Population Age in Neffs?
Median Population Age in Neffs is 55.8 Years.
What is the Average Family Size in Neffs
Average Family Size in Neffs is 2.6 People.
What is the Average Household Size in Neffs
Average Household Size in Neffs is 2.3 People.
How Large is the Labor Force in Neffs?
There are 513 People in the Labor Forcein in Neffs.
What is the Percentage of People in the Labor Force in Neffs?
54.6% of People are in the Labor Force in Neffs.
What is the Unemployment Rate in Neffs?
Unemployment Rate in Neffs is 4.1%.