Tonawanda, NY Map & Demographics
Tonawanda Map
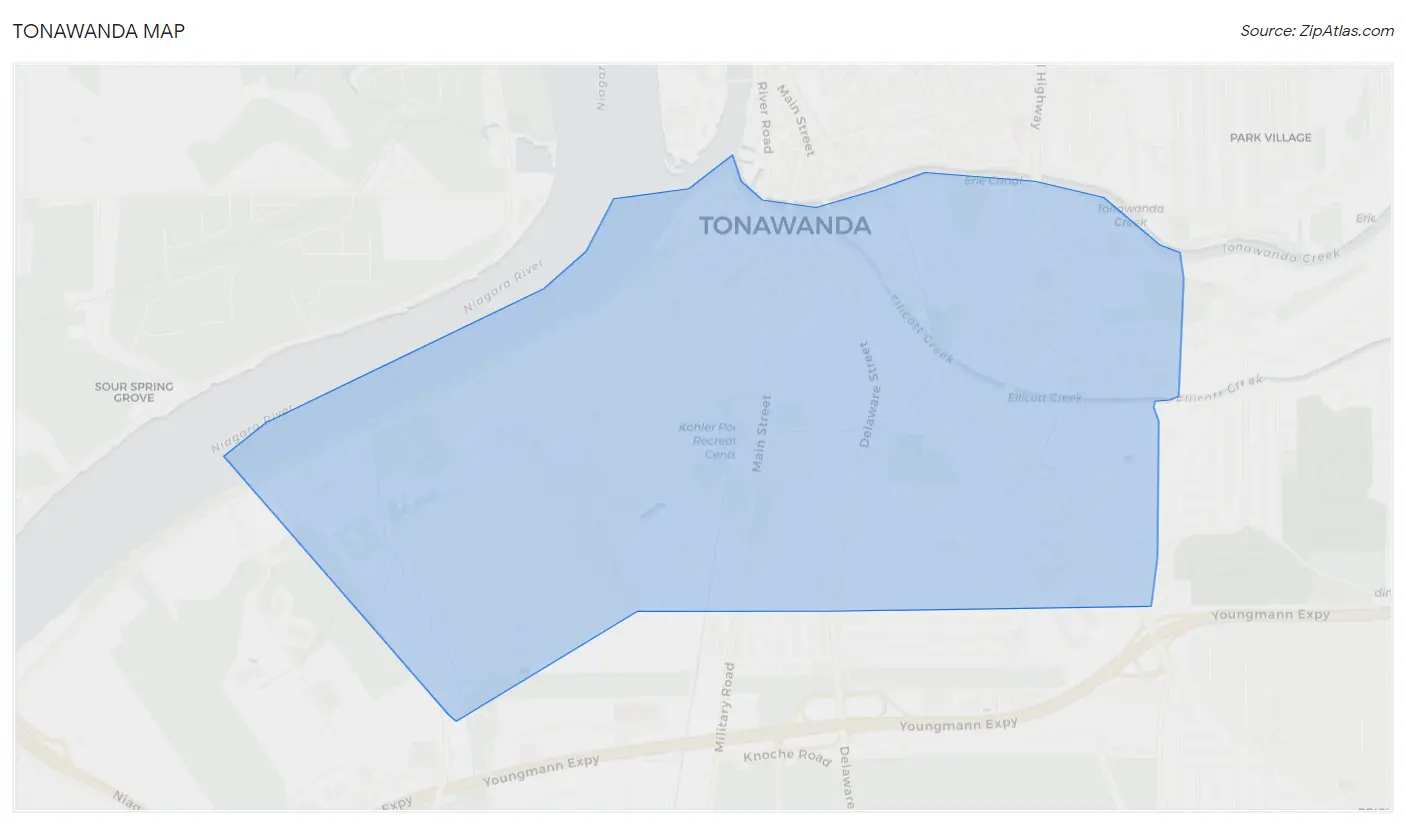
Tonawanda Overview
$41,343
PER CAPITA INCOME
$94,315
AVG FAMILY INCOME
$74,313
AVG HOUSEHOLD INCOME
12.8%
WAGE / INCOME GAP [ % ]
87.2¢/ $1
WAGE / INCOME GAP [ $ ]
$9,919
FAMILY INCOME DEFICIT
0.41
INEQUALITY / GINI INDEX
57,210
TOTAL POPULATION
27,834
MALE POPULATION
29,376
FEMALE POPULATION
94.75
MALES / 100 FEMALES
105.54
FEMALES / 100 MALES
42.9
MEDIAN AGE
2.8
AVG FAMILY SIZE
2.1
AVG HOUSEHOLD SIZE
32,100
LABOR FORCE [ PEOPLE ]
65.5%
PERCENT IN LABOR FORCE
3.9%
UNEMPLOYMENT RATE
Tonawanda Zip Codes
Tonawanda Area Codes
Income in Tonawanda
Income Overview in Tonawanda
Per Capita Income in Tonawanda is $41,343, while median incomes of families and households are $94,315 and $74,313 respectively.
| Characteristic | Number | Measure |
| Per Capita Income | 57,210 | $41,343 |
| Median Family Income | 14,751 | $94,315 |
| Mean Family Income | 14,751 | $110,487 |
| Median Household Income | 26,469 | $74,313 |
| Mean Household Income | 26,469 | $88,881 |
| Income Deficit | 14,751 | $9,919 |
| Wage / Income Gap (%) | 57,210 | 12.81% |
| Wage / Income Gap ($) | 57,210 | 87.19¢ per $1 |
| Gini / Inequality Index | 57,210 | 0.41 |
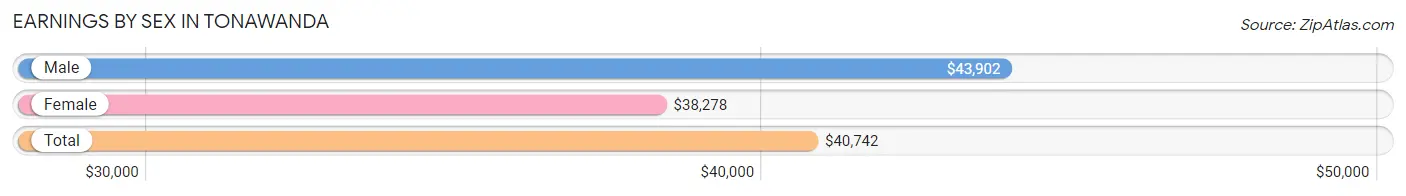
Earnings by Sex in Tonawanda
Average Earnings in Tonawanda are $40,742, $43,902 for men and $38,278 for women, a difference of 12.8%.
| Sex | Number | Average Earnings |
| Male | 17,311 (51.7%) | $43,902 |
| Female | 16,163 (48.3%) | $38,278 |
| Total | 33,474 (100.0%) | $40,742 |
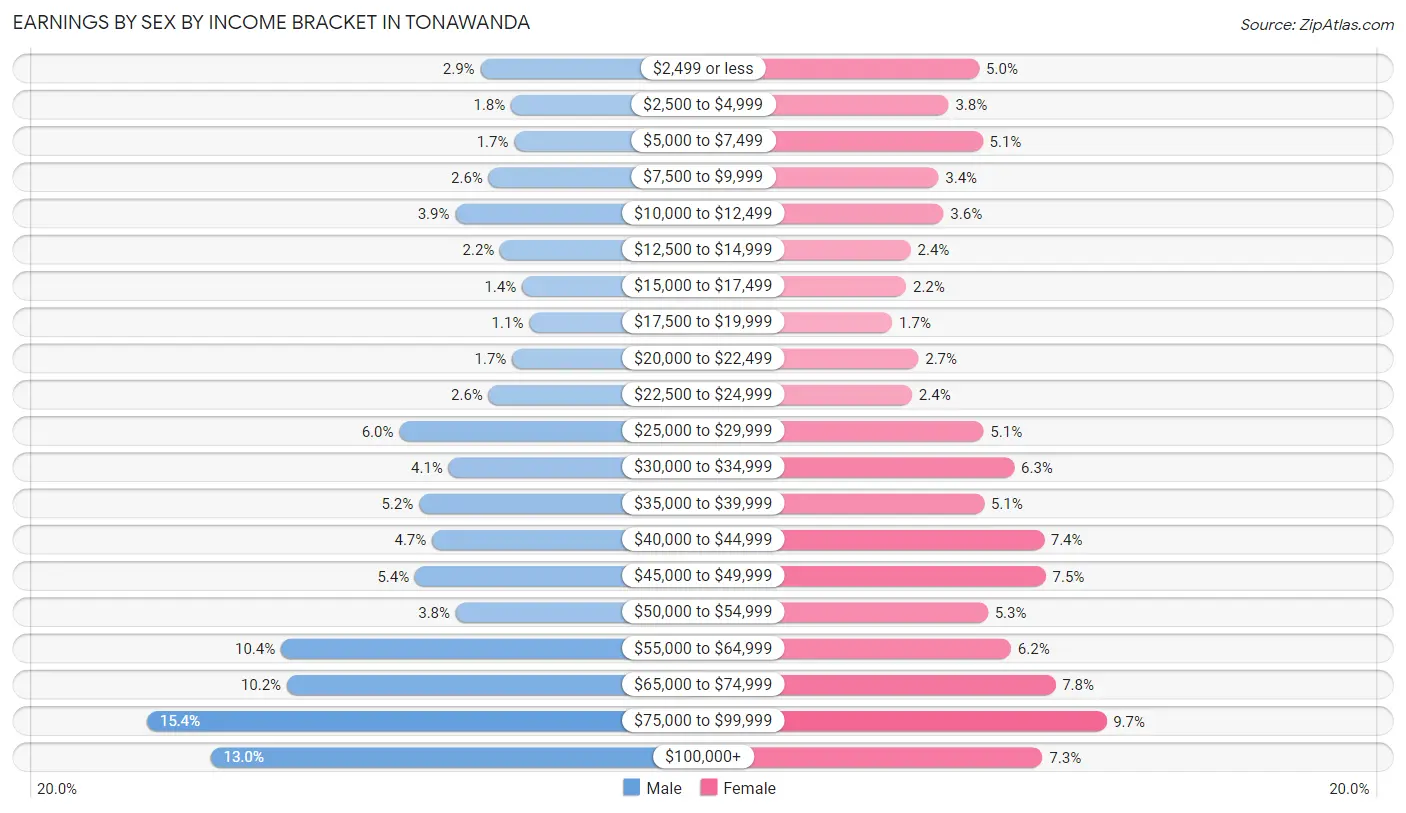
Earnings by Sex by Income Bracket in Tonawanda
The most common earnings brackets in Tonawanda are $75,000 to $99,999 for men (2,669 | 15.4%) and $75,000 to $99,999 for women (1,571 | 9.7%).
| Income | Male | Female |
| $2,499 or less | 505 (2.9%) | 802 (5.0%) |
| $2,500 to $4,999 | 307 (1.8%) | 616 (3.8%) |
| $5,000 to $7,499 | 285 (1.7%) | 823 (5.1%) |
| $7,500 to $9,999 | 451 (2.6%) | 555 (3.4%) |
| $10,000 to $12,499 | 669 (3.9%) | 585 (3.6%) |
| $12,500 to $14,999 | 377 (2.2%) | 387 (2.4%) |
| $15,000 to $17,499 | 236 (1.4%) | 359 (2.2%) |
| $17,500 to $19,999 | 188 (1.1%) | 274 (1.7%) |
| $20,000 to $22,499 | 299 (1.7%) | 433 (2.7%) |
| $22,500 to $24,999 | 452 (2.6%) | 395 (2.4%) |
| $25,000 to $29,999 | 1,031 (6.0%) | 828 (5.1%) |
| $30,000 to $34,999 | 711 (4.1%) | 1,014 (6.3%) |
| $35,000 to $39,999 | 903 (5.2%) | 830 (5.1%) |
| $40,000 to $44,999 | 819 (4.7%) | 1,193 (7.4%) |
| $45,000 to $49,999 | 930 (5.4%) | 1,204 (7.4%) |
| $50,000 to $54,999 | 664 (3.8%) | 853 (5.3%) |
| $55,000 to $64,999 | 1,798 (10.4%) | 994 (6.1%) |
| $65,000 to $74,999 | 1,761 (10.2%) | 1,262 (7.8%) |
| $75,000 to $99,999 | 2,669 (15.4%) | 1,571 (9.7%) |
| $100,000+ | 2,256 (13.0%) | 1,185 (7.3%) |
| Total | 17,311 (100.0%) | 16,163 (100.0%) |
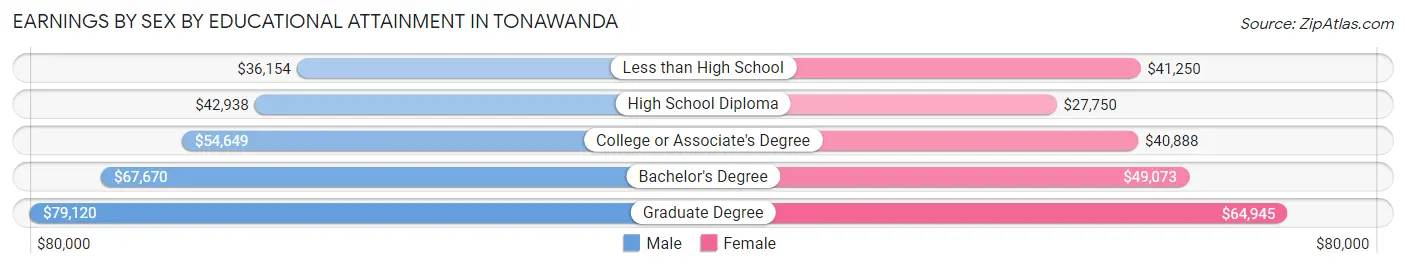
Earnings by Sex by Educational Attainment in Tonawanda
Average earnings in Tonawanda are $58,214 for men and $43,628 for women, a difference of 25.1%. Men with an educational attainment of graduate degree enjoy the highest average annual earnings of $79,120, while those with less than high school education earn the least with $36,154. Women with an educational attainment of graduate degree earn the most with the average annual earnings of $64,945, while those with high school diploma education have the smallest earnings of $27,750.
| Educational Attainment | Male Income | Female Income |
| Less than High School | $36,154 | $41,250 |
| High School Diploma | $42,938 | $27,750 |
| College or Associate's Degree | $54,649 | $40,888 |
| Bachelor's Degree | $67,670 | $49,073 |
| Graduate Degree | $79,120 | $64,945 |
| Total | $58,214 | $43,628 |
Family Income in Tonawanda
Family Income Brackets in Tonawanda
According to the Tonawanda family income data, there are 3,821 families falling into the $100,000 to $149,999 income range, which is the most common income bracket and makes up 25.9% of all families. Conversely, the $10,000 to $14,999 income bracket is the least frequent group with only 192 families (1.3%) belonging to this category.
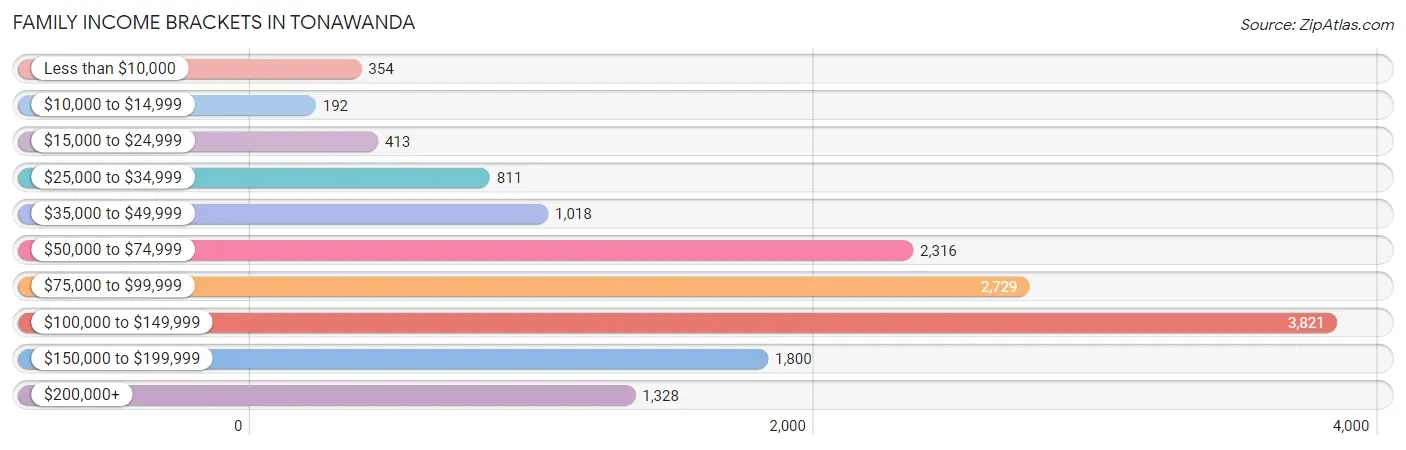
| Income Bracket | # Families | % Families |
| Less than $10,000 | 354 | 2.4% |
| $10,000 to $14,999 | 192 | 1.3% |
| $15,000 to $24,999 | 413 | 2.8% |
| $25,000 to $34,999 | 811 | 5.5% |
| $35,000 to $49,999 | 1,018 | 6.9% |
| $50,000 to $74,999 | 2,316 | 15.7% |
| $75,000 to $99,999 | 2,729 | 18.5% |
| $100,000 to $149,999 | 3,821 | 25.9% |
| $150,000 to $199,999 | 1,800 | 12.2% |
| $200,000+ | 1,328 | 9.0% |
Family Income by Famaliy Size in Tonawanda
4-person families (2,815 | 19.1%) account for the highest median family income in Tonawanda with $128,950 per family, while 2-person families (7,858 | 53.3%) have the highest median income of $40,925 per family member.
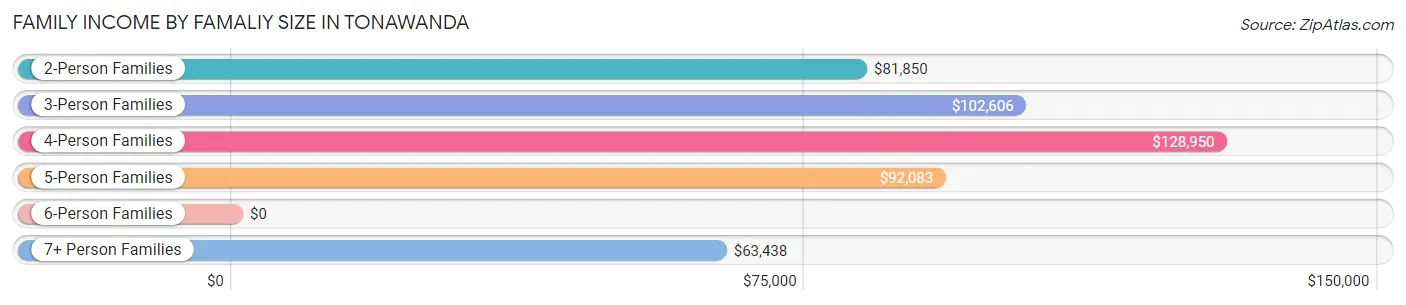
| Income Bracket | # Families | Median Income |
| 2-Person Families | 7,858 (53.3%) | $81,850 |
| 3-Person Families | 2,959 (20.1%) | $102,606 |
| 4-Person Families | 2,815 (19.1%) | $128,950 |
| 5-Person Families | 704 (4.8%) | $92,083 |
| 6-Person Families | 263 (1.8%) | $0 |
| 7+ Person Families | 152 (1.0%) | $63,438 |
| Total | 14,751 (100.0%) | $94,315 |
Family Income by Number of Earners in Tonawanda
The median family income in Tonawanda is $94,315, with families comprising 3+ earners (2,077) having the highest median family income of $164,261, while families with no earners (2,315) have the lowest median family income of $53,266, accounting for 14.1% and 15.7% of families, respectively.
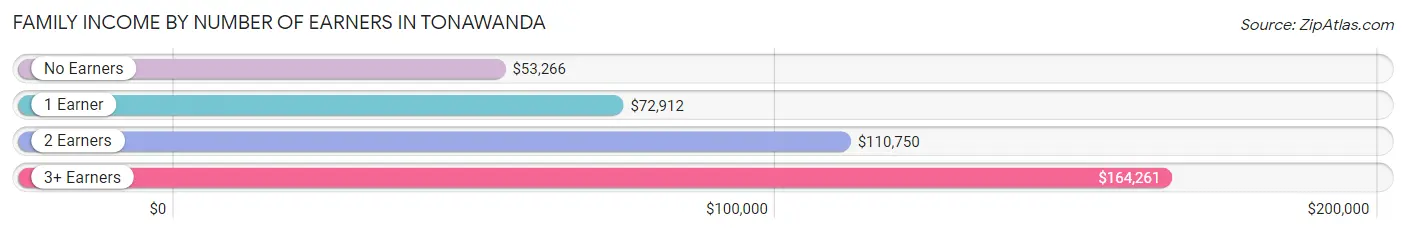
| Number of Earners | # Families | Median Income |
| No Earners | 2,315 (15.7%) | $53,266 |
| 1 Earner | 4,071 (27.6%) | $72,912 |
| 2 Earners | 6,288 (42.6%) | $110,750 |
| 3+ Earners | 2,077 (14.1%) | $164,261 |
| Total | 14,751 (100.0%) | $94,315 |
Household Income in Tonawanda
Household Income Brackets in Tonawanda
With 5,347 households falling in the category, the $100,000 to $149,999 income range is the most frequent in Tonawanda, accounting for 20.2% of all households. In contrast, only 794 households (3.0%) fall into the $10,000 to $14,999 income bracket, making it the least populous group.
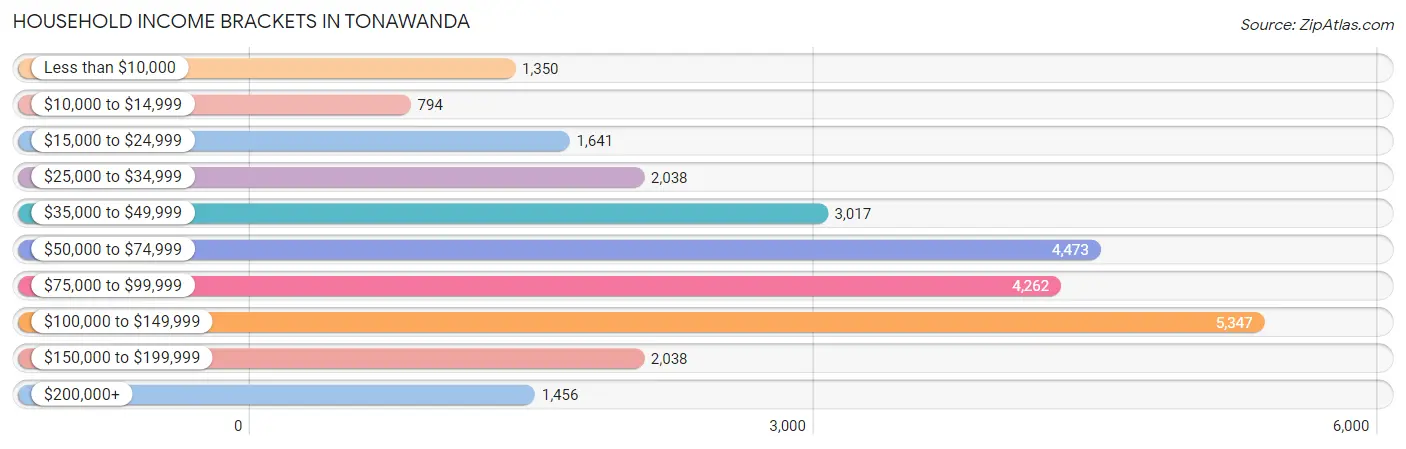
| Income Bracket | # Households | % Households |
| Less than $10,000 | 1,350 | 5.1% |
| $10,000 to $14,999 | 794 | 3.0% |
| $15,000 to $24,999 | 1,641 | 6.2% |
| $25,000 to $34,999 | 2,038 | 7.7% |
| $35,000 to $49,999 | 3,017 | 11.4% |
| $50,000 to $74,999 | 4,473 | 16.9% |
| $75,000 to $99,999 | 4,262 | 16.1% |
| $100,000 to $149,999 | 5,347 | 20.2% |
| $150,000 to $199,999 | 2,038 | 7.7% |
| $200,000+ | 1,456 | 5.5% |
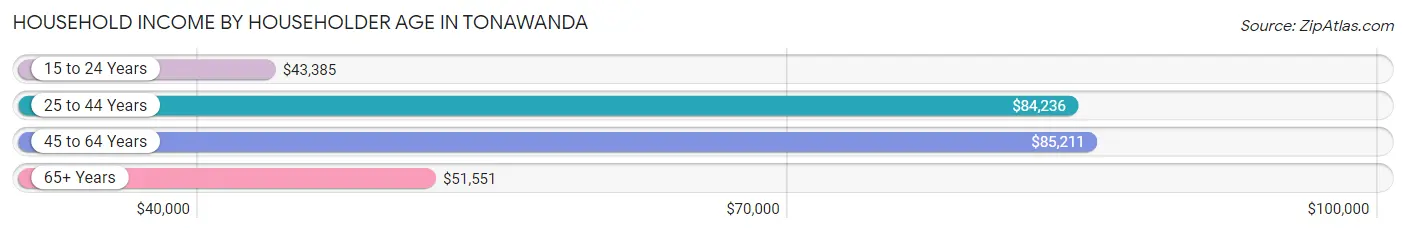
Household Income by Householder Age in Tonawanda
The median household income in Tonawanda is $74,313, with the highest median household income of $85,211 found in the 45 to 64 years age bracket for the primary householder. A total of 9,475 households (35.8%) fall into this category. Meanwhile, the 15 to 24 years age bracket for the primary householder has the lowest median household income of $43,385, with 570 households (2.1%) in this group.
| Income Bracket | # Households | Median Income |
| 15 to 24 Years | 570 (2.1%) | $43,385 |
| 25 to 44 Years | 8,578 (32.4%) | $84,236 |
| 45 to 64 Years | 9,475 (35.8%) | $85,211 |
| 65+ Years | 7,846 (29.6%) | $51,551 |
| Total | 26,469 (100.0%) | $74,313 |
Poverty in Tonawanda
Income Below Poverty by Sex and Age in Tonawanda
With 8.9% poverty level for males and 10.3% for females among the residents of Tonawanda, 6 to 11 year old males and 12 to 14 year old females are the most vulnerable to poverty, with 367 males (24.5%) and 187 females (25.1%) in their respective age groups living below the poverty level.
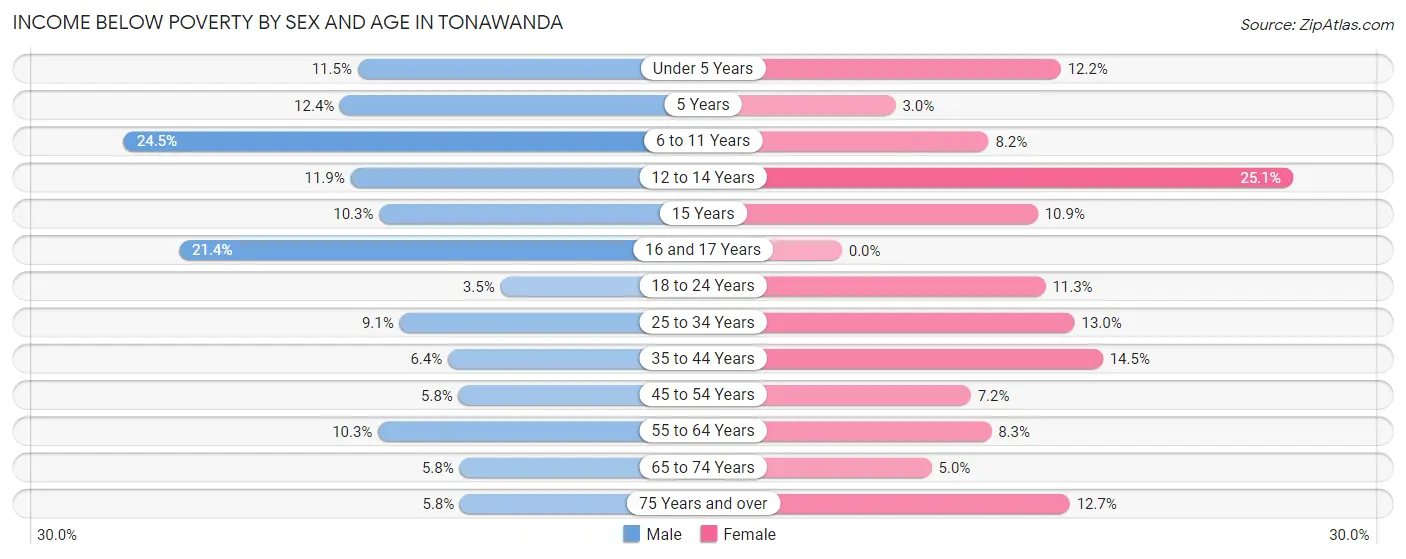
| Age Bracket | Male | Female |
| Under 5 Years | 163 (11.5%) | 117 (12.2%) |
| 5 Years | 22 (12.4%) | 4 (3.0%) |
| 6 to 11 Years | 367 (24.5%) | 144 (8.2%) |
| 12 to 14 Years | 73 (11.8%) | 187 (25.1%) |
| 15 Years | 33 (10.2%) | 49 (10.9%) |
| 16 and 17 Years | 171 (21.4%) | 0 (0.0%) |
| 18 to 24 Years | 66 (3.5%) | 206 (11.3%) |
| 25 to 34 Years | 439 (9.1%) | 606 (13.0%) |
| 35 to 44 Years | 222 (6.4%) | 515 (14.5%) |
| 45 to 54 Years | 197 (5.8%) | 251 (7.2%) |
| 55 to 64 Years | 426 (10.3%) | 368 (8.3%) |
| 65 to 74 Years | 203 (5.8%) | 176 (5.0%) |
| 75 Years and over | 97 (5.8%) | 370 (12.7%) |
| Total | 2,479 (8.9%) | 2,993 (10.3%) |
Income Above Poverty by Sex and Age in Tonawanda
According to the poverty statistics in Tonawanda, males aged 18 to 24 years and females aged 16 and 17 years are the age groups that are most secure financially, with 96.5% of males and 100.0% of females in these age groups living above the poverty line.
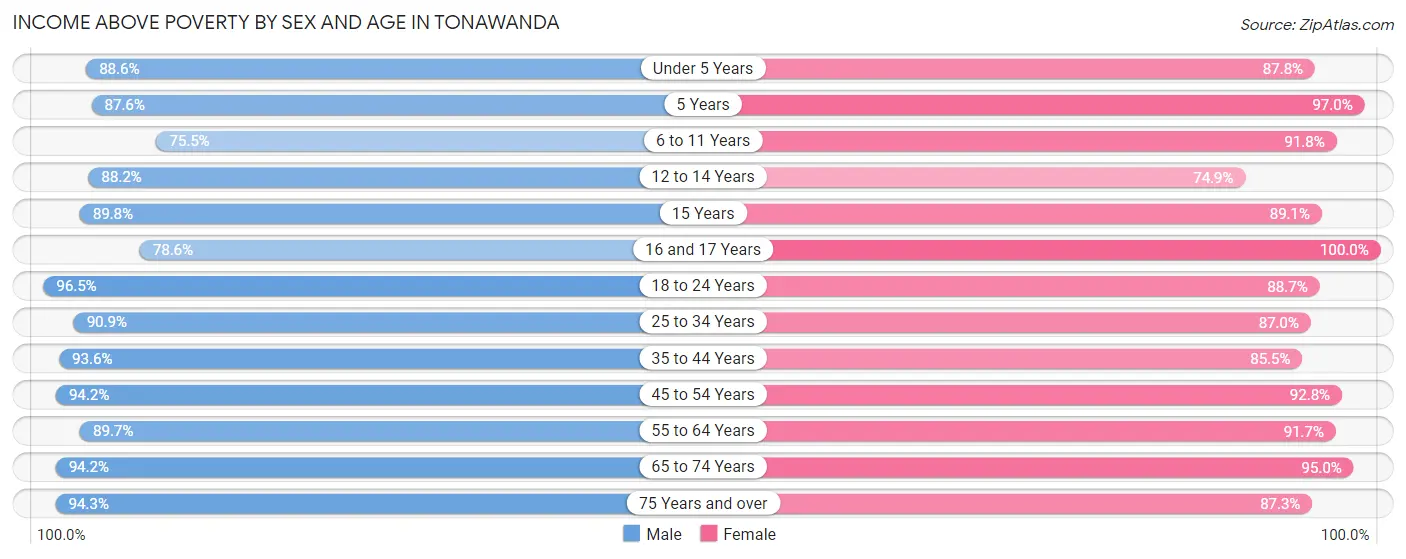
| Age Bracket | Male | Female |
| Under 5 Years | 1,260 (88.5%) | 843 (87.8%) |
| 5 Years | 155 (87.6%) | 130 (97.0%) |
| 6 to 11 Years | 1,133 (75.5%) | 1,619 (91.8%) |
| 12 to 14 Years | 543 (88.1%) | 558 (74.9%) |
| 15 Years | 289 (89.7%) | 400 (89.1%) |
| 16 and 17 Years | 628 (78.6%) | 627 (100.0%) |
| 18 to 24 Years | 1,819 (96.5%) | 1,610 (88.7%) |
| 25 to 34 Years | 4,376 (90.9%) | 4,069 (87.0%) |
| 35 to 44 Years | 3,234 (93.6%) | 3,029 (85.5%) |
| 45 to 54 Years | 3,181 (94.2%) | 3,246 (92.8%) |
| 55 to 64 Years | 3,706 (89.7%) | 4,056 (91.7%) |
| 65 to 74 Years | 3,309 (94.2%) | 3,345 (95.0%) |
| 75 Years and over | 1,590 (94.3%) | 2,545 (87.3%) |
| Total | 25,223 (91.0%) | 26,077 (89.7%) |
Income Below Poverty Among Married-Couple Families in Tonawanda
The poverty statistics for married-couple families in Tonawanda show that 3.9% or 437 of the total 11,219 families live below the poverty line. Families with 5 or more children have the highest poverty rate of 18.8%, comprising of 13 families. On the other hand, families with no children have the lowest poverty rate of 2.9%, which includes 204 families.
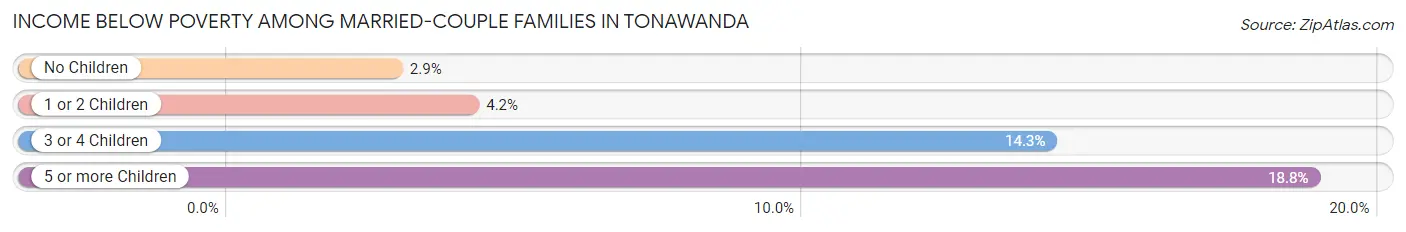
| Children | Above Poverty | Below Poverty |
| No Children | 6,913 (97.1%) | 204 (2.9%) |
| 1 or 2 Children | 3,380 (95.8%) | 148 (4.2%) |
| 3 or 4 Children | 433 (85.7%) | 72 (14.3%) |
| 5 or more Children | 56 (81.2%) | 13 (18.8%) |
| Total | 10,782 (96.1%) | 437 (3.9%) |
Income Below Poverty Among Single-Parent Households in Tonawanda
According to the poverty data in Tonawanda, 6.5% or 83 single-father households and 17.5% or 394 single-mother households are living below the poverty line. Among single-father households, those with 3 or 4 children have the highest poverty rate, with 42 households (64.6%) experiencing poverty. Likewise, among single-mother households, those with 3 or 4 children have the highest poverty rate, with 87 households (73.7%) falling below the poverty line.
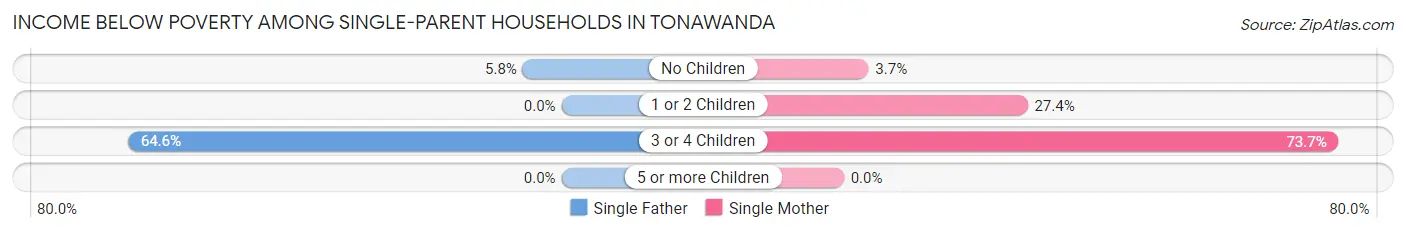
| Children | Single Father | Single Mother |
| No Children | 41 (5.8%) | 43 (3.7%) |
| 1 or 2 Children | 0 (0.0%) | 264 (27.4%) |
| 3 or 4 Children | 42 (64.6%) | 87 (73.7%) |
| 5 or more Children | 0 (0.0%) | 0 (0.0%) |
| Total | 83 (6.5%) | 394 (17.5%) |
Income Below Poverty Among Married-Couple vs Single-Parent Households in Tonawanda
The poverty data for Tonawanda shows that 437 of the married-couple family households (3.9%) and 477 of the single-parent households (13.5%) are living below the poverty level. Within the married-couple family households, those with 5 or more children have the highest poverty rate, with 13 households (18.8%) falling below the poverty line. Among the single-parent households, those with 3 or 4 children have the highest poverty rate, with 129 household (70.5%) living below poverty.
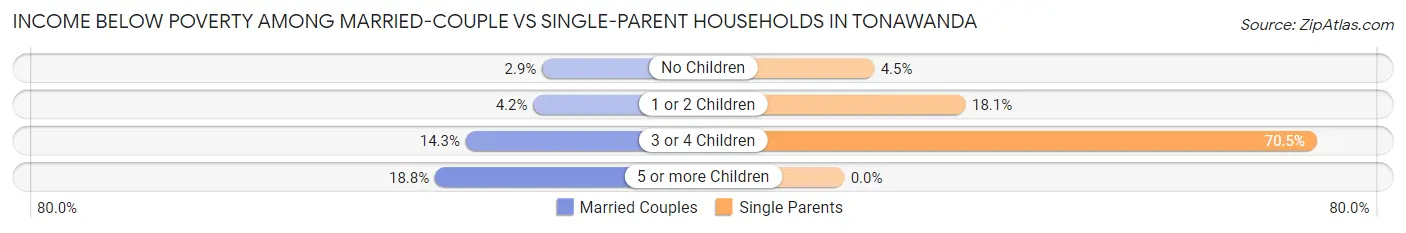
| Children | Married-Couple Families | Single-Parent Households |
| No Children | 204 (2.9%) | 84 (4.5%) |
| 1 or 2 Children | 148 (4.2%) | 264 (18.1%) |
| 3 or 4 Children | 72 (14.3%) | 129 (70.5%) |
| 5 or more Children | 13 (18.8%) | 0 (0.0%) |
| Total | 437 (3.9%) | 477 (13.5%) |
Race in Tonawanda
The most populous races in Tonawanda are White / Caucasian (49,267 | 86.1%), Black / African American (3,338 | 5.8%), and Two or more Races (2,399 | 4.2%).
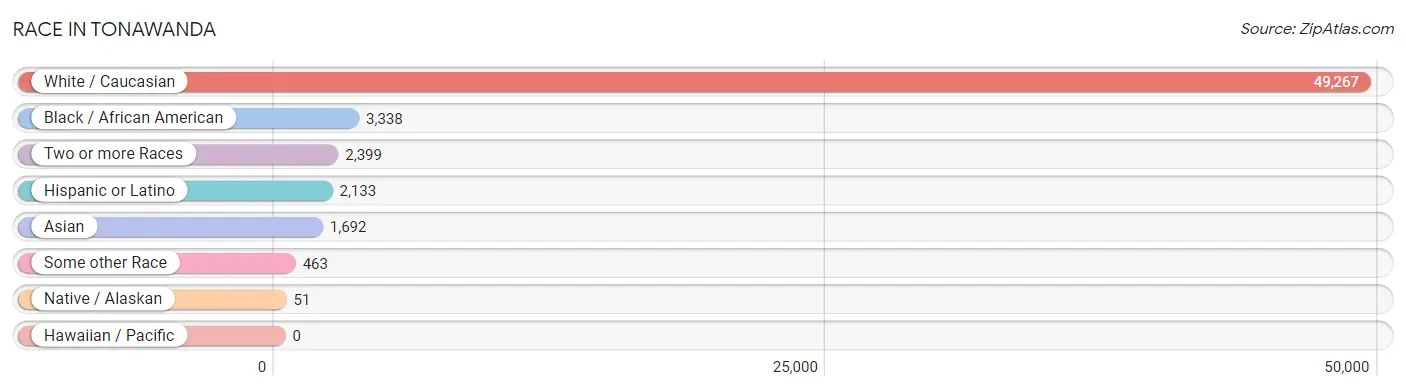
| Race | # Population | % Population |
| Asian | 1,692 | 3.0% |
| Black / African American | 3,338 | 5.8% |
| Hawaiian / Pacific | 0 | 0.0% |
| Hispanic or Latino | 2,133 | 3.7% |
| Native / Alaskan | 51 | 0.1% |
| White / Caucasian | 49,267 | 86.1% |
| Two or more Races | 2,399 | 4.2% |
| Some other Race | 463 | 0.8% |
| Total | 57,210 | 100.0% |
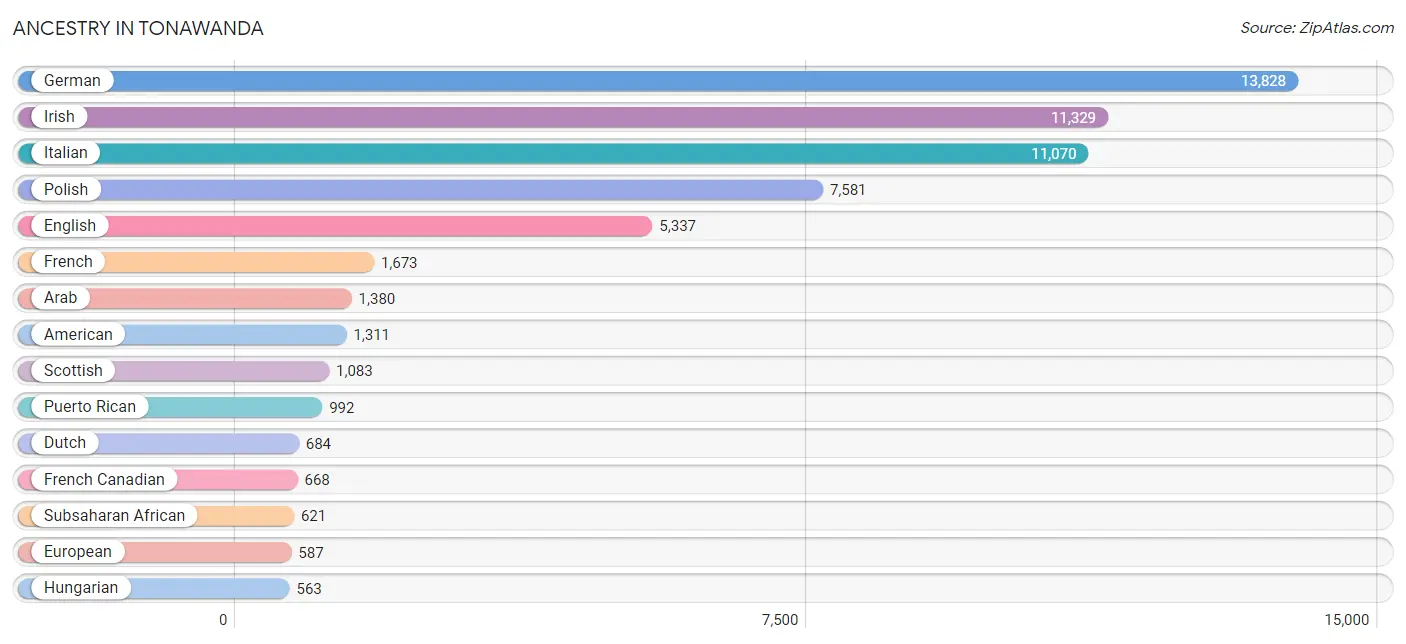
Ancestry in Tonawanda
The most populous ancestries reported in Tonawanda are German (13,828 | 24.2%), Irish (11,329 | 19.8%), Italian (11,070 | 19.4%), Polish (7,581 | 13.3%), and English (5,337 | 9.3%), together accounting for 85.9% of all Tonawanda residents.
| Ancestry | # Population | % Population |
| Afghan | 12 | 0.0% |
| African | 425 | 0.7% |
| American | 1,311 | 2.3% |
| Arab | 1,380 | 2.4% |
| Argentinean | 8 | 0.0% |
| Armenian | 43 | 0.1% |
| Assyrian / Chaldean / Syriac | 5 | 0.0% |
| Austrian | 224 | 0.4% |
| Belgian | 11 | 0.0% |
| Bhutanese | 110 | 0.2% |
| Blackfeet | 10 | 0.0% |
| British | 219 | 0.4% |
| British West Indian | 46 | 0.1% |
| Burmese | 62 | 0.1% |
| Cambodian | 15 | 0.0% |
| Canadian | 145 | 0.3% |
| Celtic | 13 | 0.0% |
| Central American | 188 | 0.3% |
| Central American Indian | 13 | 0.0% |
| Chickasaw | 13 | 0.0% |
| Costa Rican | 8 | 0.0% |
| Croatian | 184 | 0.3% |
| Cuban | 220 | 0.4% |
| Czech | 65 | 0.1% |
| Czechoslovakian | 85 | 0.2% |
| Danish | 554 | 1.0% |
| Dominican | 168 | 0.3% |
| Dutch | 684 | 1.2% |
| Eastern European | 175 | 0.3% |
| Ecuadorian | 35 | 0.1% |
| English | 5,337 | 9.3% |
| Estonian | 8 | 0.0% |
| European | 587 | 1.0% |
| Filipino | 53 | 0.1% |
| Finnish | 30 | 0.1% |
| French | 1,673 | 2.9% |
| French Canadian | 668 | 1.2% |
| German | 13,828 | 24.2% |
| Ghanaian | 107 | 0.2% |
| Greek | 166 | 0.3% |
| Guatemalan | 144 | 0.3% |
| Guyanese | 78 | 0.1% |
| Haitian | 33 | 0.1% |
| Honduran | 36 | 0.1% |
| Hungarian | 563 | 1.0% |
| Icelander | 18 | 0.0% |
| Indian (Asian) | 144 | 0.3% |
| Indonesian | 241 | 0.4% |
| Iranian | 5 | 0.0% |
| Iraqi | 358 | 0.6% |
| Irish | 11,329 | 19.8% |
| Iroquois | 136 | 0.2% |
| Italian | 11,070 | 19.4% |
| Jamaican | 12 | 0.0% |
| Korean | 115 | 0.2% |
| Latvian | 105 | 0.2% |
| Lebanese | 336 | 0.6% |
| Lithuanian | 97 | 0.2% |
| Mexican | 140 | 0.2% |
| Moroccan | 444 | 0.8% |
| Nigerian | 22 | 0.0% |
| Northern European | 83 | 0.2% |
| Norwegian | 118 | 0.2% |
| Paiute | 9 | 0.0% |
| Pennsylvania German | 11 | 0.0% |
| Peruvian | 12 | 0.0% |
| Polish | 7,581 | 13.3% |
| Portuguese | 79 | 0.1% |
| Puerto Rican | 992 | 1.7% |
| Romanian | 132 | 0.2% |
| Russian | 506 | 0.9% |
| Scandinavian | 58 | 0.1% |
| Scotch-Irish | 421 | 0.7% |
| Scottish | 1,083 | 1.9% |
| Serbian | 106 | 0.2% |
| Slavic | 146 | 0.3% |
| Slovak | 59 | 0.1% |
| Somali | 67 | 0.1% |
| South American | 55 | 0.1% |
| Spaniard | 104 | 0.2% |
| Spanish | 103 | 0.2% |
| Sri Lankan | 350 | 0.6% |
| Subsaharan African | 621 | 1.1% |
| Swedish | 492 | 0.9% |
| Swiss | 24 | 0.0% |
| Syrian | 54 | 0.1% |
| Thai | 279 | 0.5% |
| Turkish | 30 | 0.1% |
| Ukrainian | 315 | 0.5% |
| Vietnamese | 351 | 0.6% |
| Welsh | 244 | 0.4% |
| West Indian | 7 | 0.0% |
| Yugoslavian | 50 | 0.1% | View All 93 Rows |
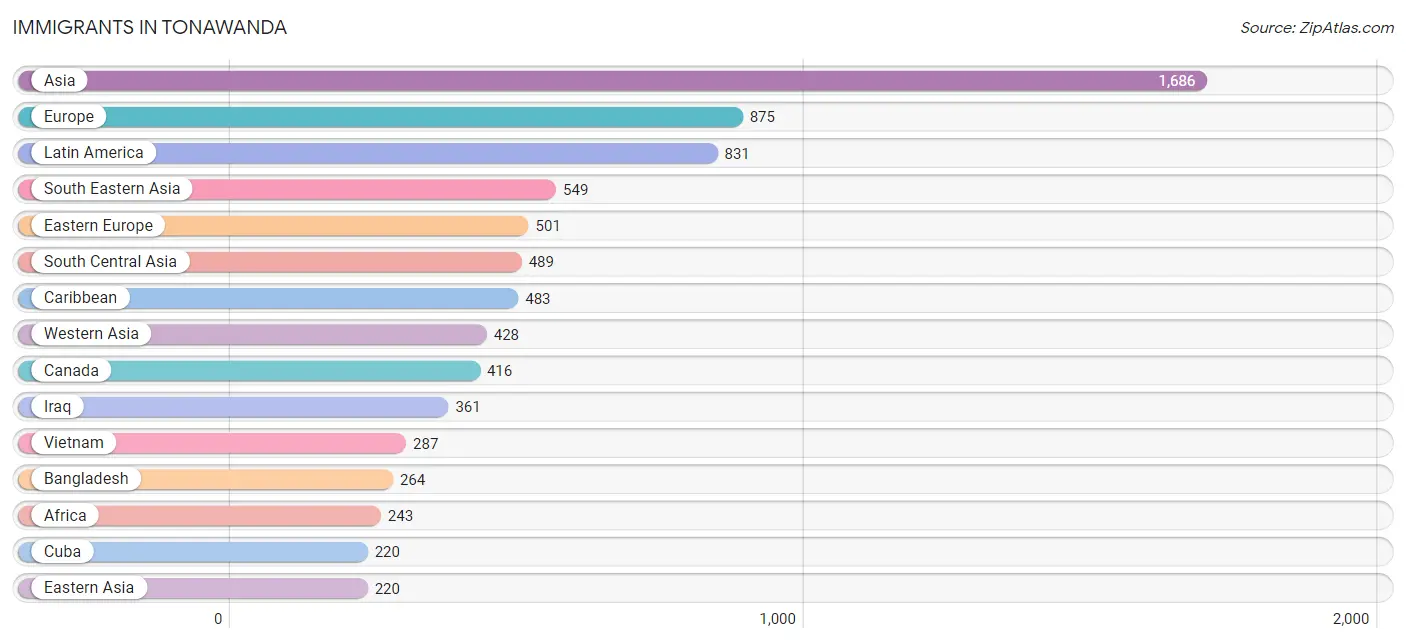
Immigrants in Tonawanda
The most numerous immigrant groups reported in Tonawanda came from Asia (1,686 | 2.9%), Europe (875 | 1.5%), Latin America (831 | 1.5%), South Eastern Asia (549 | 1.0%), and Eastern Europe (501 | 0.9%), together accounting for 7.8% of all Tonawanda residents.
| Immigration Origin | # Population | % Population |
| Afghanistan | 12 | 0.0% |
| Africa | 243 | 0.4% |
| Asia | 1,686 | 2.9% |
| Australia | 13 | 0.0% |
| Bangladesh | 264 | 0.5% |
| Barbados | 1 | 0.0% |
| Belarus | 49 | 0.1% |
| Bosnia and Herzegovina | 80 | 0.1% |
| Cambodia | 8 | 0.0% |
| Canada | 416 | 0.7% |
| Caribbean | 483 | 0.8% |
| Central America | 199 | 0.4% |
| China | 103 | 0.2% |
| Costa Rica | 8 | 0.0% |
| Croatia | 34 | 0.1% |
| Cuba | 220 | 0.4% |
| Dominican Republic | 96 | 0.2% |
| Eastern Africa | 68 | 0.1% |
| Eastern Asia | 220 | 0.4% |
| Eastern Europe | 501 | 0.9% |
| Ecuador | 35 | 0.1% |
| Egypt | 29 | 0.1% |
| England | 8 | 0.0% |
| Europe | 875 | 1.5% |
| France | 40 | 0.1% |
| Germany | 100 | 0.2% |
| Ghana | 21 | 0.0% |
| Greece | 18 | 0.0% |
| Guatemala | 129 | 0.2% |
| Guyana | 114 | 0.2% |
| Haiti | 10 | 0.0% |
| Honduras | 36 | 0.1% |
| Hong Kong | 8 | 0.0% |
| India | 54 | 0.1% |
| Indonesia | 24 | 0.0% |
| Iraq | 361 | 0.6% |
| Ireland | 11 | 0.0% |
| Italy | 170 | 0.3% |
| Jamaica | 74 | 0.1% |
| Japan | 76 | 0.1% |
| Kazakhstan | 13 | 0.0% |
| Korea | 41 | 0.1% |
| Latin America | 831 | 1.5% |
| Latvia | 61 | 0.1% |
| Lebanon | 20 | 0.0% |
| Lithuania | 6 | 0.0% |
| Malaysia | 16 | 0.0% |
| Mexico | 26 | 0.1% |
| Middle Africa | 15 | 0.0% |
| Moldova | 16 | 0.0% |
| Morocco | 46 | 0.1% |
| Nepal | 36 | 0.1% |
| Nigeria | 22 | 0.0% |
| Northern Africa | 75 | 0.1% |
| Northern Europe | 37 | 0.1% |
| Oceania | 13 | 0.0% |
| Pakistan | 11 | 0.0% |
| Philippines | 27 | 0.1% |
| Poland | 4 | 0.0% |
| Portugal | 9 | 0.0% |
| Romania | 63 | 0.1% |
| Russia | 52 | 0.1% |
| South America | 149 | 0.3% |
| South Central Asia | 489 | 0.9% |
| South Eastern Asia | 549 | 1.0% |
| Southern Europe | 197 | 0.3% |
| St. Vincent and the Grenadines | 6 | 0.0% |
| Taiwan | 23 | 0.0% |
| Trinidad and Tobago | 76 | 0.1% |
| Turkey | 11 | 0.0% |
| Ukraine | 136 | 0.2% |
| Vietnam | 287 | 0.5% |
| Western Africa | 43 | 0.1% |
| Western Asia | 428 | 0.7% |
| Western Europe | 140 | 0.2% |
| Yemen | 36 | 0.1% | View All 76 Rows |
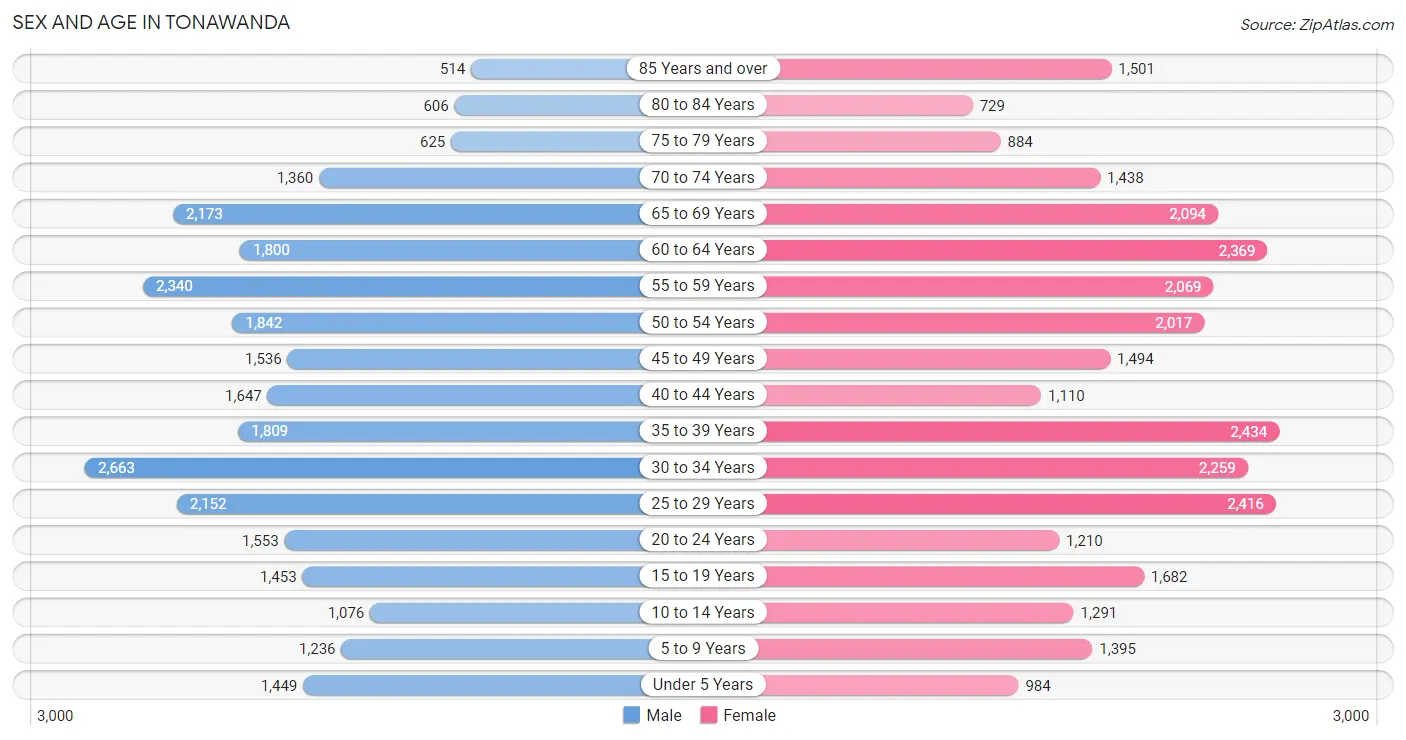
Sex and Age in Tonawanda
Sex and Age in Tonawanda
The most populous age groups in Tonawanda are 30 to 34 Years (2,663 | 9.6%) for men and 35 to 39 Years (2,434 | 8.3%) for women.
| Age Bracket | Male | Female |
| Under 5 Years | 1,449 (5.2%) | 984 (3.4%) |
| 5 to 9 Years | 1,236 (4.4%) | 1,395 (4.8%) |
| 10 to 14 Years | 1,076 (3.9%) | 1,291 (4.4%) |
| 15 to 19 Years | 1,453 (5.2%) | 1,682 (5.7%) |
| 20 to 24 Years | 1,553 (5.6%) | 1,210 (4.1%) |
| 25 to 29 Years | 2,152 (7.7%) | 2,416 (8.2%) |
| 30 to 34 Years | 2,663 (9.6%) | 2,259 (7.7%) |
| 35 to 39 Years | 1,809 (6.5%) | 2,434 (8.3%) |
| 40 to 44 Years | 1,647 (5.9%) | 1,110 (3.8%) |
| 45 to 49 Years | 1,536 (5.5%) | 1,494 (5.1%) |
| 50 to 54 Years | 1,842 (6.6%) | 2,017 (6.9%) |
| 55 to 59 Years | 2,340 (8.4%) | 2,069 (7.0%) |
| 60 to 64 Years | 1,800 (6.5%) | 2,369 (8.1%) |
| 65 to 69 Years | 2,173 (7.8%) | 2,094 (7.1%) |
| 70 to 74 Years | 1,360 (4.9%) | 1,438 (4.9%) |
| 75 to 79 Years | 625 (2.2%) | 884 (3.0%) |
| 80 to 84 Years | 606 (2.2%) | 729 (2.5%) |
| 85 Years and over | 514 (1.8%) | 1,501 (5.1%) |
| Total | 27,834 (100.0%) | 29,376 (100.0%) |
Families and Households in Tonawanda
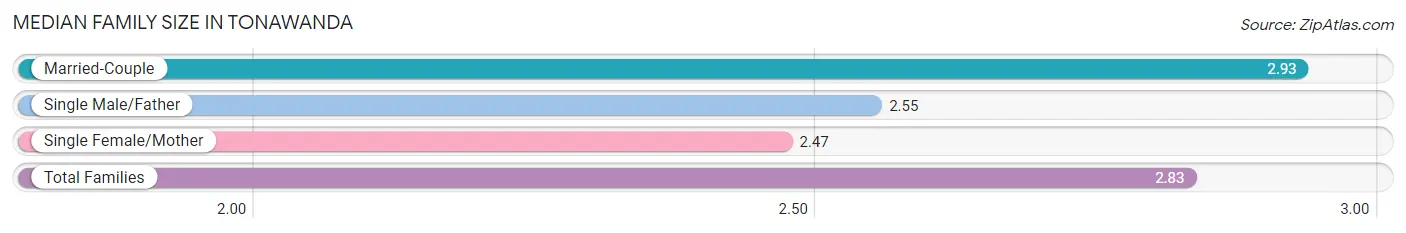
Median Family Size in Tonawanda
The median family size in Tonawanda is 2.83 persons per family, with married-couple families (11,219 | 76.1%) accounting for the largest median family size of 2.93 persons per family. On the other hand, single female/mother families (2,246 | 15.2%) represent the smallest median family size with 2.47 persons per family.
| Family Type | # Families | Family Size |
| Married-Couple | 11,219 (76.1%) | 2.93 |
| Single Male/Father | 1,286 (8.7%) | 2.55 |
| Single Female/Mother | 2,246 (15.2%) | 2.47 |
| Total Families | 14,751 (100.0%) | 2.83 |
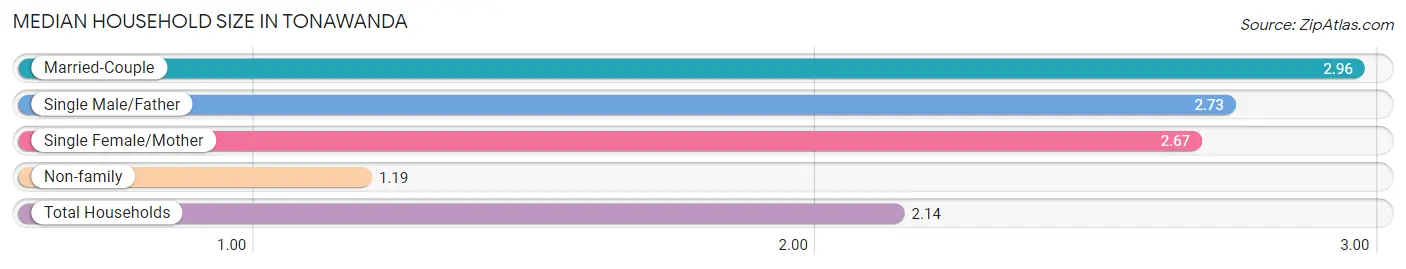
Median Household Size in Tonawanda
The median household size in Tonawanda is 2.14 persons per household, with married-couple households (11,219 | 42.4%) accounting for the largest median household size of 2.96 persons per household. non-family households (11,718 | 44.3%) represent the smallest median household size with 1.19 persons per household.
| Household Type | # Households | Household Size |
| Married-Couple | 11,219 (42.4%) | 2.96 |
| Single Male/Father | 1,286 (4.9%) | 2.73 |
| Single Female/Mother | 2,246 (8.5%) | 2.67 |
| Non-family | 11,718 (44.3%) | 1.19 |
| Total Households | 26,469 (100.0%) | 2.14 |
Household Size by Marriage Status in Tonawanda
Out of a total of 26,469 households in Tonawanda, 14,751 (55.7%) are family households, while 11,718 (44.3%) are nonfamily households. The most numerous type of family households are 2-person households, comprising 7,393, and the most common type of nonfamily households are 1-person households, comprising 9,748.
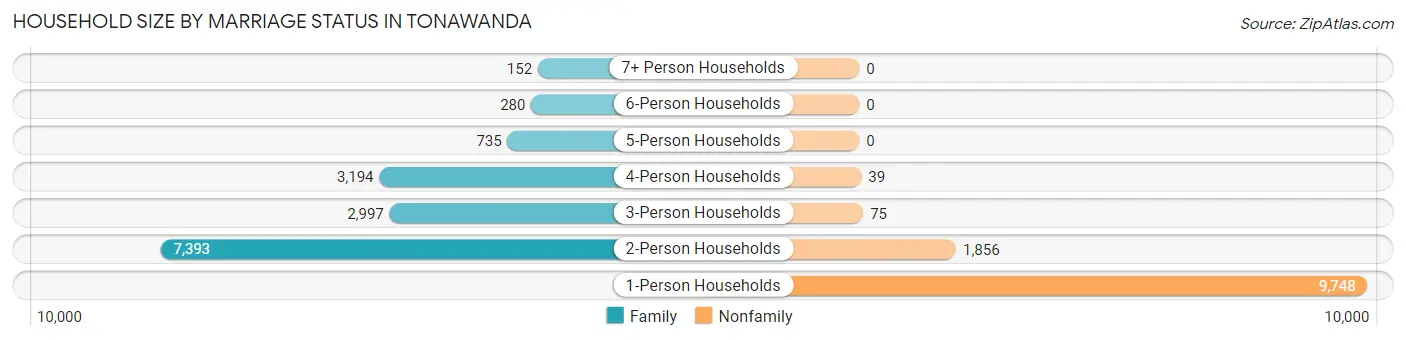
| Household Size | Family Households | Nonfamily Households |
| 1-Person Households | - | 9,748 (36.8%) |
| 2-Person Households | 7,393 (27.9%) | 1,856 (7.0%) |
| 3-Person Households | 2,997 (11.3%) | 75 (0.3%) |
| 4-Person Households | 3,194 (12.1%) | 39 (0.2%) |
| 5-Person Households | 735 (2.8%) | 0 (0.0%) |
| 6-Person Households | 280 (1.1%) | 0 (0.0%) |
| 7+ Person Households | 152 (0.6%) | 0 (0.0%) |
| Total | 14,751 (55.7%) | 11,718 (44.3%) |
Female Fertility in Tonawanda
Fertility by Age in Tonawanda
Average fertility rate in Tonawanda is 31.0 births per 1,000 women. Women in the age bracket of 20 to 34 years have the highest fertility rate with 54.0 births per 1,000 women. Women in the age bracket of 20 to 34 years acount for 77.6% of all women with births.
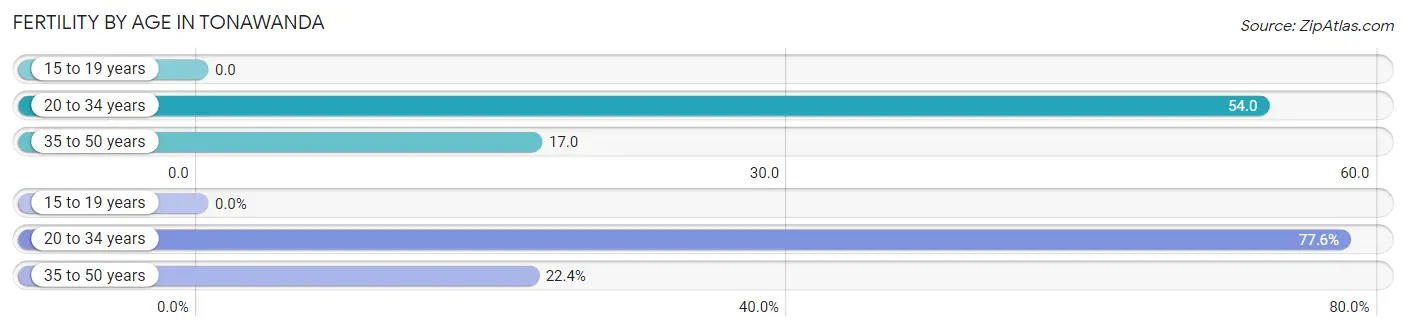
| Age Bracket | Women with Births | Births / 1,000 Women |
| 15 to 19 years | 0 (0.0%) | 0.0 |
| 20 to 34 years | 318 (77.6%) | 54.0 |
| 35 to 50 years | 92 (22.4%) | 17.0 |
| Total | 410 (100.0%) | 31.0 |
Fertility by Age by Marriage Status in Tonawanda
85.1% of women with births (410) in Tonawanda are married. The highest percentage of unmarried women with births falls into 20 to 34 years age bracket with 19.2% of them unmarried at the time of birth, while the lowest percentage of unmarried women with births belong to 35 to 50 years age bracket with 0.0% of them unmarried.
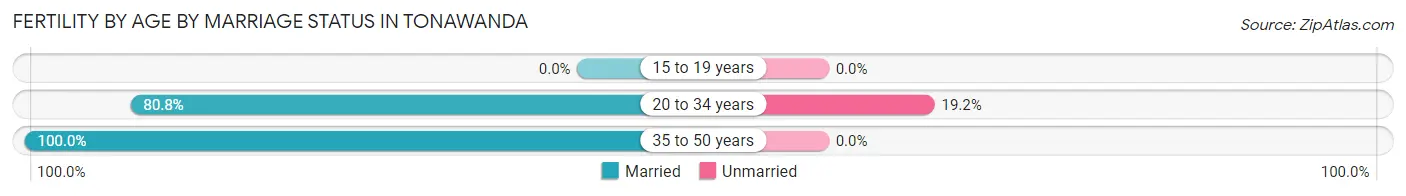
| Age Bracket | Married | Unmarried |
| 15 to 19 years | 0 (0.0%) | 0 (0.0%) |
| 20 to 34 years | 257 (80.8%) | 61 (19.2%) |
| 35 to 50 years | 92 (100.0%) | 0 (0.0%) |
| Total | 349 (85.1%) | 61 (14.9%) |
Fertility by Education in Tonawanda
Average fertility rate in Tonawanda is 31.0 births per 1,000 women. Women with the education attainment of graduate degree have the highest fertility rate of 60.0 births per 1,000 women, while women with the education attainment of less than high school have the lowest fertility at 18.0 births per 1,000 women. Women with the education attainment of graduate degree represent 35.8% of all women with births.
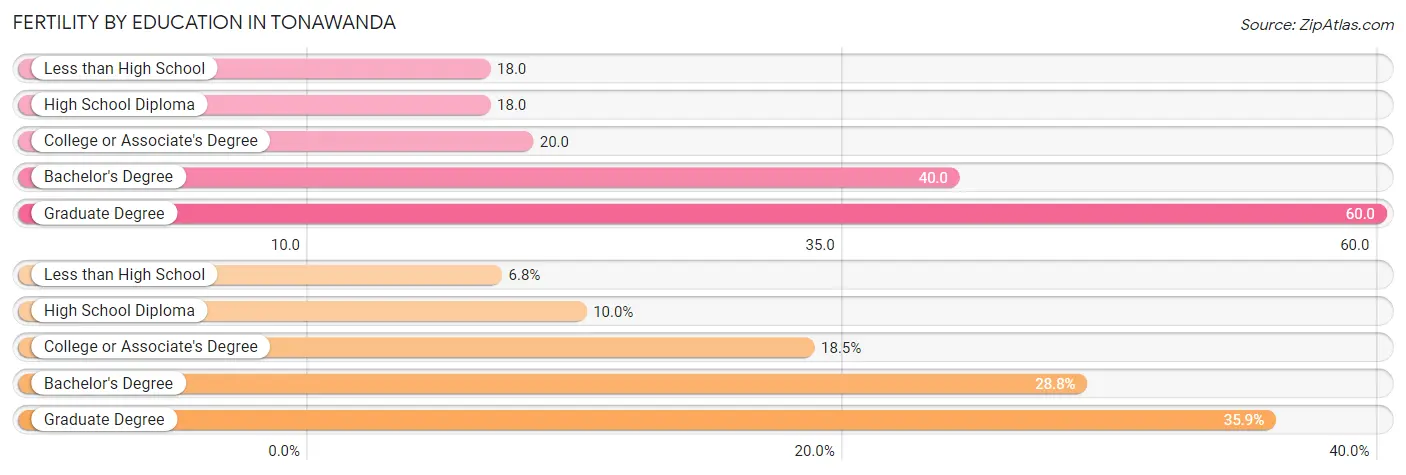
| Educational Attainment | Women with Births | Births / 1,000 Women |
| Less than High School | 28 (6.8%) | 18.0 |
| High School Diploma | 41 (10.0%) | 18.0 |
| College or Associate's Degree | 76 (18.5%) | 20.0 |
| Bachelor's Degree | 118 (28.8%) | 40.0 |
| Graduate Degree | 147 (35.8%) | 60.0 |
| Total | 410 (100.0%) | 31.0 |
Fertility by Education by Marriage Status in Tonawanda
14.9% of women with births in Tonawanda are unmarried. Women with the educational attainment of less than high school are most likely to be married with 100.0% of them married at childbirth, while women with the educational attainment of high school diploma are least likely to be married with 46.3% of them unmarried at childbirth.
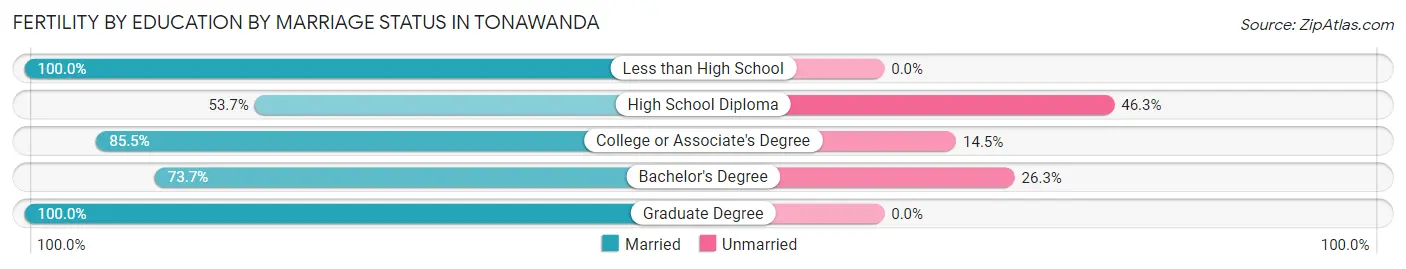
| Educational Attainment | Married | Unmarried |
| Less than High School | 28 (100.0%) | 0 (0.0%) |
| High School Diploma | 22 (53.7%) | 19 (46.3%) |
| College or Associate's Degree | 65 (85.5%) | 11 (14.5%) |
| Bachelor's Degree | 87 (73.7%) | 31 (26.3%) |
| Graduate Degree | 147 (100.0%) | 0 (0.0%) |
| Total | 349 (85.1%) | 61 (14.9%) |
Employment Characteristics in Tonawanda
Employment by Class of Employer in Tonawanda
Among the 30,439 employed individuals in Tonawanda, private company employees (20,133 | 66.1%), not-for-profit organizations (3,537 | 11.6%), and local government employees (2,741 | 9.0%) make up the most common classes of employment.
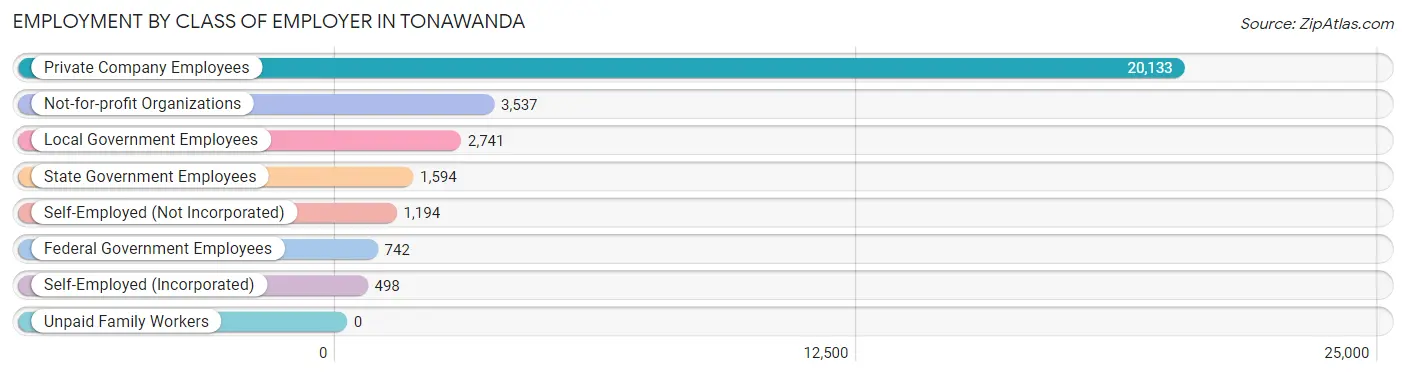
| Employer Class | # Employees | % Employees |
| Private Company Employees | 20,133 | 66.1% |
| Self-Employed (Incorporated) | 498 | 1.6% |
| Self-Employed (Not Incorporated) | 1,194 | 3.9% |
| Not-for-profit Organizations | 3,537 | 11.6% |
| Local Government Employees | 2,741 | 9.0% |
| State Government Employees | 1,594 | 5.2% |
| Federal Government Employees | 742 | 2.4% |
| Unpaid Family Workers | 0 | 0.0% |
| Total | 30,439 | 100.0% |
Employment Status by Age in Tonawanda
According to the labor force statistics for Tonawanda, out of the total population over 16 years of age (49,008), 65.5% or 32,100 individuals are in the labor force, with 3.9% or 1,252 of them unemployed. The age group with the highest labor force participation rate is 30 to 34 years, with 90.8% or 4,469 individuals in the labor force. Within the labor force, the 25 to 29 years age range has the highest percentage of unemployed individuals, with 7.9% or 325 of them being unemployed.
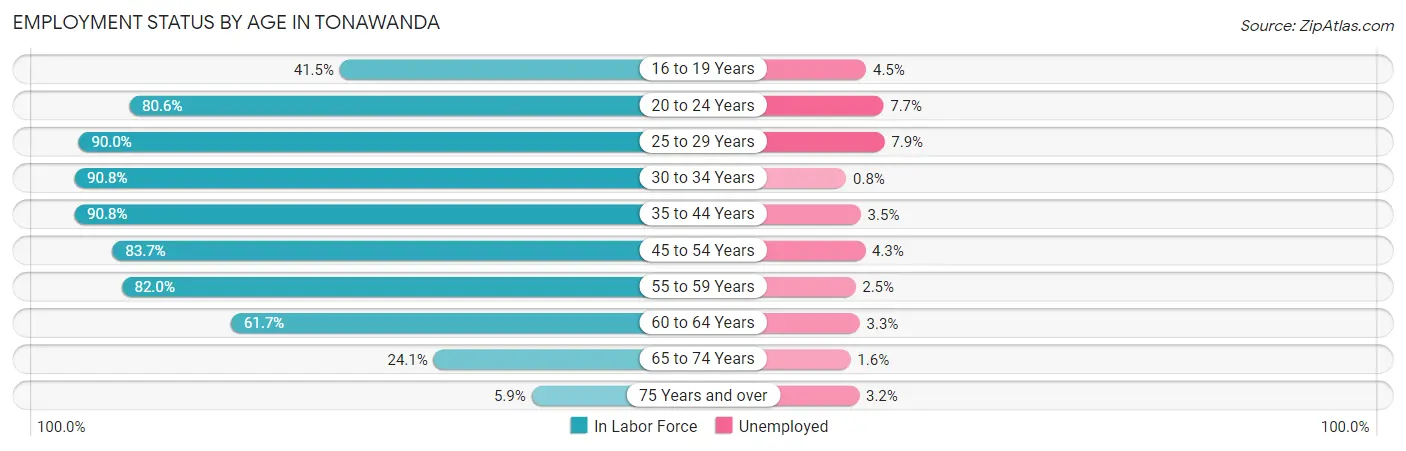
| Age Bracket | In Labor Force | Unemployed |
| 16 to 19 Years | 981 (41.5%) | 44 (4.5%) |
| 20 to 24 Years | 2,227 (80.6%) | 171 (7.7%) |
| 25 to 29 Years | 4,111 (90.0%) | 325 (7.9%) |
| 30 to 34 Years | 4,469 (90.8%) | 36 (0.8%) |
| 35 to 44 Years | 6,356 (90.8%) | 222 (3.5%) |
| 45 to 54 Years | 5,766 (83.7%) | 248 (4.3%) |
| 55 to 59 Years | 3,615 (82.0%) | 90 (2.5%) |
| 60 to 64 Years | 2,572 (61.7%) | 85 (3.3%) |
| 65 to 74 Years | 1,703 (24.1%) | 27 (1.6%) |
| 75 Years and over | 287 (5.9%) | 9 (3.2%) |
| Total | 32,100 (65.5%) | 1,252 (3.9%) |
Employment Status by Educational Attainment in Tonawanda
According to labor force statistics for Tonawanda, 84.1% of individuals (26,876) out of the total population between 25 and 64 years of age (31,957) are in the labor force, with 3.8% or 1,021 of them being unemployed. The group with the highest labor force participation rate are those with the educational attainment of bachelor's degree or higher, with 92.1% or 12,222 individuals in the labor force. Within the labor force, individuals with high school diploma education have the highest percentage of unemployment, with 6.5% or 334 of them being unemployed.
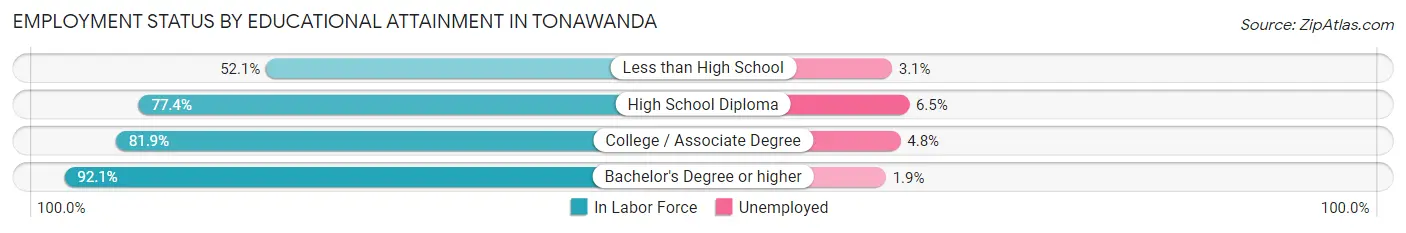
| Educational Attainment | In Labor Force | Unemployed |
| Less than High School | 610 (52.1%) | 36 (3.1%) |
| High School Diploma | 5,144 (77.4%) | 432 (6.5%) |
| College / Associate Degree | 8,903 (81.9%) | 522 (4.8%) |
| Bachelor's Degree or higher | 12,222 (92.1%) | 252 (1.9%) |
| Total | 26,876 (84.1%) | 1,214 (3.8%) |
Employment Occupations by Sex in Tonawanda
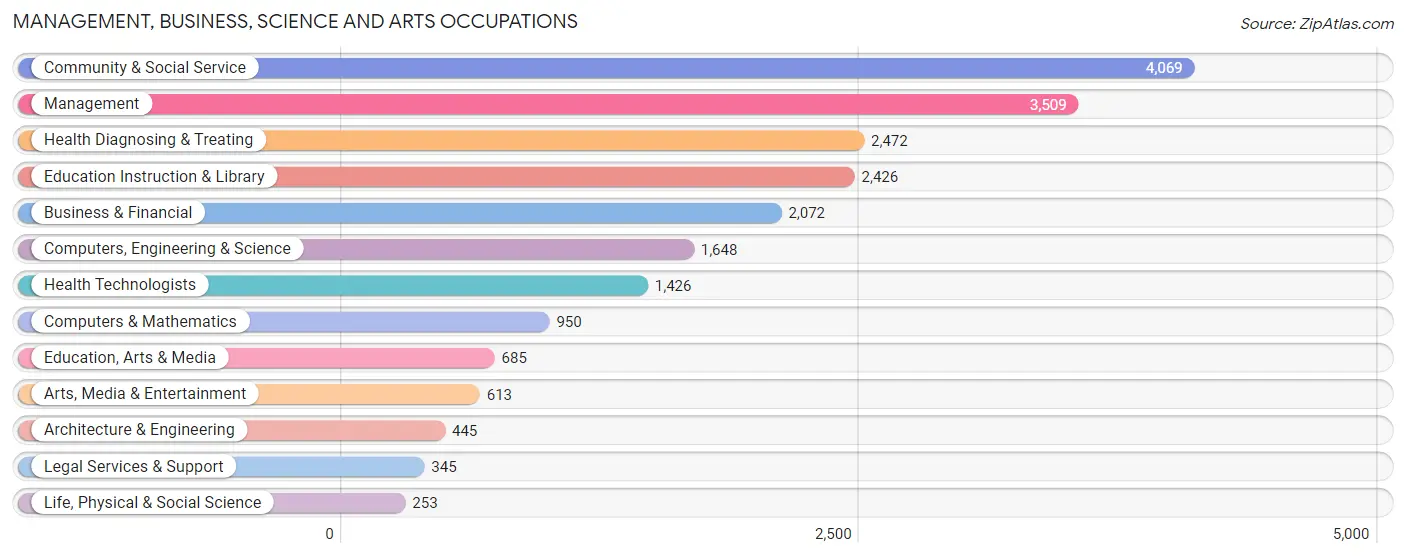
Management, Business, Science and Arts Occupations
The most common Management, Business, Science and Arts occupations in Tonawanda are Community & Social Service (4,069 | 13.2%), Management (3,509 | 11.4%), Health Diagnosing & Treating (2,472 | 8.0%), Education Instruction & Library (2,426 | 7.9%), and Business & Financial (2,072 | 6.7%).
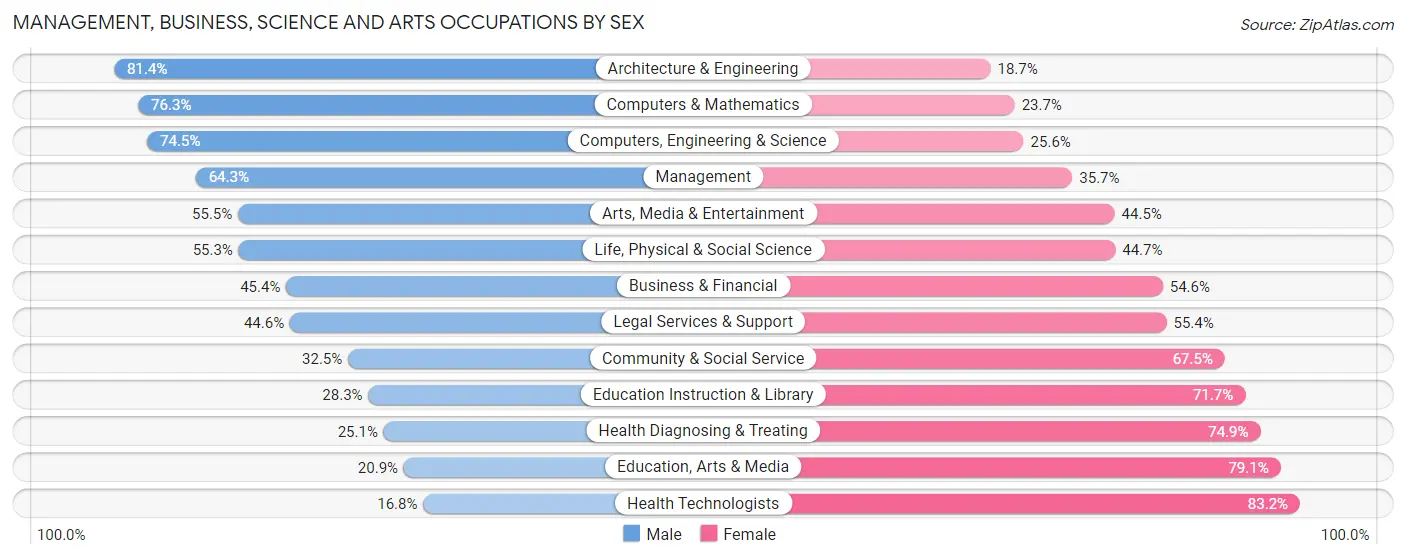
Management, Business, Science and Arts Occupations by Sex
Within the Management, Business, Science and Arts occupations in Tonawanda, the most male-oriented occupations are Architecture & Engineering (81.4%), Computers & Mathematics (76.3%), and Computers, Engineering & Science (74.5%), while the most female-oriented occupations are Health Technologists (83.2%), Education, Arts & Media (79.1%), and Health Diagnosing & Treating (74.9%).
| Occupation | Male | Female |
| Management | 2,256 (64.3%) | 1,253 (35.7%) |
| Business & Financial | 941 (45.4%) | 1,131 (54.6%) |
| Computers, Engineering & Science | 1,227 (74.5%) | 421 (25.6%) |
| Computers & Mathematics | 725 (76.3%) | 225 (23.7%) |
| Architecture & Engineering | 362 (81.4%) | 83 (18.6%) |
| Life, Physical & Social Science | 140 (55.3%) | 113 (44.7%) |
| Community & Social Service | 1,323 (32.5%) | 2,746 (67.5%) |
| Education, Arts & Media | 143 (20.9%) | 542 (79.1%) |
| Legal Services & Support | 154 (44.6%) | 191 (55.4%) |
| Education Instruction & Library | 686 (28.3%) | 1,740 (71.7%) |
| Arts, Media & Entertainment | 340 (55.5%) | 273 (44.5%) |
| Health Diagnosing & Treating | 620 (25.1%) | 1,852 (74.9%) |
| Health Technologists | 240 (16.8%) | 1,186 (83.2%) |
| Total (Category) | 6,367 (46.2%) | 7,403 (53.8%) |
| Total (Overall) | 15,996 (52.0%) | 14,768 (48.0%) |
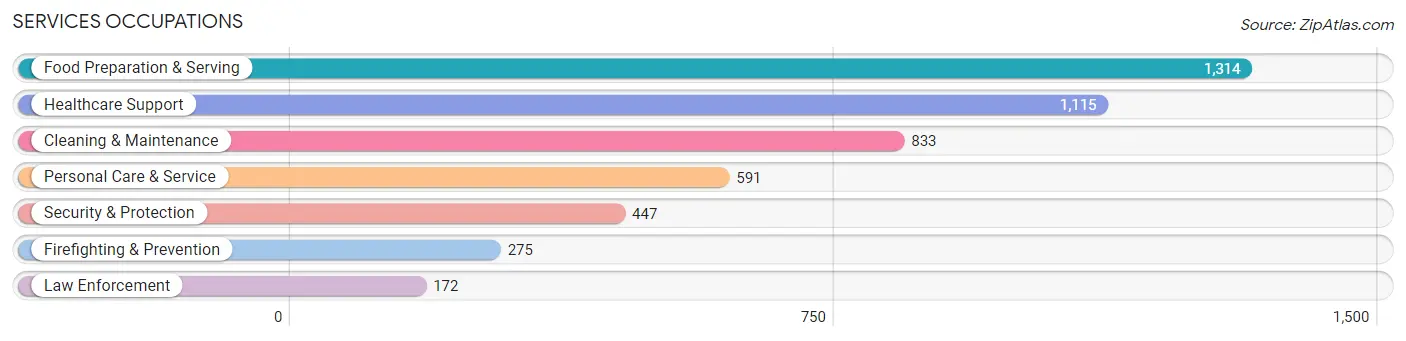
Services Occupations
The most common Services occupations in Tonawanda are Food Preparation & Serving (1,314 | 4.3%), Healthcare Support (1,115 | 3.6%), Cleaning & Maintenance (833 | 2.7%), Personal Care & Service (591 | 1.9%), and Security & Protection (447 | 1.5%).
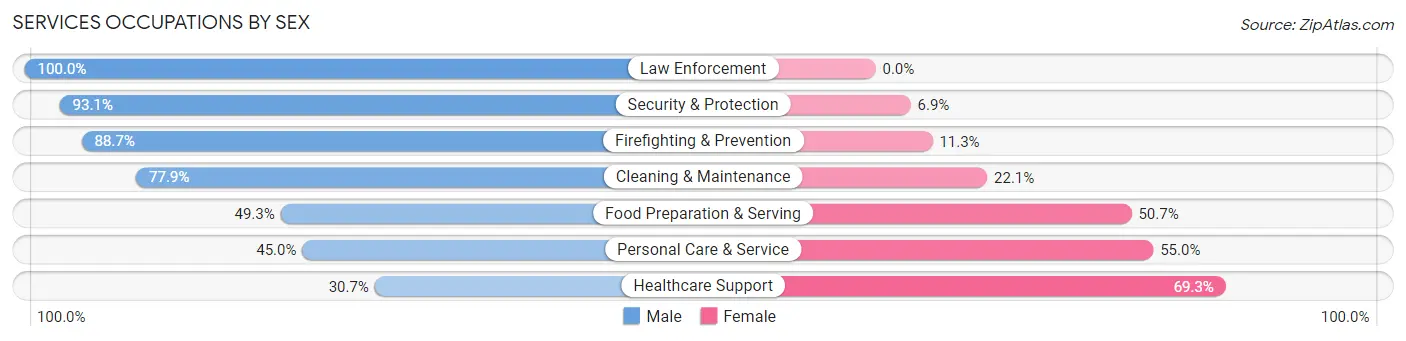
Services Occupations by Sex
Within the Services occupations in Tonawanda, the most male-oriented occupations are Law Enforcement (100.0%), Security & Protection (93.1%), and Firefighting & Prevention (88.7%), while the most female-oriented occupations are Healthcare Support (69.3%), Personal Care & Service (55.0%), and Food Preparation & Serving (50.7%).
| Occupation | Male | Female |
| Healthcare Support | 342 (30.7%) | 773 (69.3%) |
| Security & Protection | 416 (93.1%) | 31 (6.9%) |
| Firefighting & Prevention | 244 (88.7%) | 31 (11.3%) |
| Law Enforcement | 172 (100.0%) | 0 (0.0%) |
| Food Preparation & Serving | 648 (49.3%) | 666 (50.7%) |
| Cleaning & Maintenance | 649 (77.9%) | 184 (22.1%) |
| Personal Care & Service | 266 (45.0%) | 325 (55.0%) |
| Total (Category) | 2,321 (54.0%) | 1,979 (46.0%) |
| Total (Overall) | 15,996 (52.0%) | 14,768 (48.0%) |
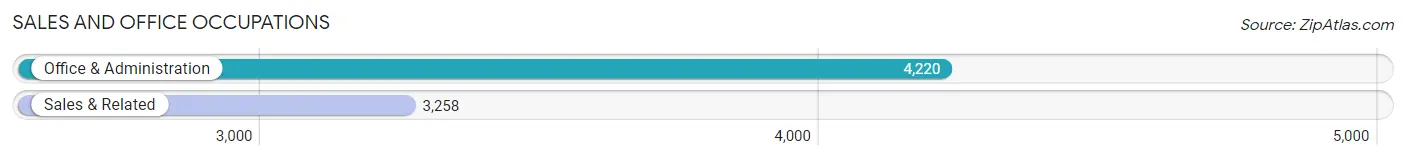
Sales and Office Occupations
The most common Sales and Office occupations in Tonawanda are Office & Administration (4,220 | 13.7%), and Sales & Related (3,258 | 10.6%).
Sales and Office Occupations by Sex
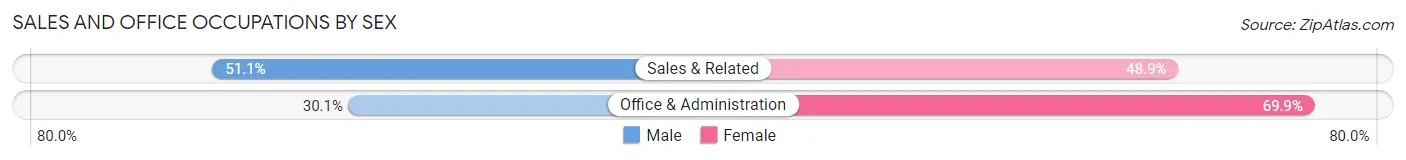
| Occupation | Male | Female |
| Sales & Related | 1,665 (51.1%) | 1,593 (48.9%) |
| Office & Administration | 1,271 (30.1%) | 2,949 (69.9%) |
| Total (Category) | 2,936 (39.3%) | 4,542 (60.7%) |
| Total (Overall) | 15,996 (52.0%) | 14,768 (48.0%) |
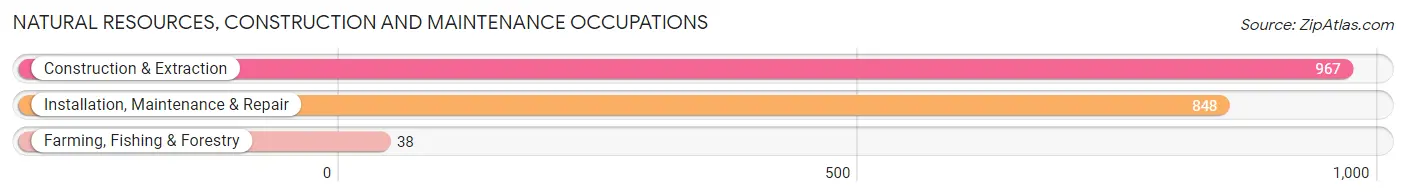
Natural Resources, Construction and Maintenance Occupations
The most common Natural Resources, Construction and Maintenance occupations in Tonawanda are Construction & Extraction (967 | 3.1%), Installation, Maintenance & Repair (848 | 2.8%), and Farming, Fishing & Forestry (38 | 0.1%).
Natural Resources, Construction and Maintenance Occupations by Sex
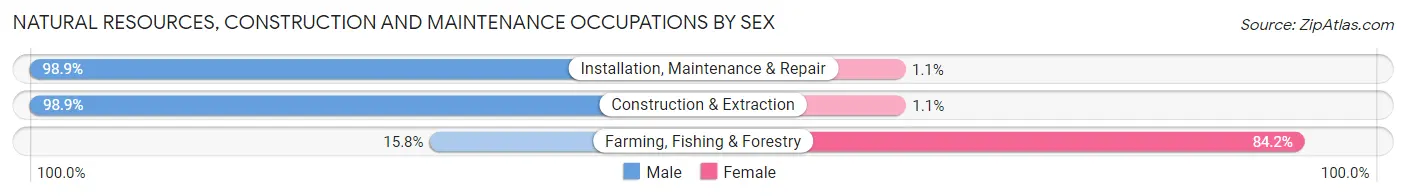
| Occupation | Male | Female |
| Farming, Fishing & Forestry | 6 (15.8%) | 32 (84.2%) |
| Construction & Extraction | 956 (98.9%) | 11 (1.1%) |
| Installation, Maintenance & Repair | 839 (98.9%) | 9 (1.1%) |
| Total (Category) | 1,801 (97.2%) | 52 (2.8%) |
| Total (Overall) | 15,996 (52.0%) | 14,768 (48.0%) |
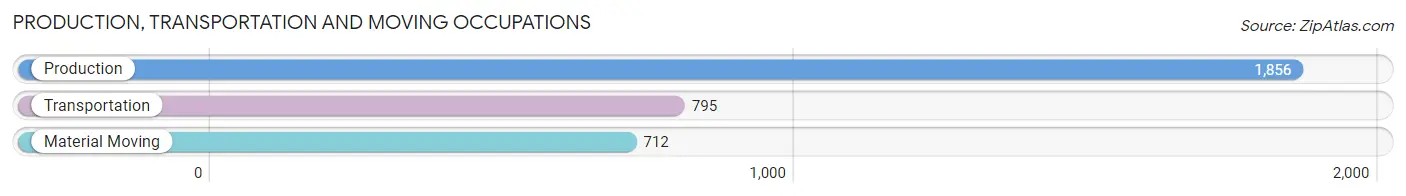
Production, Transportation and Moving Occupations
The most common Production, Transportation and Moving occupations in Tonawanda are Production (1,856 | 6.0%), Transportation (795 | 2.6%), and Material Moving (712 | 2.3%).
Production, Transportation and Moving Occupations by Sex
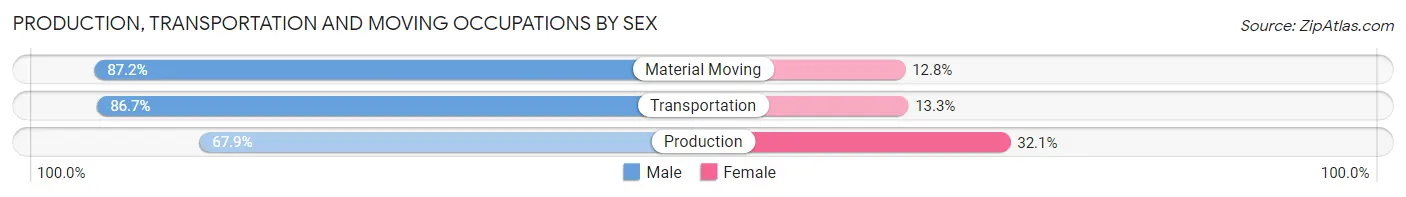
| Occupation | Male | Female |
| Production | 1,261 (67.9%) | 595 (32.1%) |
| Transportation | 689 (86.7%) | 106 (13.3%) |
| Material Moving | 621 (87.2%) | 91 (12.8%) |
| Total (Category) | 2,571 (76.4%) | 792 (23.5%) |
| Total (Overall) | 15,996 (52.0%) | 14,768 (48.0%) |
Employment Industries by Sex in Tonawanda
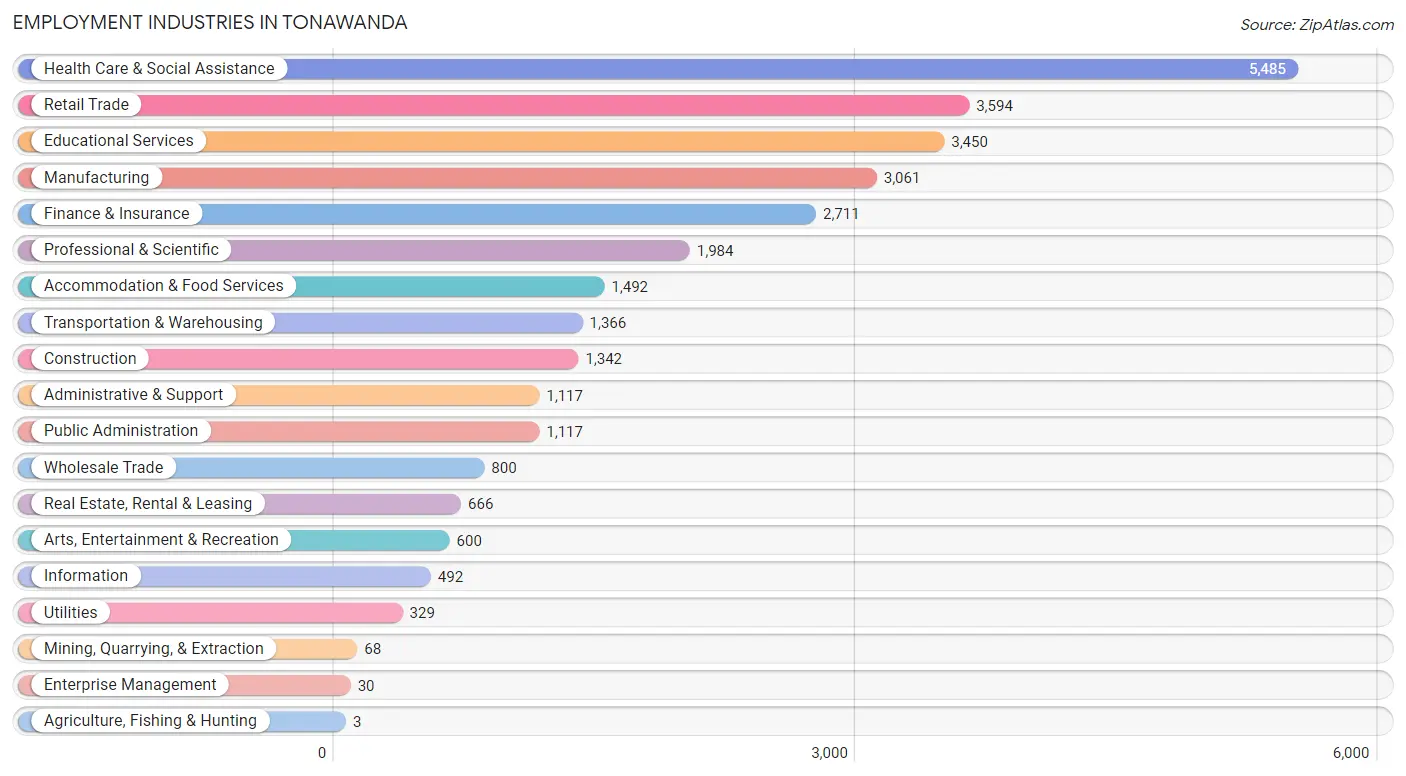
Employment Industries in Tonawanda
The major employment industries in Tonawanda include Health Care & Social Assistance (5,485 | 17.8%), Retail Trade (3,594 | 11.7%), Educational Services (3,450 | 11.2%), Manufacturing (3,061 | 10.0%), and Finance & Insurance (2,711 | 8.8%).
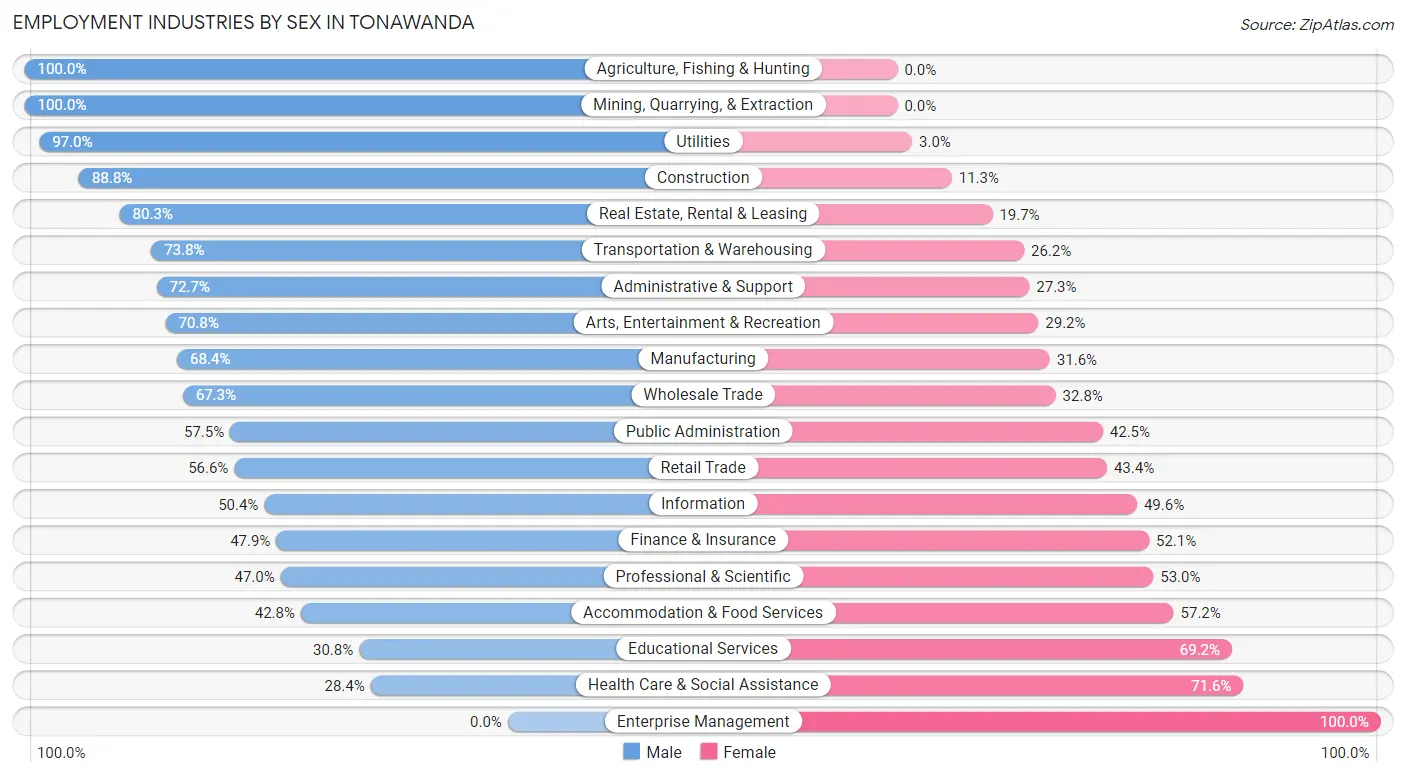
Employment Industries by Sex in Tonawanda
The Tonawanda industries that see more men than women are Agriculture, Fishing & Hunting (100.0%), Mining, Quarrying, & Extraction (100.0%), and Utilities (97.0%), whereas the industries that tend to have a higher number of women are Enterprise Management (100.0%), Health Care & Social Assistance (71.6%), and Educational Services (69.2%).
| Industry | Male | Female |
| Agriculture, Fishing & Hunting | 3 (100.0%) | 0 (0.0%) |
| Mining, Quarrying, & Extraction | 68 (100.0%) | 0 (0.0%) |
| Construction | 1,191 (88.7%) | 151 (11.3%) |
| Manufacturing | 2,095 (68.4%) | 966 (31.6%) |
| Wholesale Trade | 538 (67.2%) | 262 (32.8%) |
| Retail Trade | 2,035 (56.6%) | 1,559 (43.4%) |
| Transportation & Warehousing | 1,008 (73.8%) | 358 (26.2%) |
| Utilities | 319 (97.0%) | 10 (3.0%) |
| Information | 248 (50.4%) | 244 (49.6%) |
| Finance & Insurance | 1,299 (47.9%) | 1,412 (52.1%) |
| Real Estate, Rental & Leasing | 535 (80.3%) | 131 (19.7%) |
| Professional & Scientific | 933 (47.0%) | 1,051 (53.0%) |
| Enterprise Management | 0 (0.0%) | 30 (100.0%) |
| Administrative & Support | 812 (72.7%) | 305 (27.3%) |
| Educational Services | 1,062 (30.8%) | 2,388 (69.2%) |
| Health Care & Social Assistance | 1,558 (28.4%) | 3,927 (71.6%) |
| Arts, Entertainment & Recreation | 425 (70.8%) | 175 (29.2%) |
| Accommodation & Food Services | 639 (42.8%) | 853 (57.2%) |
| Public Administration | 642 (57.5%) | 475 (42.5%) |
| Total | 15,996 (52.0%) | 14,768 (48.0%) |
Education in Tonawanda
School Enrollment in Tonawanda
The most common levels of schooling among the 10,582 students in Tonawanda are high school (2,757 | 26.1%), elementary school (2,146 | 20.3%), and middle school (1,885 | 17.8%).
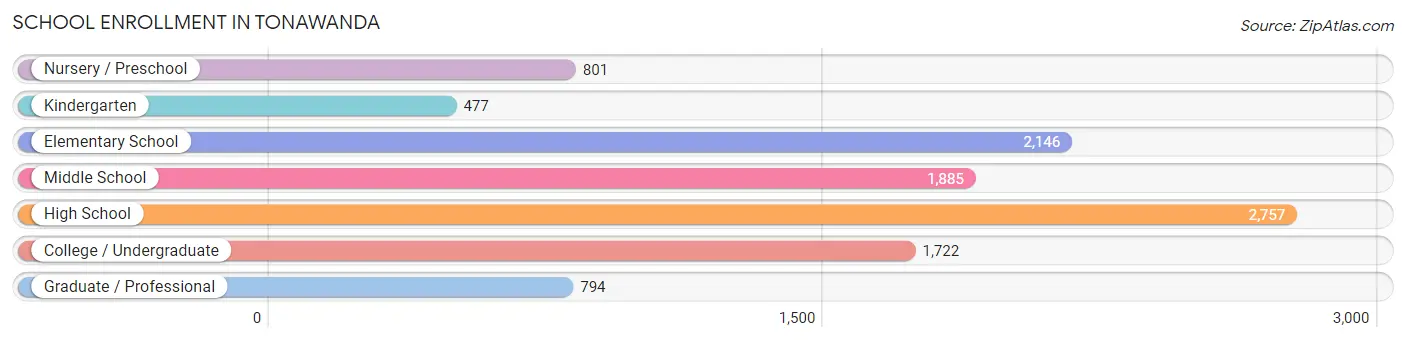
| School Level | # Students | % Students |
| Nursery / Preschool | 801 | 7.6% |
| Kindergarten | 477 | 4.5% |
| Elementary School | 2,146 | 20.3% |
| Middle School | 1,885 | 17.8% |
| High School | 2,757 | 26.1% |
| College / Undergraduate | 1,722 | 16.3% |
| Graduate / Professional | 794 | 7.5% |
| Total | 10,582 | 100.0% |
School Enrollment by Age by Funding Source in Tonawanda
Out of a total of 10,582 students who are enrolled in schools in Tonawanda, 2,349 (22.2%) attend a private institution, while the remaining 8,233 (77.8%) are enrolled in public schools. The age group of 3 to 4 year olds has the highest likelihood of being enrolled in private schools, with 411 (54.3% in the age bracket) enrolled. Conversely, the age group of 15 to 17 year olds has the lowest likelihood of being enrolled in a private school, with 1,842 (85.7% in the age bracket) attending a public institution.
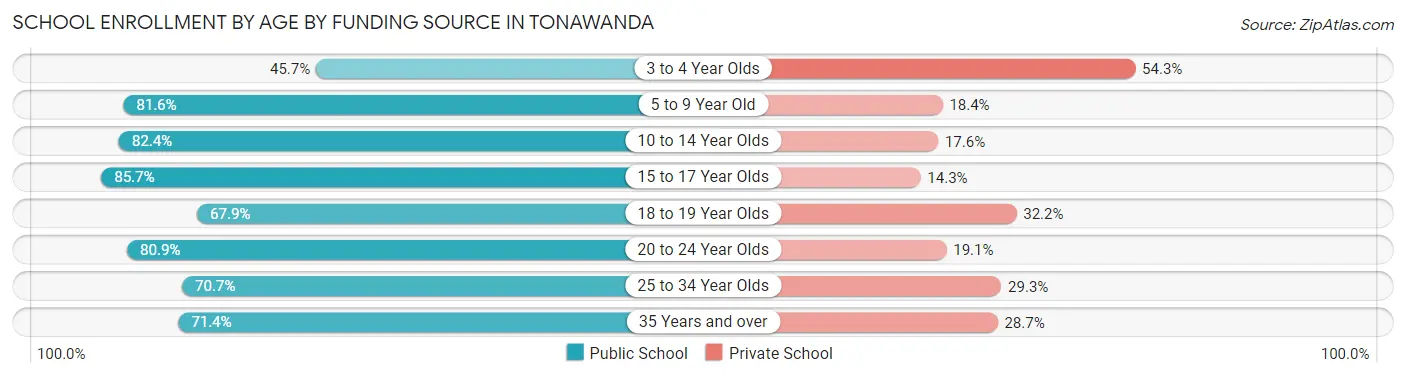
| Age Bracket | Public School | Private School |
| 3 to 4 Year Olds | 346 (45.7%) | 411 (54.3%) |
| 5 to 9 Year Old | 2,066 (81.6%) | 466 (18.4%) |
| 10 to 14 Year Olds | 1,942 (82.4%) | 414 (17.6%) |
| 15 to 17 Year Olds | 1,842 (85.7%) | 307 (14.3%) |
| 18 to 19 Year Olds | 439 (67.8%) | 208 (32.2%) |
| 20 to 24 Year Olds | 635 (80.9%) | 150 (19.1%) |
| 25 to 34 Year Olds | 571 (70.7%) | 237 (29.3%) |
| 35 Years and over | 391 (71.4%) | 157 (28.6%) |
| Total | 8,233 (77.8%) | 2,349 (22.2%) |
Educational Attainment by Field of Study in Tonawanda
Business (3,172 | 17.7%), education (2,246 | 12.5%), science & technology (1,854 | 10.3%), social sciences (1,668 | 9.3%), and arts & humanities (1,208 | 6.7%) are the most common fields of study among 17,961 individuals in Tonawanda who have obtained a bachelor's degree or higher.
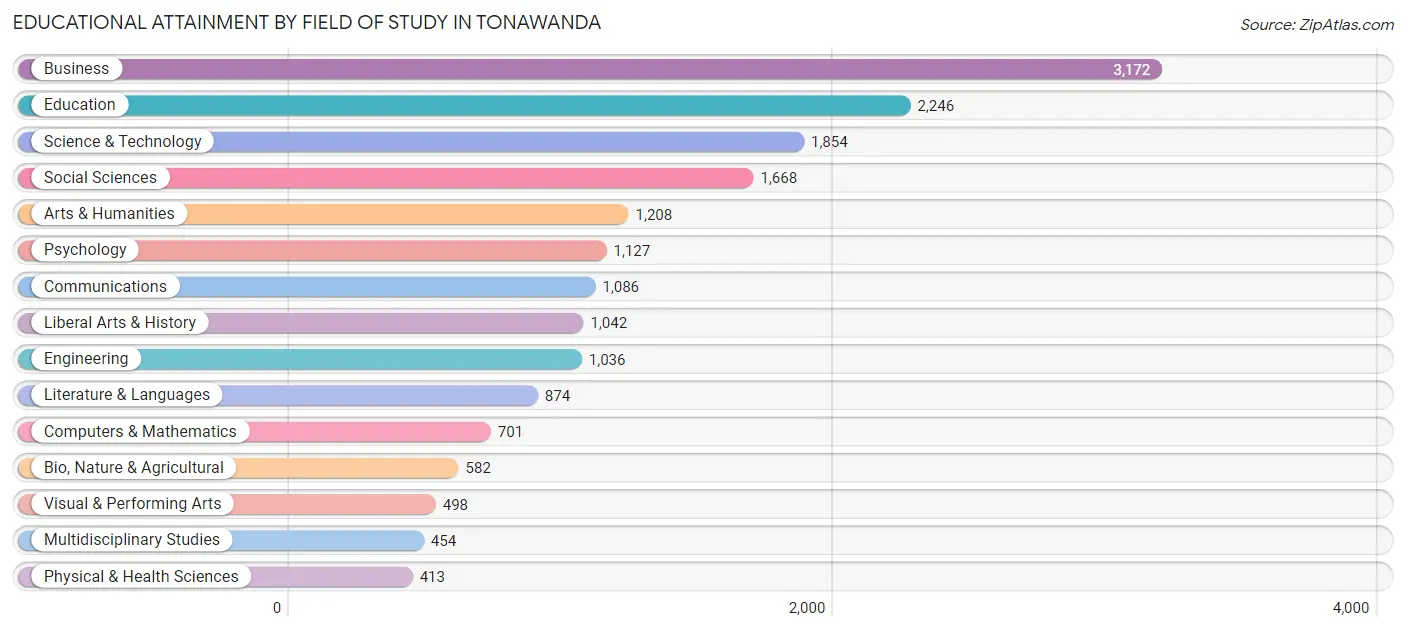
| Field of Study | # Graduates | % Graduates |
| Computers & Mathematics | 701 | 3.9% |
| Bio, Nature & Agricultural | 582 | 3.2% |
| Physical & Health Sciences | 413 | 2.3% |
| Psychology | 1,127 | 6.3% |
| Social Sciences | 1,668 | 9.3% |
| Engineering | 1,036 | 5.8% |
| Multidisciplinary Studies | 454 | 2.5% |
| Science & Technology | 1,854 | 10.3% |
| Business | 3,172 | 17.7% |
| Education | 2,246 | 12.5% |
| Literature & Languages | 874 | 4.9% |
| Liberal Arts & History | 1,042 | 5.8% |
| Visual & Performing Arts | 498 | 2.8% |
| Communications | 1,086 | 6.0% |
| Arts & Humanities | 1,208 | 6.7% |
| Total | 17,961 | 100.0% |
Transportation & Commute in Tonawanda
Vehicle Availability by Sex in Tonawanda
The most prevalent vehicle ownership categories in Tonawanda are males with 2 vehicles (8,066, accounting for 50.9%) and females with 2 vehicles (7,386, making up 55.4%).
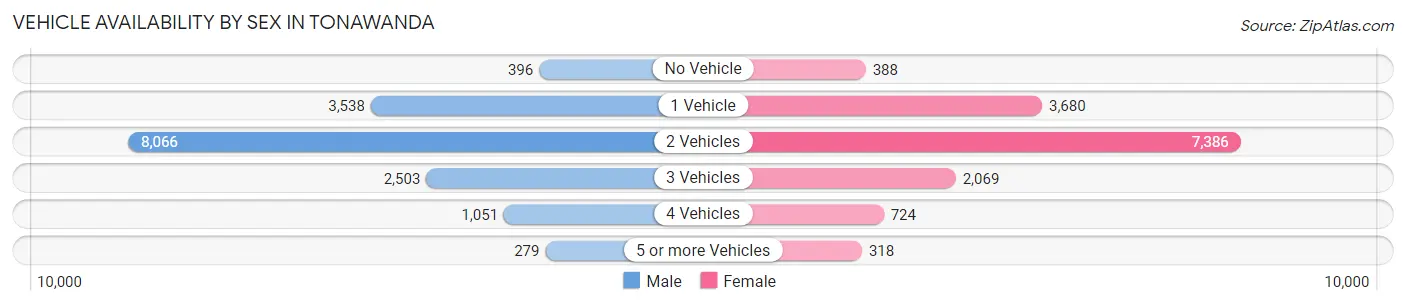
| Vehicles Available | Male | Female |
| No Vehicle | 396 (2.5%) | 388 (2.7%) |
| 1 Vehicle | 3,538 (22.4%) | 3,680 (25.3%) |
| 2 Vehicles | 8,066 (50.9%) | 7,386 (50.7%) |
| 3 Vehicles | 2,503 (15.8%) | 2,069 (14.2%) |
| 4 Vehicles | 1,051 (6.6%) | 724 (5.0%) |
| 5 or more Vehicles | 279 (1.8%) | 318 (2.2%) |
| Total | 15,833 (100.0%) | 14,565 (100.0%) |
Commute Time in Tonawanda
The most frequently occuring commute durations in Tonawanda are 20 to 24 minutes (6,146 commuters, 23.1%), 15 to 19 minutes (4,931 commuters, 18.5%), and 10 to 14 minutes (4,588 commuters, 17.2%).
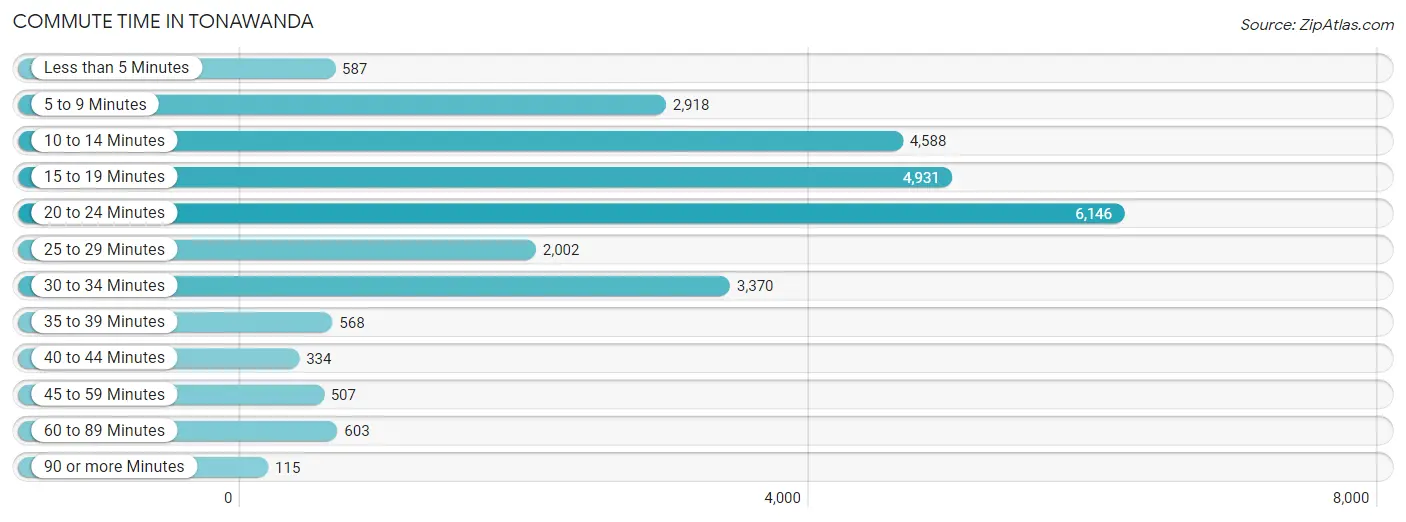
| Commute Time | # Commuters | % Commuters |
| Less than 5 Minutes | 587 | 2.2% |
| 5 to 9 Minutes | 2,918 | 10.9% |
| 10 to 14 Minutes | 4,588 | 17.2% |
| 15 to 19 Minutes | 4,931 | 18.5% |
| 20 to 24 Minutes | 6,146 | 23.1% |
| 25 to 29 Minutes | 2,002 | 7.5% |
| 30 to 34 Minutes | 3,370 | 12.6% |
| 35 to 39 Minutes | 568 | 2.1% |
| 40 to 44 Minutes | 334 | 1.3% |
| 45 to 59 Minutes | 507 | 1.9% |
| 60 to 89 Minutes | 603 | 2.3% |
| 90 or more Minutes | 115 | 0.4% |
Commute Time by Sex in Tonawanda
The most common commute times in Tonawanda are 20 to 24 minutes (3,248 commuters, 23.2%) for males and 20 to 24 minutes (2,898 commuters, 22.9%) for females.
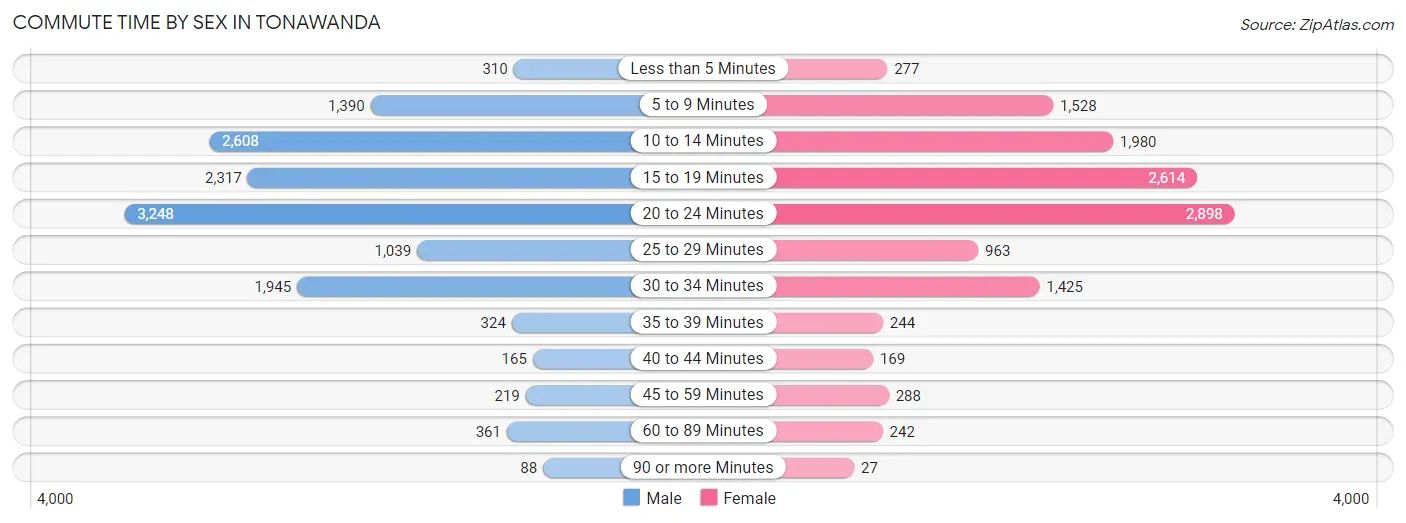
| Commute Time | Male | Female |
| Less than 5 Minutes | 310 (2.2%) | 277 (2.2%) |
| 5 to 9 Minutes | 1,390 (9.9%) | 1,528 (12.1%) |
| 10 to 14 Minutes | 2,608 (18.6%) | 1,980 (15.7%) |
| 15 to 19 Minutes | 2,317 (16.5%) | 2,614 (20.7%) |
| 20 to 24 Minutes | 3,248 (23.2%) | 2,898 (22.9%) |
| 25 to 29 Minutes | 1,039 (7.4%) | 963 (7.6%) |
| 30 to 34 Minutes | 1,945 (13.9%) | 1,425 (11.3%) |
| 35 to 39 Minutes | 324 (2.3%) | 244 (1.9%) |
| 40 to 44 Minutes | 165 (1.2%) | 169 (1.3%) |
| 45 to 59 Minutes | 219 (1.6%) | 288 (2.3%) |
| 60 to 89 Minutes | 361 (2.6%) | 242 (1.9%) |
| 90 or more Minutes | 88 (0.6%) | 27 (0.2%) |
Time of Departure to Work by Sex in Tonawanda
The most frequent times of departure to work in Tonawanda are 7:30 AM to 7:59 AM (1,975, 14.1%) for males and 7:30 AM to 7:59 AM (2,557, 20.2%) for females.
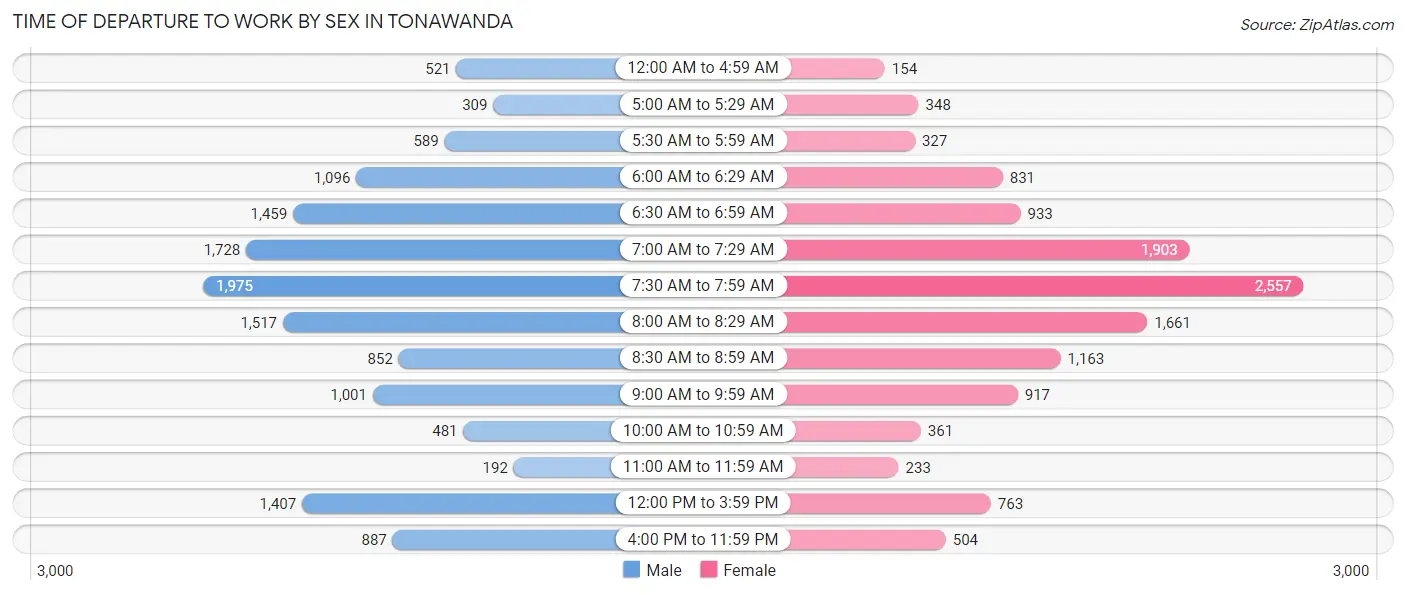
| Time of Departure | Male | Female |
| 12:00 AM to 4:59 AM | 521 (3.7%) | 154 (1.2%) |
| 5:00 AM to 5:29 AM | 309 (2.2%) | 348 (2.8%) |
| 5:30 AM to 5:59 AM | 589 (4.2%) | 327 (2.6%) |
| 6:00 AM to 6:29 AM | 1,096 (7.8%) | 831 (6.6%) |
| 6:30 AM to 6:59 AM | 1,459 (10.4%) | 933 (7.4%) |
| 7:00 AM to 7:29 AM | 1,728 (12.3%) | 1,903 (15.0%) |
| 7:30 AM to 7:59 AM | 1,975 (14.1%) | 2,557 (20.2%) |
| 8:00 AM to 8:29 AM | 1,517 (10.8%) | 1,661 (13.1%) |
| 8:30 AM to 8:59 AM | 852 (6.1%) | 1,163 (9.2%) |
| 9:00 AM to 9:59 AM | 1,001 (7.1%) | 917 (7.2%) |
| 10:00 AM to 10:59 AM | 481 (3.4%) | 361 (2.9%) |
| 11:00 AM to 11:59 AM | 192 (1.4%) | 233 (1.8%) |
| 12:00 PM to 3:59 PM | 1,407 (10.0%) | 763 (6.0%) |
| 4:00 PM to 11:59 PM | 887 (6.3%) | 504 (4.0%) |
| Total | 14,014 (100.0%) | 12,655 (100.0%) |
Housing Occupancy in Tonawanda
Occupancy by Ownership in Tonawanda
Of the total 6,876 dwellings in Tonawanda, owner-occupied units account for 5,032 (73.2%), while renter-occupied units make up 1,844 (26.8%).
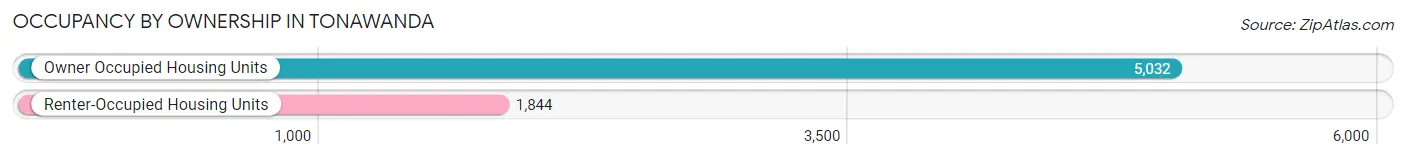
| Occupancy | # Housing Units | % Housing Units |
| Owner Occupied Housing Units | 5,032 | 73.2% |
| Renter-Occupied Housing Units | 1,844 | 26.8% |
| Total Occupied Housing Units | 6,876 | 100.0% |
Occupancy by Household Size in Tonawanda
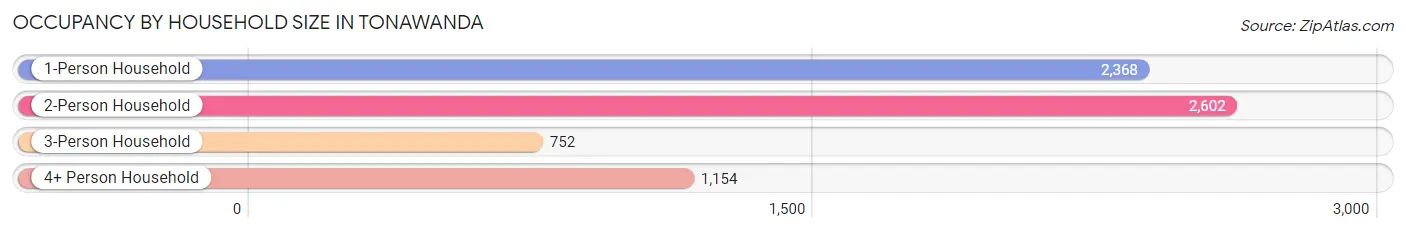
| Household Size | # Housing Units | % Housing Units |
| 1-Person Household | 2,368 | 34.4% |
| 2-Person Household | 2,602 | 37.8% |
| 3-Person Household | 752 | 10.9% |
| 4+ Person Household | 1,154 | 16.8% |
| Total Housing Units | 6,876 | 100.0% |
Occupancy by Ownership by Household Size in Tonawanda
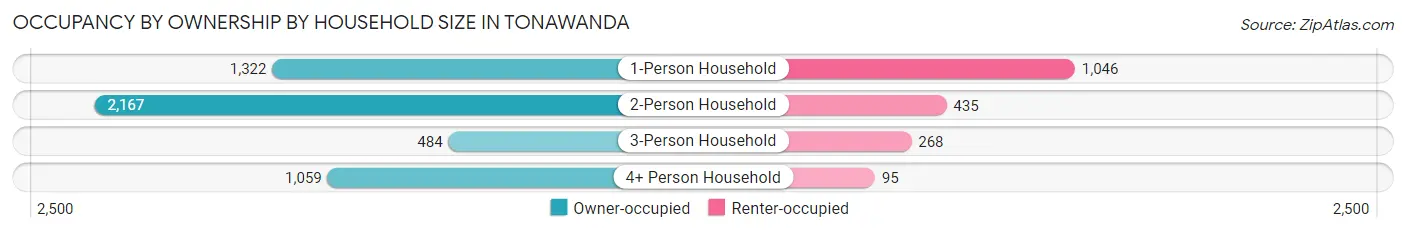
| Household Size | Owner-occupied | Renter-occupied |
| 1-Person Household | 1,322 (55.8%) | 1,046 (44.2%) |
| 2-Person Household | 2,167 (83.3%) | 435 (16.7%) |
| 3-Person Household | 484 (64.4%) | 268 (35.6%) |
| 4+ Person Household | 1,059 (91.8%) | 95 (8.2%) |
| Total Housing Units | 5,032 (73.2%) | 1,844 (26.8%) |
Occupancy by Educational Attainment in Tonawanda
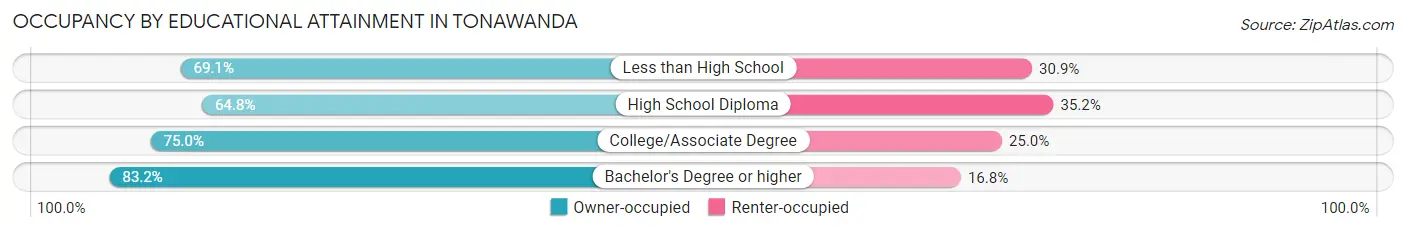
| Household Size | Owner-occupied | Renter-occupied |
| Less than High School | 306 (69.1%) | 137 (30.9%) |
| High School Diploma | 1,485 (64.8%) | 806 (35.2%) |
| College/Associate Degree | 1,881 (75.0%) | 626 (25.0%) |
| Bachelor's Degree or higher | 1,360 (83.2%) | 275 (16.8%) |
Occupancy by Age of Householder in Tonawanda
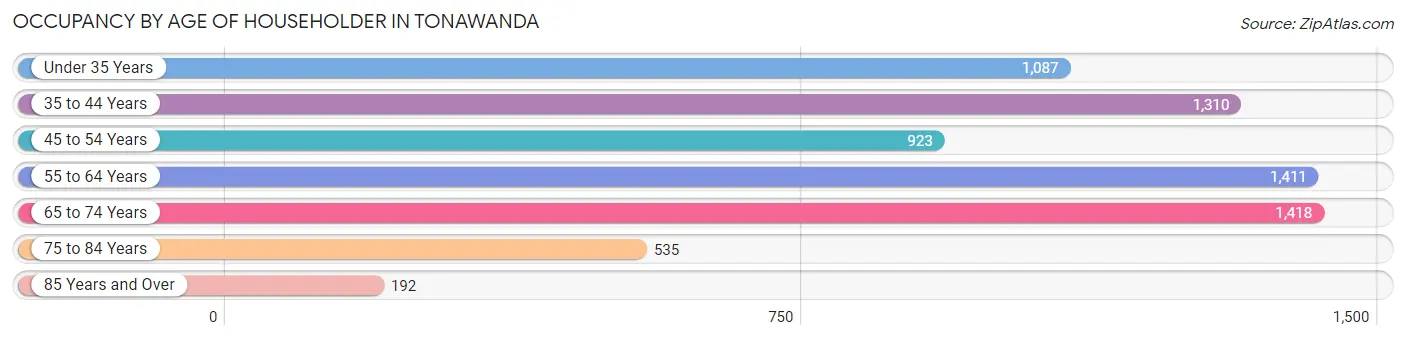
| Age Bracket | # Households | % Households |
| Under 35 Years | 1,087 | 15.8% |
| 35 to 44 Years | 1,310 | 19.1% |
| 45 to 54 Years | 923 | 13.4% |
| 55 to 64 Years | 1,411 | 20.5% |
| 65 to 74 Years | 1,418 | 20.6% |
| 75 to 84 Years | 535 | 7.8% |
| 85 Years and Over | 192 | 2.8% |
| Total | 6,876 | 100.0% |
Housing Finances in Tonawanda
Median Income by Occupancy in Tonawanda
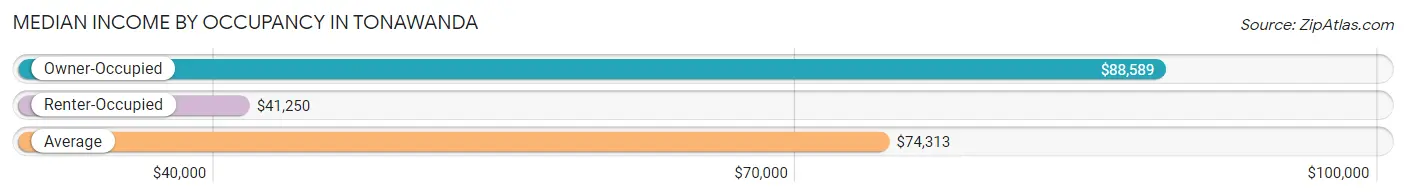
| Occupancy Type | # Households | Median Income |
| Owner-Occupied | 19,235 (72.7%) | $88,589 |
| Renter-Occupied | 7,234 (27.3%) | $41,250 |
| Average | 26,469 (100.0%) | $74,313 |
Occupancy by Householder Income Bracket in Tonawanda
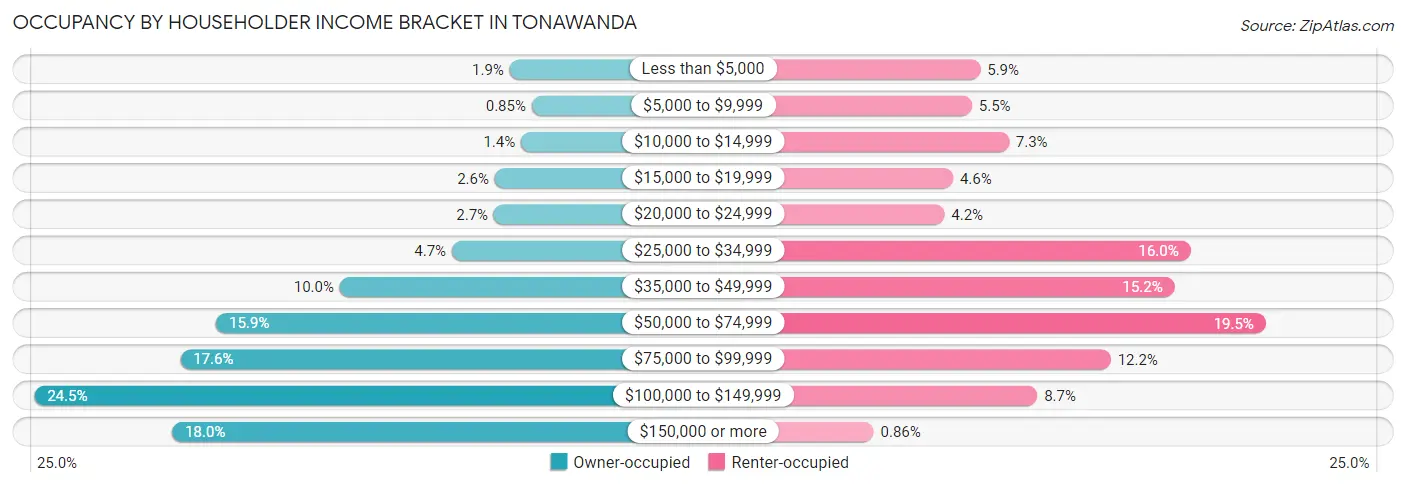
| Income Bracket | Owner-occupied | Renter-occupied |
| Less than $5,000 | 366 (1.9%) | 430 (5.9%) |
| $5,000 to $9,999 | 163 (0.9%) | 401 (5.5%) |
| $10,000 to $14,999 | 261 (1.4%) | 528 (7.3%) |
| $15,000 to $19,999 | 502 (2.6%) | 336 (4.6%) |
| $20,000 to $24,999 | 510 (2.6%) | 306 (4.2%) |
| $25,000 to $34,999 | 894 (4.6%) | 1,154 (16.0%) |
| $35,000 to $49,999 | 1,922 (10.0%) | 1,099 (15.2%) |
| $50,000 to $74,999 | 3,055 (15.9%) | 1,413 (19.5%) |
| $75,000 to $99,999 | 3,384 (17.6%) | 879 (12.1%) |
| $100,000 to $149,999 | 4,720 (24.5%) | 626 (8.6%) |
| $150,000 or more | 3,458 (18.0%) | 62 (0.9%) |
| Total | 19,235 (100.0%) | 7,234 (100.0%) |
Monthly Housing Cost Tiers in Tonawanda
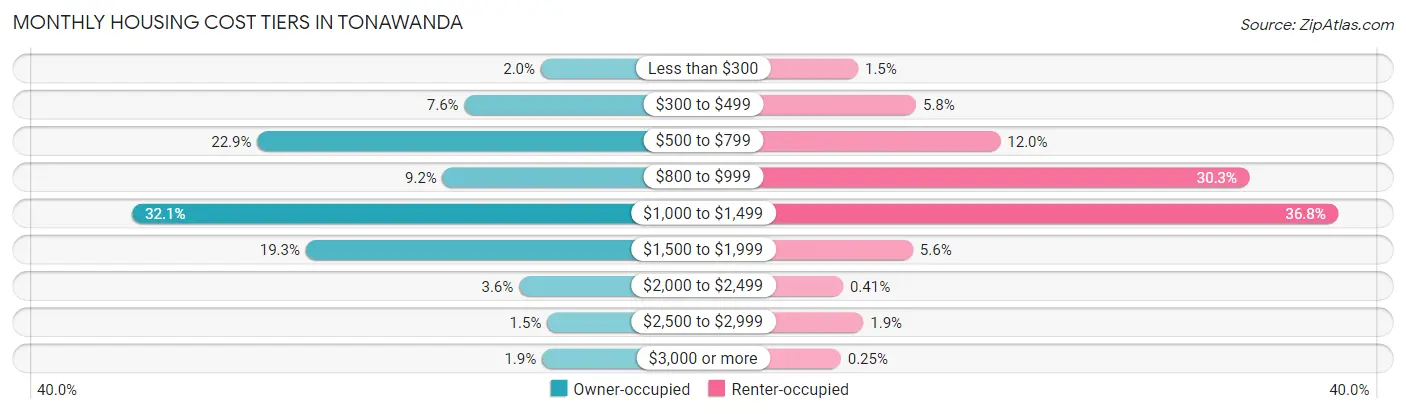
| Monthly Cost | Owner-occupied | Renter-occupied |
| Less than $300 | 381 (2.0%) | 110 (1.5%) |
| $300 to $499 | 1,464 (7.6%) | 419 (5.8%) |
| $500 to $799 | 4,397 (22.9%) | 868 (12.0%) |
| $800 to $999 | 1,771 (9.2%) | 2,192 (30.3%) |
| $1,000 to $1,499 | 6,170 (32.1%) | 2,664 (36.8%) |
| $1,500 to $1,999 | 3,710 (19.3%) | 402 (5.6%) |
| $2,000 to $2,499 | 689 (3.6%) | 30 (0.4%) |
| $2,500 to $2,999 | 290 (1.5%) | 138 (1.9%) |
| $3,000 or more | 363 (1.9%) | 18 (0.3%) |
| Total | 19,235 (100.0%) | 7,234 (100.0%) |
Physical Housing Characteristics in Tonawanda
Housing Structures in Tonawanda
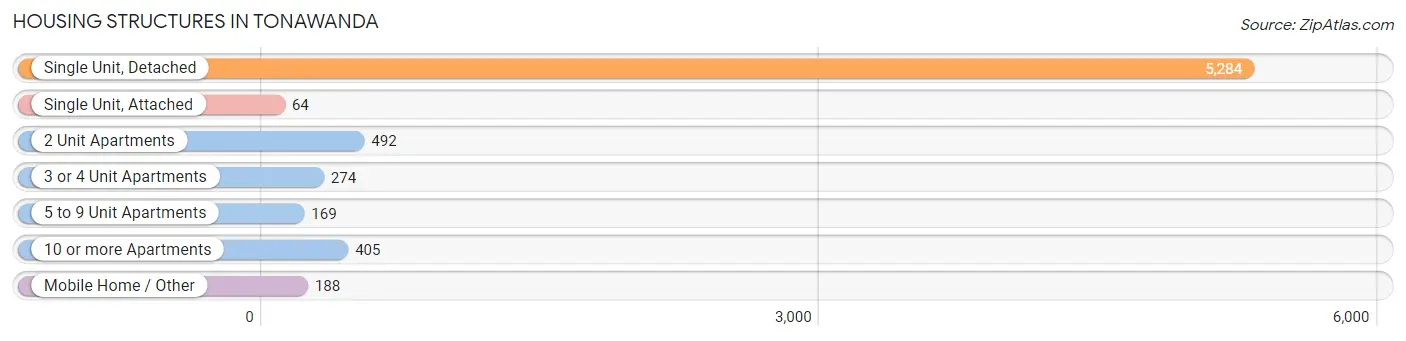
| Structure Type | # Housing Units | % Housing Units |
| Single Unit, Detached | 5,284 | 76.8% |
| Single Unit, Attached | 64 | 0.9% |
| 2 Unit Apartments | 492 | 7.2% |
| 3 or 4 Unit Apartments | 274 | 4.0% |
| 5 to 9 Unit Apartments | 169 | 2.5% |
| 10 or more Apartments | 405 | 5.9% |
| Mobile Home / Other | 188 | 2.7% |
| Total | 6,876 | 100.0% |
Housing Structures by Occupancy in Tonawanda
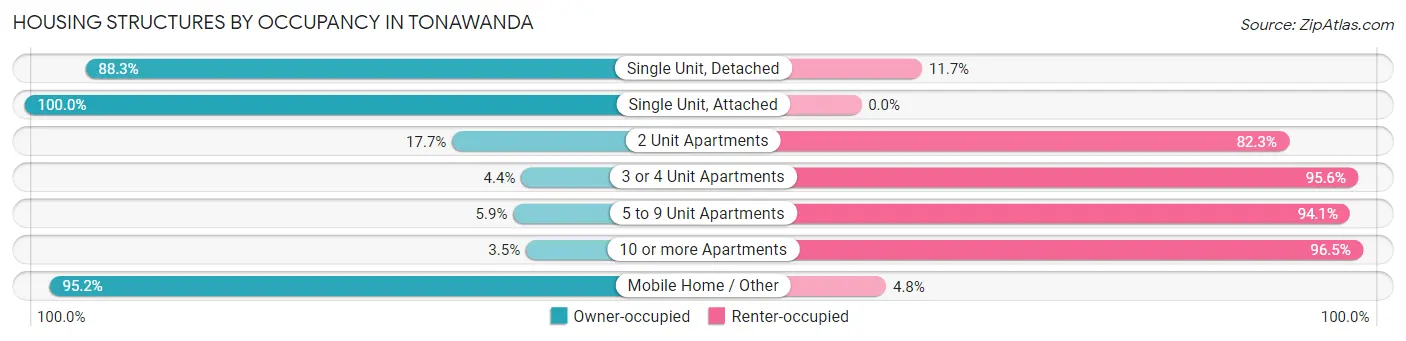
| Structure Type | Owner-occupied | Renter-occupied |
| Single Unit, Detached | 4,666 (88.3%) | 618 (11.7%) |
| Single Unit, Attached | 64 (100.0%) | 0 (0.0%) |
| 2 Unit Apartments | 87 (17.7%) | 405 (82.3%) |
| 3 or 4 Unit Apartments | 12 (4.4%) | 262 (95.6%) |
| 5 to 9 Unit Apartments | 10 (5.9%) | 159 (94.1%) |
| 10 or more Apartments | 14 (3.5%) | 391 (96.5%) |
| Mobile Home / Other | 179 (95.2%) | 9 (4.8%) |
| Total | 5,032 (73.2%) | 1,844 (26.8%) |
Housing Structures by Number of Rooms in Tonawanda
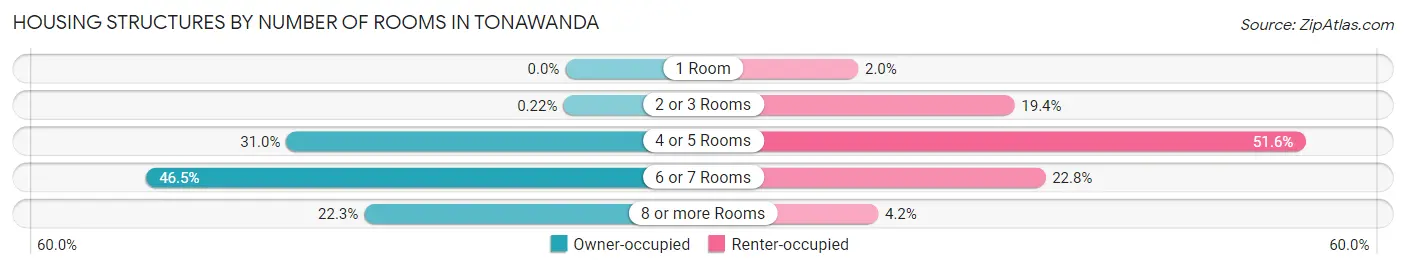
| Number of Rooms | Owner-occupied | Renter-occupied |
| 1 Room | 0 (0.0%) | 37 (2.0%) |
| 2 or 3 Rooms | 11 (0.2%) | 357 (19.4%) |
| 4 or 5 Rooms | 1,558 (31.0%) | 952 (51.6%) |
| 6 or 7 Rooms | 2,340 (46.5%) | 420 (22.8%) |
| 8 or more Rooms | 1,123 (22.3%) | 78 (4.2%) |
| Total | 5,032 (100.0%) | 1,844 (100.0%) |
Housing Structure by Heating Type in Tonawanda
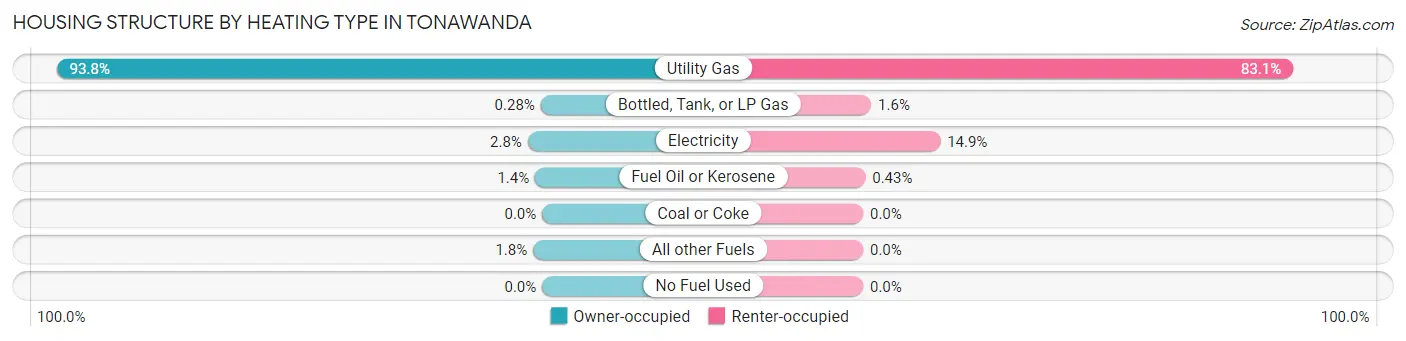
| Heating Type | Owner-occupied | Renter-occupied |
| Utility Gas | 4,721 (93.8%) | 1,532 (83.1%) |
| Bottled, Tank, or LP Gas | 14 (0.3%) | 29 (1.6%) |
| Electricity | 140 (2.8%) | 275 (14.9%) |
| Fuel Oil or Kerosene | 69 (1.4%) | 8 (0.4%) |
| Coal or Coke | 0 (0.0%) | 0 (0.0%) |
| All other Fuels | 88 (1.8%) | 0 (0.0%) |
| No Fuel Used | 0 (0.0%) | 0 (0.0%) |
| Total | 5,032 (100.0%) | 1,844 (100.0%) |
Household Vehicle Usage in Tonawanda
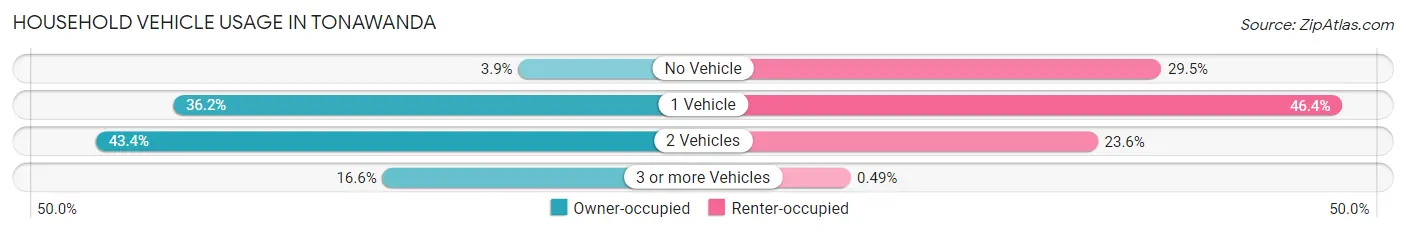
| Vehicles per Household | Owner-occupied | Renter-occupied |
| No Vehicle | 196 (3.9%) | 544 (29.5%) |
| 1 Vehicle | 1,819 (36.1%) | 856 (46.4%) |
| 2 Vehicles | 2,182 (43.4%) | 435 (23.6%) |
| 3 or more Vehicles | 835 (16.6%) | 9 (0.5%) |
| Total | 5,032 (100.0%) | 1,844 (100.0%) |
Real Estate & Mortgages in Tonawanda
Real Estate and Mortgage Overview in Tonawanda
| Characteristic | Without Mortgage | With Mortgage |
| Housing Units | 1,874 | 11,930 |
| Median Property Value | $138,000 | $182,200 |
| Median Household Income | $55,357 | $2,383 |
| Monthly Housing Costs | $620 | $312 |
| Real Estate Taxes | $3,840 | $167 |
Property Value by Mortgage Status in Tonawanda
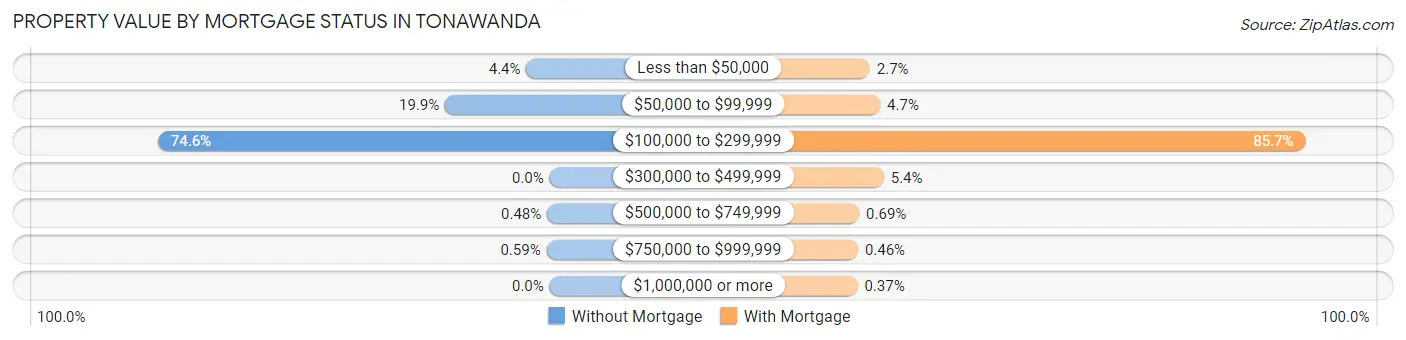
| Property Value | Without Mortgage | With Mortgage |
| Less than $50,000 | 83 (4.4%) | 324 (2.7%) |
| $50,000 to $99,999 | 373 (19.9%) | 560 (4.7%) |
| $100,000 to $299,999 | 1,398 (74.6%) | 10,223 (85.7%) |
| $300,000 to $499,999 | 0 (0.0%) | 642 (5.4%) |
| $500,000 to $749,999 | 9 (0.5%) | 82 (0.7%) |
| $750,000 to $999,999 | 11 (0.6%) | 55 (0.5%) |
| $1,000,000 or more | 0 (0.0%) | 44 (0.4%) |
| Total | 1,874 (100.0%) | 11,930 (100.0%) |
Household Income by Mortgage Status in Tonawanda
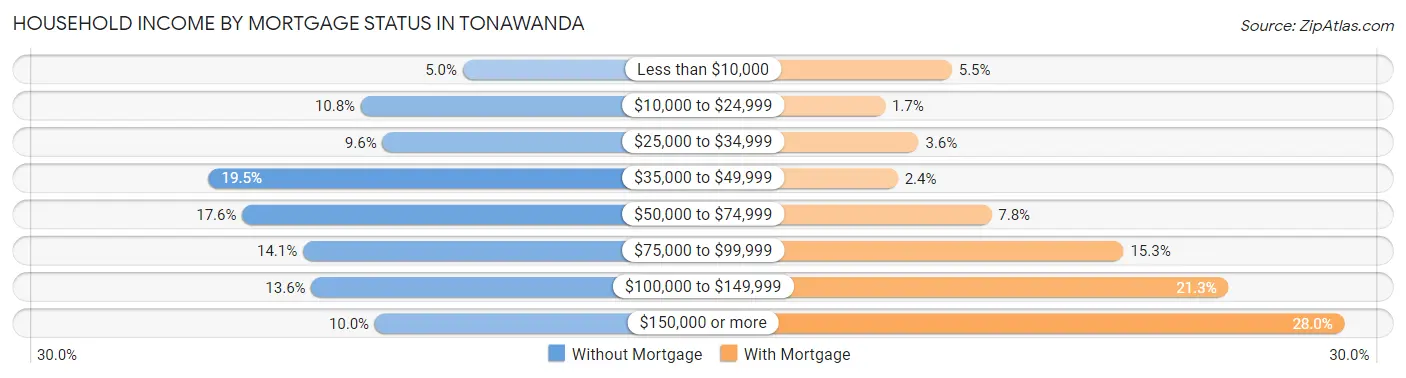
| Household Income | Without Mortgage | With Mortgage |
| Less than $10,000 | 93 (5.0%) | 656 (5.5%) |
| $10,000 to $24,999 | 202 (10.8%) | 201 (1.7%) |
| $25,000 to $34,999 | 179 (9.6%) | 430 (3.6%) |
| $35,000 to $49,999 | 365 (19.5%) | 287 (2.4%) |
| $50,000 to $74,999 | 329 (17.6%) | 926 (7.8%) |
| $75,000 to $99,999 | 264 (14.1%) | 1,827 (15.3%) |
| $100,000 to $149,999 | 255 (13.6%) | 2,542 (21.3%) |
| $150,000 or more | 187 (10.0%) | 3,334 (28.0%) |
| Total | 1,874 (100.0%) | 11,930 (100.0%) |
Property Value to Household Income Ratio in Tonawanda
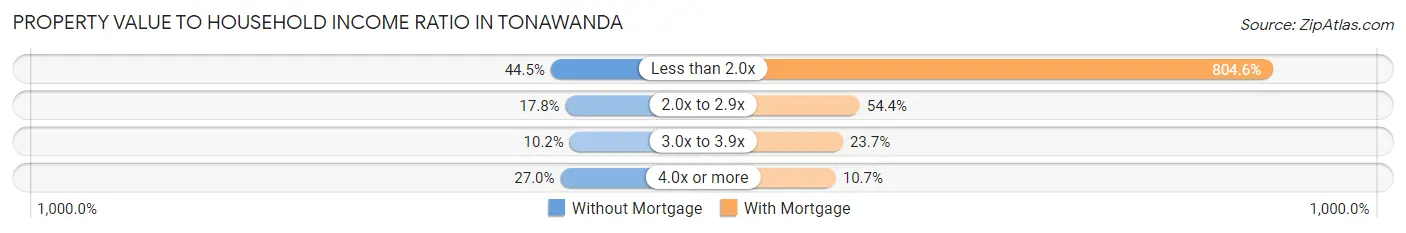
| Value-to-Income Ratio | Without Mortgage | With Mortgage |
| Less than 2.0x | 833 (44.5%) | 95,988 (804.6%) |
| 2.0x to 2.9x | 334 (17.8%) | 6,487 (54.4%) |
| 3.0x to 3.9x | 191 (10.2%) | 2,827 (23.7%) |
| 4.0x or more | 506 (27.0%) | 1,276 (10.7%) |
| Total | 1,874 (100.0%) | 11,930 (100.0%) |
Real Estate Taxes by Mortgage Status in Tonawanda
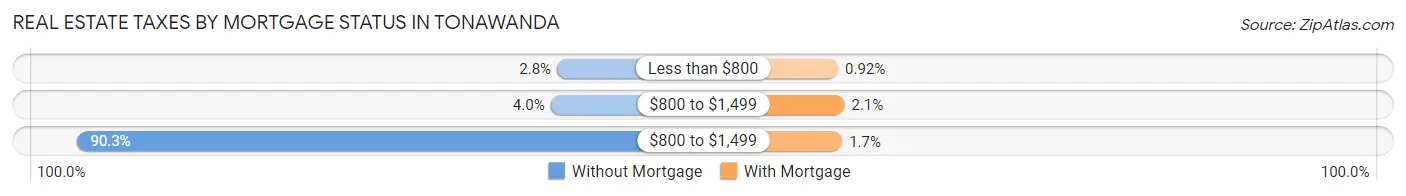
| Property Taxes | Without Mortgage | With Mortgage |
| Less than $800 | 52 (2.8%) | 110 (0.9%) |
| $800 to $1,499 | 74 (4.0%) | 250 (2.1%) |
| $800 to $1,499 | 1,693 (90.3%) | 201 (1.7%) |
| Total | 1,874 (100.0%) | 11,930 (100.0%) |
Health & Disability in Tonawanda
Health Insurance Coverage by Age in Tonawanda
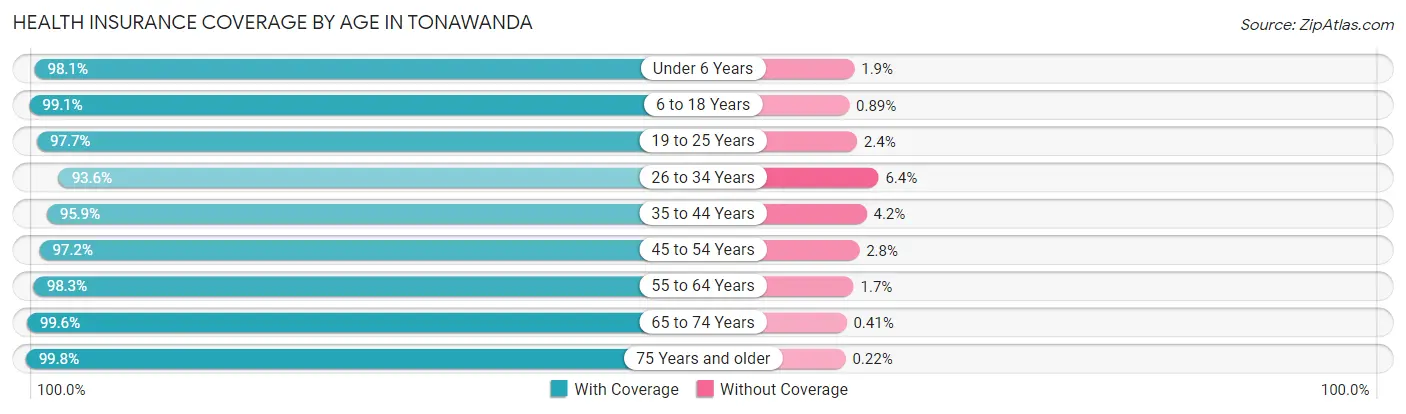
| Age Bracket | With Coverage | Without Coverage |
| Under 6 Years | 2,693 (98.1%) | 51 (1.9%) |
| 6 to 18 Years | 7,368 (99.1%) | 66 (0.9%) |
| 19 to 25 Years | 3,946 (97.7%) | 95 (2.4%) |
| 26 to 34 Years | 8,010 (93.6%) | 545 (6.4%) |
| 35 to 44 Years | 6,702 (95.9%) | 290 (4.2%) |
| 45 to 54 Years | 6,676 (97.2%) | 191 (2.8%) |
| 55 to 64 Years | 8,408 (98.3%) | 148 (1.7%) |
| 65 to 74 Years | 7,004 (99.6%) | 29 (0.4%) |
| 75 Years and older | 4,592 (99.8%) | 10 (0.2%) |
| Total | 55,399 (97.5%) | 1,425 (2.5%) |
Health Insurance Coverage by Citizenship Status in Tonawanda
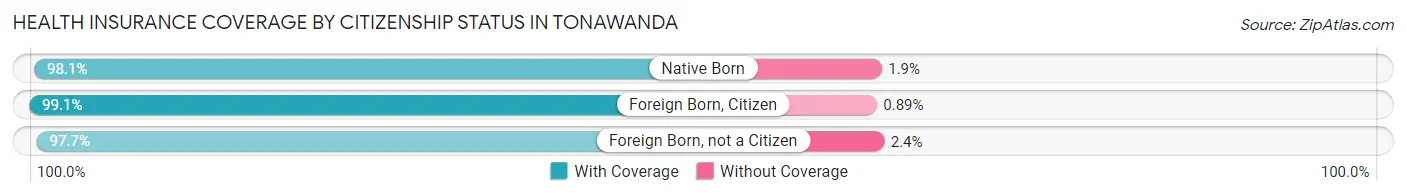
| Citizenship Status | With Coverage | Without Coverage |
| Native Born | 2,693 (98.1%) | 51 (1.9%) |
| Foreign Born, Citizen | 7,368 (99.1%) | 66 (0.9%) |
| Foreign Born, not a Citizen | 3,946 (97.7%) | 95 (2.4%) |
Health Insurance Coverage by Household Income in Tonawanda
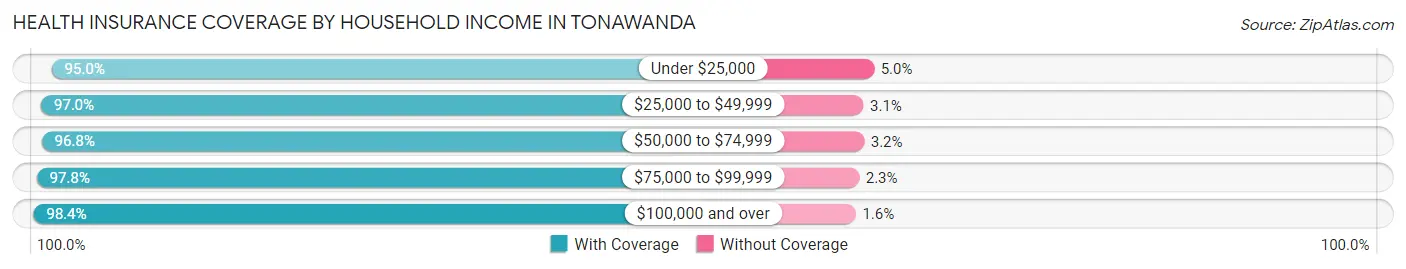
| Household Income | With Coverage | Without Coverage |
| Under $25,000 | 5,204 (95.0%) | 276 (5.0%) |
| $25,000 to $49,999 | 7,909 (97.0%) | 249 (3.0%) |
| $50,000 to $74,999 | 8,352 (96.8%) | 274 (3.2%) |
| $75,000 to $99,999 | 9,666 (97.8%) | 222 (2.2%) |
| $100,000 and over | 24,075 (98.4%) | 400 (1.6%) |
Public vs Private Health Insurance Coverage by Age in Tonawanda
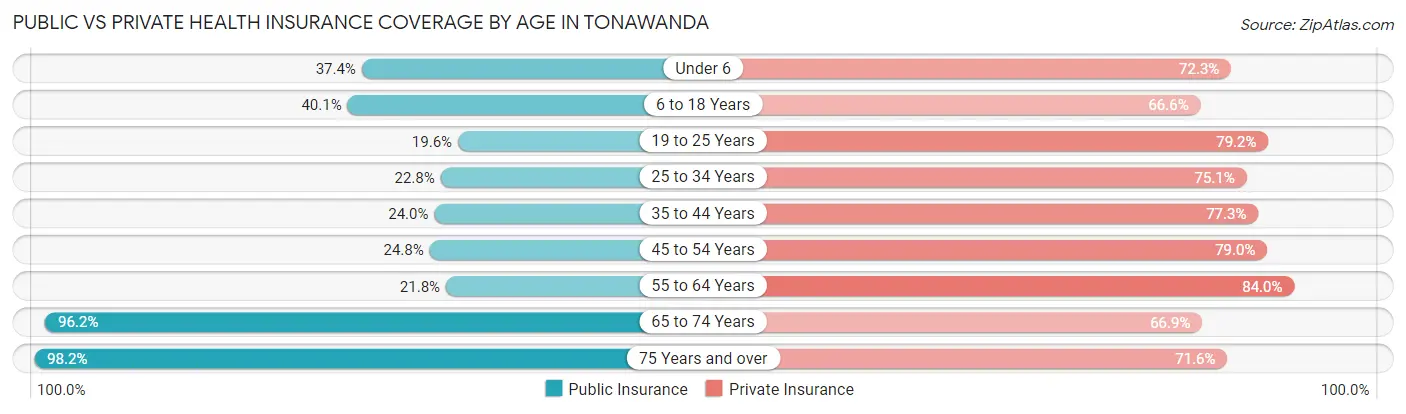
| Age Bracket | Public Insurance | Private Insurance |
| Under 6 | 1,027 (37.4%) | 1,983 (72.3%) |
| 6 to 18 Years | 2,979 (40.1%) | 4,949 (66.6%) |
| 19 to 25 Years | 791 (19.6%) | 3,199 (79.2%) |
| 25 to 34 Years | 1,950 (22.8%) | 6,428 (75.1%) |
| 35 to 44 Years | 1,675 (24.0%) | 5,404 (77.3%) |
| 45 to 54 Years | 1,705 (24.8%) | 5,422 (79.0%) |
| 55 to 64 Years | 1,865 (21.8%) | 7,186 (84.0%) |
| 65 to 74 Years | 6,766 (96.2%) | 4,705 (66.9%) |
| 75 Years and over | 4,520 (98.2%) | 3,293 (71.6%) |
| Total | 23,278 (41.0%) | 42,569 (74.9%) |
Disability Status by Sex by Age in Tonawanda
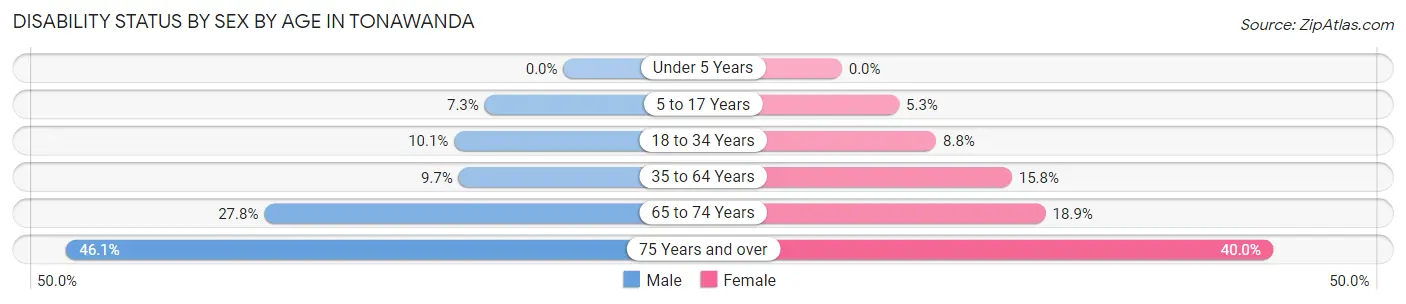
| Age Bracket | Male | Female |
| Under 5 Years | 0 (0.0%) | 0 (0.0%) |
| 5 to 17 Years | 251 (7.3%) | 200 (5.3%) |
| 18 to 34 Years | 679 (10.1%) | 564 (8.7%) |
| 35 to 64 Years | 1,066 (9.7%) | 1,808 (15.8%) |
| 65 to 74 Years | 975 (27.8%) | 666 (18.9%) |
| 75 Years and over | 778 (46.1%) | 1,166 (40.0%) |
Disability Class by Sex by Age in Tonawanda
Disability Class: Hearing Difficulty
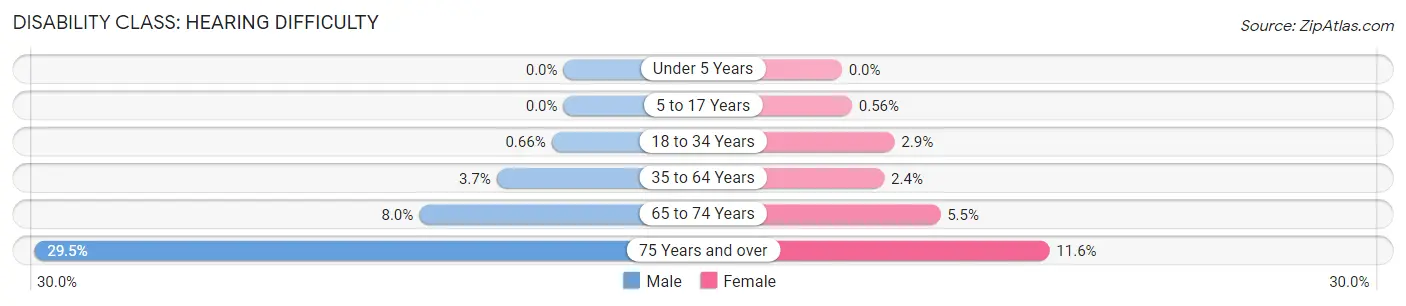
| Age Bracket | Male | Female |
| Under 5 Years | 0 (0.0%) | 0 (0.0%) |
| 5 to 17 Years | 0 (0.0%) | 21 (0.6%) |
| 18 to 34 Years | 44 (0.7%) | 189 (2.9%) |
| 35 to 64 Years | 408 (3.7%) | 270 (2.4%) |
| 65 to 74 Years | 282 (8.0%) | 193 (5.5%) |
| 75 Years and over | 497 (29.5%) | 337 (11.6%) |
Disability Class: Vision Difficulty
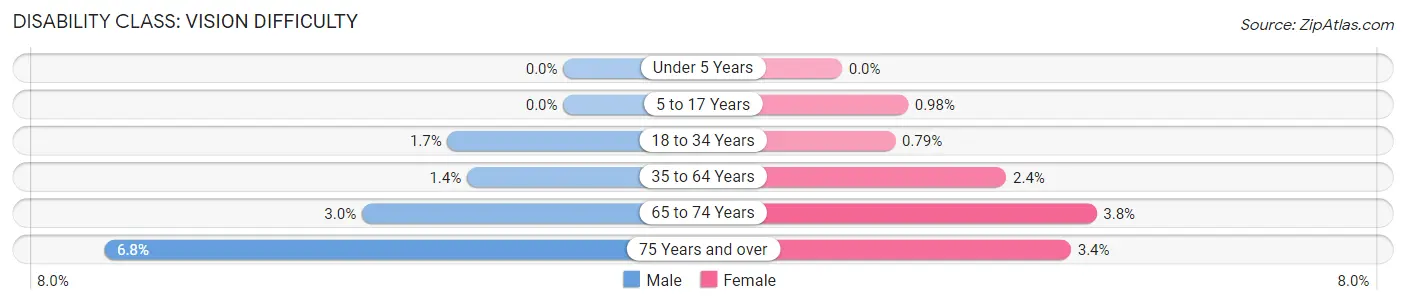
| Age Bracket | Male | Female |
| Under 5 Years | 0 (0.0%) | 0 (0.0%) |
| 5 to 17 Years | 0 (0.0%) | 37 (1.0%) |
| 18 to 34 Years | 115 (1.7%) | 51 (0.8%) |
| 35 to 64 Years | 157 (1.4%) | 279 (2.4%) |
| 65 to 74 Years | 105 (3.0%) | 133 (3.8%) |
| 75 Years and over | 115 (6.8%) | 99 (3.4%) |
Disability Class: Cognitive Difficulty
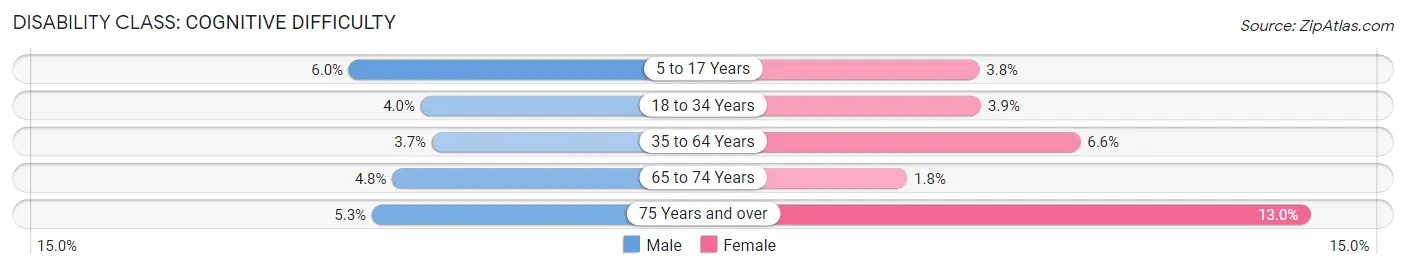
| Age Bracket | Male | Female |
| 5 to 17 Years | 205 (6.0%) | 144 (3.8%) |
| 18 to 34 Years | 266 (4.0%) | 250 (3.9%) |
| 35 to 64 Years | 401 (3.7%) | 761 (6.6%) |
| 65 to 74 Years | 167 (4.8%) | 64 (1.8%) |
| 75 Years and over | 90 (5.3%) | 380 (13.0%) |
Disability Class: Ambulatory Difficulty
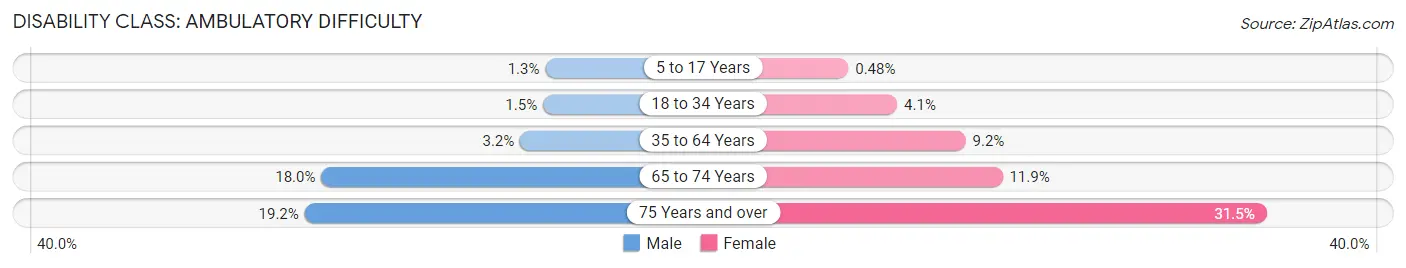
| Age Bracket | Male | Female |
| 5 to 17 Years | 46 (1.3%) | 18 (0.5%) |
| 18 to 34 Years | 101 (1.5%) | 265 (4.1%) |
| 35 to 64 Years | 352 (3.2%) | 1,053 (9.2%) |
| 65 to 74 Years | 631 (18.0%) | 420 (11.9%) |
| 75 Years and over | 324 (19.2%) | 919 (31.5%) |
Disability Class: Self-Care Difficulty
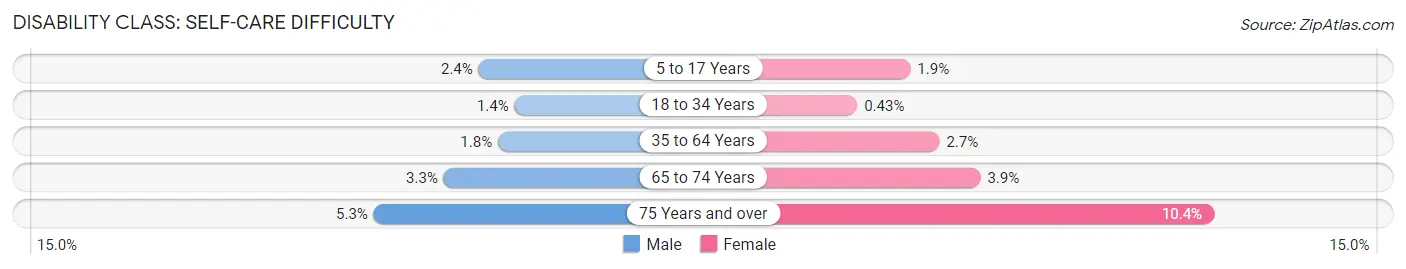
| Age Bracket | Male | Female |
| 5 to 17 Years | 81 (2.4%) | 72 (1.9%) |
| 18 to 34 Years | 91 (1.4%) | 28 (0.4%) |
| 35 to 64 Years | 199 (1.8%) | 312 (2.7%) |
| 65 to 74 Years | 117 (3.3%) | 136 (3.9%) |
| 75 Years and over | 89 (5.3%) | 302 (10.4%) |
Technology Access in Tonawanda
Computing Device Access in Tonawanda
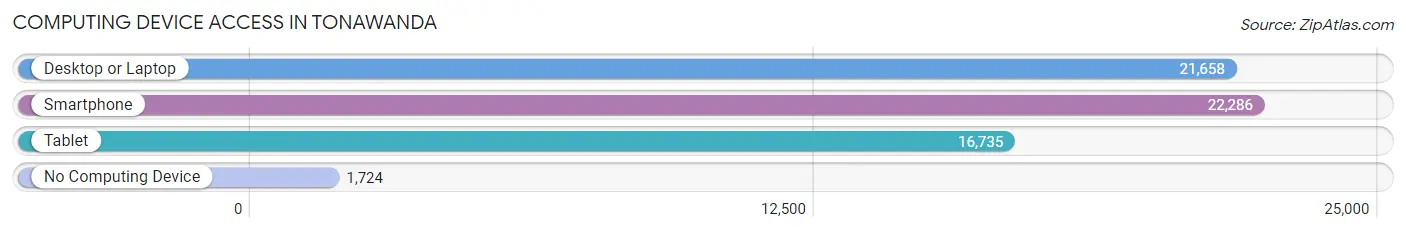
| Device Type | # Households | % Households |
| Desktop or Laptop | 21,658 | 81.8% |
| Smartphone | 22,286 | 84.2% |
| Tablet | 16,735 | 63.2% |
| No Computing Device | 1,724 | 6.5% |
| Total | 26,469 | 100.0% |
Internet Access in Tonawanda
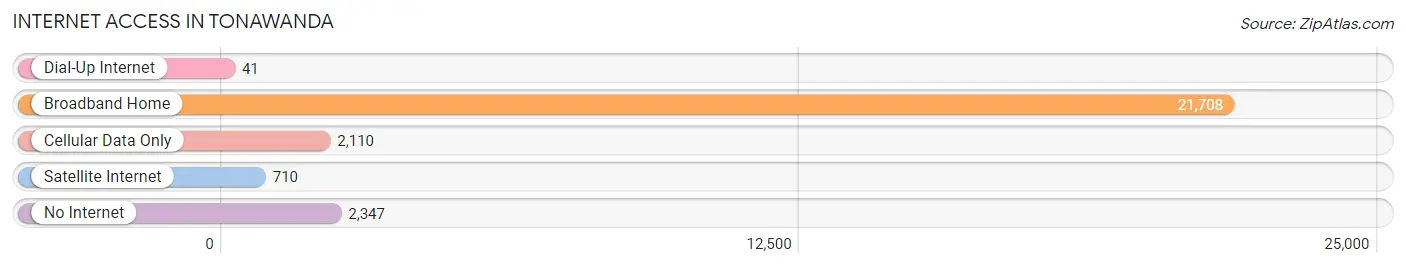
| Internet Type | # Households | % Households |
| Dial-Up Internet | 41 | 0.2% |
| Broadband Home | 21,708 | 82.0% |
| Cellular Data Only | 2,110 | 8.0% |
| Satellite Internet | 710 | 2.7% |
| No Internet | 2,347 | 8.9% |
| Total | 26,469 | 100.0% |
Tonawanda Summary
Tonawanda is a town located in Erie County, New York, United States. It is situated on the Niagara River, just north of the city of Buffalo. The town is part of the Buffalo-Niagara Falls metropolitan area and has a population of approximately 15,000 people.
History
The area that is now Tonawanda was originally inhabited by the Neutral Nation of the Iroquois Confederacy. The first European settlers arrived in the area in the late 1700s, and the town was officially established in 1836. The town was named after the Tonawanda Creek, which flows through the area.
The town grew rapidly in the late 1800s and early 1900s, due to its proximity to Buffalo and the Niagara River. The town was home to several industries, including a steel mill, a paper mill, and a brickyard. The town also had a thriving agricultural industry, with many farms producing dairy products, fruits, and vegetables.
In the mid-1900s, the town began to decline as industry moved away and the population decreased. However, in recent years, the town has seen a resurgence in population and economic activity.
Geography
Tonawanda is located in western New York, just north of the city of Buffalo. It is situated on the Niagara River, and is bordered by the towns of Grand Island, Amherst, and North Tonawanda. The town covers an area of approximately 10 square miles, and has a population density of 1,500 people per square mile.
The town is located in a region of rolling hills and valleys, and is home to several parks and recreational areas. The Niagara River provides a variety of recreational activities, including fishing, boating, and swimming.
Economy
Tonawanda’s economy is largely based on manufacturing and services. The town is home to several large manufacturing companies, including General Motors, Ford, and Delphi. The town also has a thriving retail sector, with several large shopping centers and malls.
The town is also home to several educational institutions, including the University at Buffalo, Buffalo State College, and Niagara University. These institutions provide a variety of educational and employment opportunities for the town’s residents.
Demographics
As of the 2010 census, the town had a population of 15,130 people. The racial makeup of the town was 94.3% White, 2.2% African American, 0.7% Native American, 0.9% Asian, 0.1% Pacific Islander, and 1.8% from other races. Hispanic or Latino of any race were 4.2% of the population.
The median household income in the town was $45,845, and the median family income was $54,845. The per capita income for the town was $22,845. About 8.3% of families and 10.7% of the population were below the poverty line.
Tonawanda is a diverse and vibrant community, with a rich history and a bright future. The town is home to a variety of businesses, educational institutions, and recreational activities, making it an ideal place to live and work.
Common Questions
What is Per Capita Income in Tonawanda?
Per Capita income in Tonawanda is $41,343.
What is the Median Family Income in Tonawanda?
Median Family Income in Tonawanda is $94,315.
What is the Median Household income in Tonawanda?
Median Household Income in Tonawanda is $74,313.
What is Income or Wage Gap in Tonawanda?
Income or Wage Gap in Tonawanda is 12.8%.
Women in Tonawanda earn 87.2 cents for every dollar earned by a man.
What is Family Income Deficit in Tonawanda?
Family Income Deficit in Tonawanda is $9,919.
Families that are below poverty line in Tonawanda earn $9,919 less on average than the poverty threshold level.
What is Inequality or Gini Index in Tonawanda?
Inequality or Gini Index in Tonawanda is 0.41.
What is the Total Population of Tonawanda?
Total Population of Tonawanda is 57,210.
What is the Total Male Population of Tonawanda?
Total Male Population of Tonawanda is 27,834.
What is the Total Female Population of Tonawanda?
Total Female Population of Tonawanda is 29,376.
What is the Ratio of Males per 100 Females in Tonawanda?
There are 94.75 Males per 100 Females in Tonawanda.
What is the Ratio of Females per 100 Males in Tonawanda?
There are 105.54 Females per 100 Males in Tonawanda.
What is the Median Population Age in Tonawanda?
Median Population Age in Tonawanda is 42.9 Years.
What is the Average Family Size in Tonawanda
Average Family Size in Tonawanda is 2.8 People.
What is the Average Household Size in Tonawanda
Average Household Size in Tonawanda is 2.1 People.
How Large is the Labor Force in Tonawanda?
There are 32,100 People in the Labor Forcein in Tonawanda.
What is the Percentage of People in the Labor Force in Tonawanda?
65.5% of People are in the Labor Force in Tonawanda.
What is the Unemployment Rate in Tonawanda?
Unemployment Rate in Tonawanda is 3.9%.