Zip Codes with the Highest Percentage of Households with Income Above $200,000 in Minneapolis, MN

RELATED REPORTS & OPTIONS

Household Income | $200k+
Population
Families and Households
Female Fertility
Female Fertility (Unmarried)
Race (Community Size)
Race (Percentage)
Ancestry (Community Size)
AfghanAfricanAlaska NativeAlbanianAlsatianAmericanApacheArabArgentineanArmenianAssyrian / Chaldean / SyriacAustralianAustrianBahamianBangladeshiBarbadianBasqueBelgianBelizeanBhutaneseBlackfeetBolivianBrazilianBritishBritish West IndianBulgarianBurmeseCajunCambodianCanadianCape VerdeanCarpatho RusynCelticCentral AmericanCentral American IndianCherokeeCheyenneChickasawChileanChippewaChoctawColombianComancheCosta RicanCreeCreekCroatianCrowCubanCypriotCzechCzechoslovakianDanishDominicanDutchEastern EuropeanEcuadorianEgyptianEnglishEstonianEthiopianEuropeanFijianFilipinoFinnishFrenchFrench American IndianFrench CanadianGermanGerman RussianGhanaianGreekGuamanian / ChamorroGuatemalanGuyaneseHaitianHonduranHungarianIcelanderIndian (Asian)IndonesianInupiatIranianIraqiIrishIroquoisIsraeliItalianJamaicanJapaneseJordanianKenyanKoreanLaotianLatvianLebaneseLiberianLithuanianLuxembourgerMacedonianMalaysianMalteseMenomineeMexicanMexican American IndianMongolianMoroccanNative HawaiianNavajoNicaraguanNigerianNorthern EuropeanNorwegianOkinawanOsagePakistaniPalestinianPanamanianParaguayanPennsylvania GermanPeruvianPolishPortuguesePotawatomiPuerto RicanRomanianRussianSalvadoranSamoanScandinavianScotch-IrishScottishSenegaleseSerbianSierra LeoneanSiouxSlavicSlovakSloveneSomaliSouth AfricanSouth AmericanSouth American IndianSoviet UnionSpaniardSpanishSri LankanSubsaharan AfricanSudaneseSwedishSwissSyrianThaiTonganTrinidadian and TobagonianTurkishUgandanUkrainianUruguayanVenezuelanVietnameseWelshWest IndianYugoslavian
Ancestry (Percentage)
AfghanAfricanAlaska NativeAlbanianAlsatianAmericanApacheArabArgentineanArmenianAssyrian / Chaldean / SyriacAustralianAustrianBahamianBangladeshiBarbadianBasqueBelgianBelizeanBhutaneseBlackfeetBolivianBrazilianBritishBritish West IndianBulgarianBurmeseCajunCambodianCanadianCape VerdeanCarpatho RusynCelticCentral AmericanCentral American IndianCherokeeCheyenneChickasawChileanChippewaChoctawColombianComancheCosta RicanCreeCreekCroatianCrowCubanCypriotCzechCzechoslovakianDanishDominicanDutchEastern EuropeanEcuadorianEgyptianEnglishEstonianEthiopianEuropeanFijianFilipinoFinnishFrenchFrench American IndianFrench CanadianGermanGerman RussianGhanaianGreekGuamanian / ChamorroGuatemalanGuyaneseHaitianHonduranHungarianIcelanderIndian (Asian)IndonesianInupiatIranianIraqiIrishIroquoisIsraeliItalianJamaicanJapaneseJordanianKenyanKoreanLaotianLatvianLebaneseLiberianLithuanianLuxembourgerMacedonianMalaysianMalteseMenomineeMexicanMexican American IndianMongolianMoroccanNative HawaiianNavajoNicaraguanNigerianNorthern EuropeanNorwegianOkinawanOsagePakistaniPalestinianPanamanianParaguayanPennsylvania GermanPeruvianPolishPortuguesePotawatomiPuerto RicanRomanianRussianSalvadoranSamoanScandinavianScotch-IrishScottishSenegaleseSerbianSierra LeoneanSiouxSlavicSlovakSloveneSomaliSouth AfricanSouth AmericanSouth American IndianSoviet UnionSpaniardSpanishSri LankanSubsaharan AfricanSudaneseSwedishSwissSyrianThaiTonganTrinidadian and TobagonianTurkishUgandanUkrainianUruguayanVenezuelanVietnameseWelshWest IndianYugoslavian
Immigrant Origin (Total)
AfghanistanAfricaAlbaniaArgentinaAsiaAustraliaAustriaBahamasBangladeshBarbadosBelarusBelgiumBelizeBoliviaBosnia and HerzegovinaBrazilBulgariaBurma / MyanmarCabo VerdeCambodiaCameroonCanadaCaribbeanCentral AmericaChileChinaColombiaCongoCosta RicaCroatiaCubaCzechoslovakiaDenmarkDominican RepublicEastern AfricaEastern AsiaEastern EuropeEcuadorEgyptEl SalvadorEnglandEritreaEthiopiaEuropeFranceGermanyGhanaGreeceGuatemalaGuyanaHaitiHondurasHong KongHungaryIndiaIndonesiaIranIraqIrelandIsraelItalyJamaicaJapanJordanKazakhstanKenyaKoreaKuwaitLaosLatin AmericaLatviaLebanonLiberiaLithuaniaMalaysiaMexicoMicronesiaMiddle AfricaMoldovaMoroccoNepalNetherlandsNicaraguaNigeriaNorthern AfricaNorthern EuropeNorwayOceaniaPakistanPanamaPeruPhilippinesPolandRomaniaRussiaSaudi ArabiaScotlandSenegalSerbiaSierra LeoneSingaporeSomaliaSouth AfricaSouth AmericaSouth Central AsiaSouth Eastern AsiaSouthern EuropeSpainSri LankaSudanSwedenSwitzerlandSyriaTaiwanThailandTrinidad and TobagoTurkeyUgandaUkraineUruguayUzbekistanVenezuelaVietnamWestern AfricaWestern AsiaWestern EuropeYemenZaireZimbabwe
Immigrant Origin (Percentage)
AfghanistanAfricaAlbaniaArgentinaAsiaAustraliaAustriaBahamasBangladeshBarbadosBelarusBelgiumBelizeBoliviaBosnia and HerzegovinaBrazilBulgariaBurma / MyanmarCabo VerdeCambodiaCameroonCanadaCaribbeanCentral AmericaChileChinaColombiaCongoCosta RicaCroatiaCubaCzechoslovakiaDenmarkDominican RepublicEastern AfricaEastern AsiaEastern EuropeEcuadorEgyptEl SalvadorEnglandEritreaEthiopiaEuropeFranceGermanyGhanaGreeceGuatemalaGuyanaHaitiHondurasHong KongHungaryIndiaIndonesiaIranIraqIrelandIsraelItalyJamaicaJapanJordanKazakhstanKenyaKoreaKuwaitLaosLatin AmericaLatviaLebanonLiberiaLithuaniaMalaysiaMexicoMicronesiaMiddle AfricaMoldovaMoroccoNepalNetherlandsNicaraguaNigeriaNorthern AfricaNorthern EuropeNorwayOceaniaPakistanPanamaPeruPhilippinesPolandRomaniaRussiaSaudi ArabiaScotlandSenegalSerbiaSierra LeoneSingaporeSomaliaSouth AfricaSouth AmericaSouth Central AsiaSouth Eastern AsiaSouthern EuropeSpainSri LankaSudanSwedenSwitzerlandSyriaTaiwanThailandTrinidad and TobagoTurkeyUgandaUkraineUruguayUzbekistanVenezuelaVietnamWestern AfricaWestern AsiaWestern EuropeYemenZaireZimbabwe
Income
Income (Families)
Income (Households)
Poverty
Poverty (Families)
Unemployment
Employment Occupations
Employment Industries
Employer Class
Commute Time
Commute Means
School Enrollment
Education by Degree Field
Occupancy
Finances
Physical Characteristics
Minneapolis
Compare Zip Codes
Comparison Subject

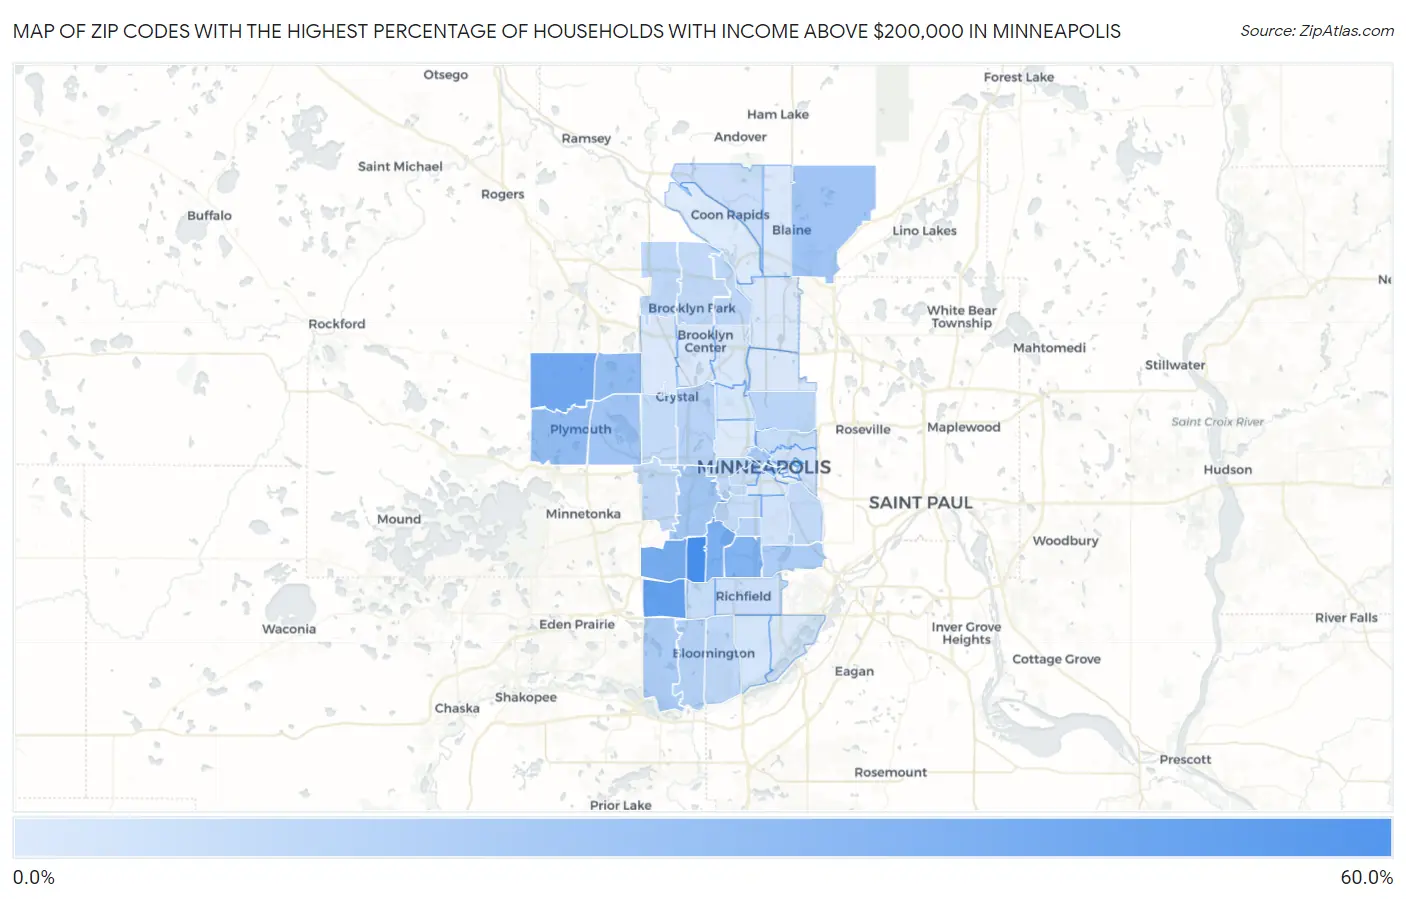
Map of Zip Codes with the Highest Percentage of Households with Income Above $200,000 in Minneapolis

0.0%
60.0%
Zip Codes with the Highest Percentage of Households with Income Above $200,000 in Minneapolis Map

Zip Codes with the Highest Percentage of Households with Income Above $200,000 in Minneapolis, MN

Zip Code Households with Income > $200k vs State vs National
1.5542453.6%11.9%(+41.7)#111.4%(+42.2)#201
2.5543942.7%11.9%(+30.8)#211.4%(+31.3)#519
3.5544637.7%11.9%(+25.8)#911.4%(+26.3)#788
4.5543635.6%11.9%(+23.7)#1211.4%(+24.2)#930
5.5541034.2%11.9%(+22.3)#1311.4%(+22.8)#1,040
6.5541931.5%11.9%(+19.6)#1811.4%(+20.1)#1,294
7.5544227.0%11.9%(+15.1)#3111.4%(+15.6)#1,883
8.5544726.2%11.9%(+14.3)#3411.4%(+14.8)#2,001
9.5541522.9%11.9%(+11.0)#4111.4%(+11.5)#2,583
10.5544122.0%11.9%(+10.1)#4611.4%(+10.6)#2,780
11.5544921.6%11.9%(+9.70)#4811.4%(+10.2)#2,867
12.5541621.0%11.9%(+9.10)#5211.4%(+9.60)#3,020
13.5540119.3%11.9%(+7.40)#6111.4%(+7.90)#3,494
14.5541718.3%11.9%(+6.40)#6711.4%(+6.90)#3,749
15.5543818.1%11.9%(+6.20)#6911.4%(+6.70)#3,822
16.5543715.4%11.9%(+3.50)#8711.4%(+4.00)#4,810
17.5540915.0%11.9%(+3.10)#9011.4%(+3.60)#4,989
18.5542214.8%11.9%(+2.90)#9311.4%(+3.40)#5,077
19.5541813.8%11.9%(+1.90)#10411.4%(+2.40)#5,564
20.5543112.9%11.9%(+1.000)#11511.4%(+1.50)#6,084
21.5544412.8%11.9%(+0.900)#11611.4%(+1.40)#6,135
22.5544512.7%11.9%(+0.800)#12011.4%(+1.30)#6,211
23.5542612.3%11.9%(+0.400)#12611.4%(+0.900)#6,467
24.5544312.2%11.9%(+0.300)#12811.4%(+0.800)#6,530
25.5540512.1%11.9%(+0.200)#12911.4%(+0.700)#6,610
26.5540611.8%11.9%(-0.100)#13811.4%(+0.400)#6,794
27.5542711.2%11.9%(-0.700)#15111.4%(-0.200)#7,231
28.5543511.1%11.9%(-0.800)#15411.4%(-0.300)#7,324
29.5541310.8%11.9%(-1.10)#16111.4%(-0.600)#7,545
30.5540810.0%11.9%(-1.90)#17811.4%(-1.40)#8,248
31.554239.8%11.9%(-2.10)#19111.4%(-1.60)#8,439
32.554039.8%11.9%(-2.10)#19311.4%(-1.60)#8,456
33.554489.2%11.9%(-2.70)#21911.4%(-2.20)#9,039
34.554077.6%11.9%(-4.30)#28411.4%(-3.80)#10,901
35.554147.5%11.9%(-4.40)#29111.4%(-3.90)#11,040
36.554026.8%11.9%(-5.10)#34011.4%(-4.60)#12,183
37.554206.6%11.9%(-5.30)#34711.4%(-4.80)#12,415
38.554126.2%11.9%(-5.70)#37811.4%(-5.20)#13,088
39.554215.9%11.9%(-6.00)#40711.4%(-5.50)#13,636
40.554345.2%11.9%(-6.70)#47711.4%(-6.20)#15,089
41.554325.2%11.9%(-6.70)#47811.4%(-6.20)#15,090
42.554295.1%11.9%(-6.80)#48511.4%(-6.30)#15,323
43.554045.0%11.9%(-6.90)#49211.4%(-6.40)#15,580
44.554305.0%11.9%(-6.90)#49311.4%(-6.40)#15,588
45.554284.8%11.9%(-7.10)#51611.4%(-6.60)#16,046
46.554254.8%11.9%(-7.10)#51711.4%(-6.60)#16,100
47.554114.7%11.9%(-7.20)#52611.4%(-6.70)#16,275
48.554334.4%11.9%(-7.50)#55511.4%(-7.00)#17,015

Common Questions

What are the Top 10 Zip Codes with the Highest Percentage of Households with Income Above $200,000 in Minneapolis, MN?
Top 10 Zip Codes with the Highest Percentage of Households with Income Above $200,000 in Minneapolis, MN are:
#1
53.6%
#2
42.7%
#3
37.7%
#4
35.6%
#5
34.2%
#6
31.5%
#7
27.0%
#8
26.2%
#9
22.9%
#10
22.0%
What zip code has the Highest Percentage of Households with Income Above $200,000 in Minneapolis, MN?
55424 has the Highest Percentage of Households with Income Above $200,000 in Minneapolis, MN with 53.6%.
What is the Percentage of Households with Income Above $200,000 in Minneapolis, MN?
Percentage of Households with Income Above $200,000 in Minneapolis is 12.6%.
What is the Percentage of Households with Income Above $200,000 in Minnesota?
Percentage of Households with Income Above $200,000 in Minnesota is 11.9%.
What is the Percentage of Households with Income Above $200,000 in the United States?
Percentage of Households with Income Above $200,000 in the United States is 11.4%.