Zip Codes with the Highest Percentage of Population Employed in Community & Social Service in Michigan
RELATED REPORTS & OPTIONS
Community & Social Service
Michigan
Compare Zip Codes
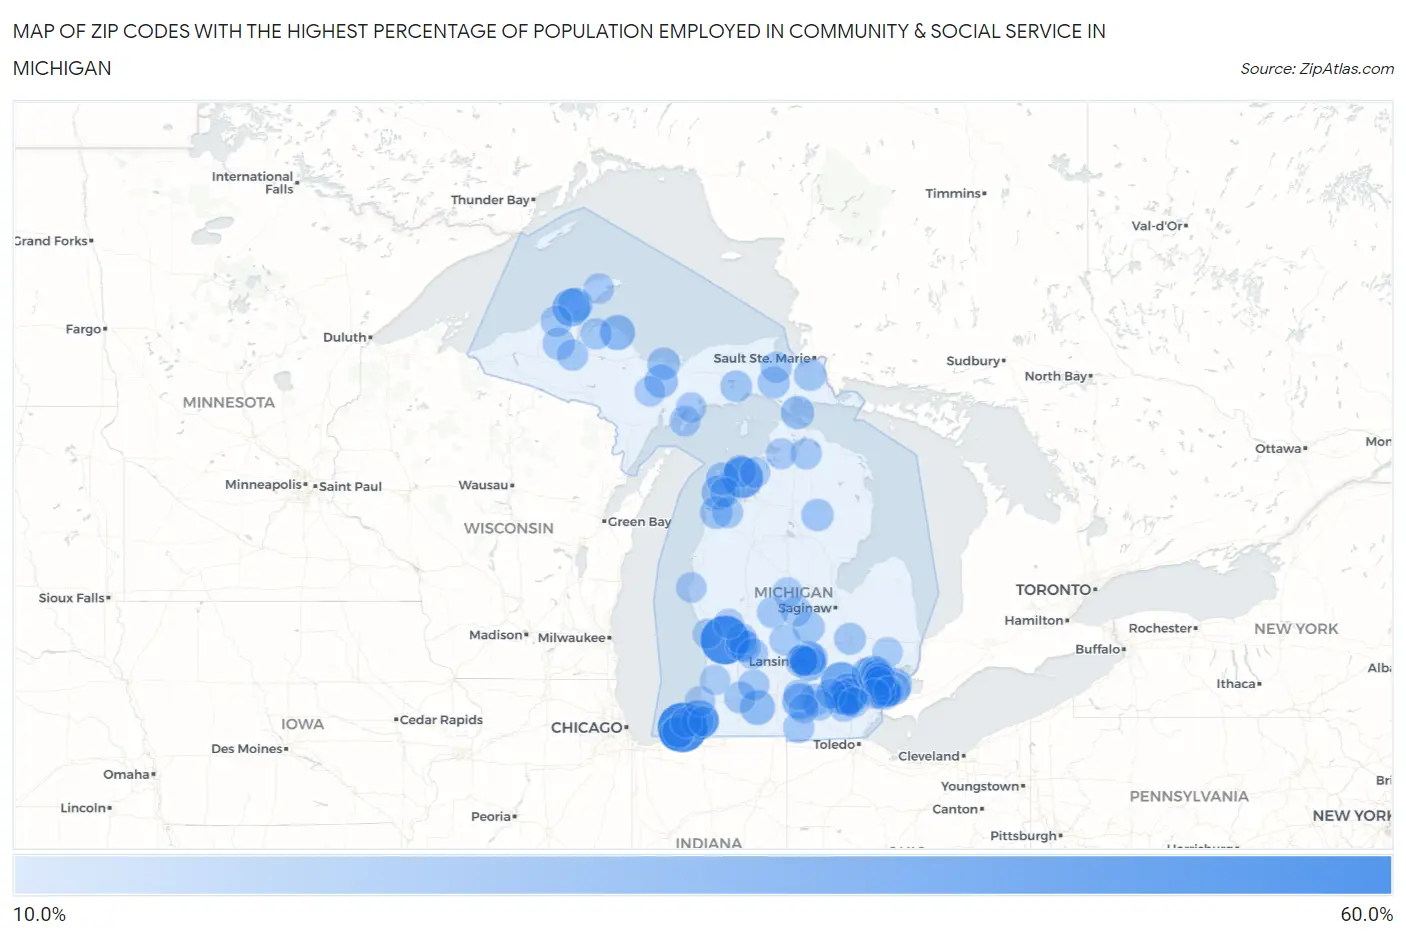
Map of Zip Codes with the Highest Percentage of Population Employed in Community & Social Service in Michigan
10.0%
60.0%
Zip Codes with the Highest Percentage of Population Employed in Community & Social Service in Michigan
| Zip Code | % Employed | vs State | vs National | |
| 1. | 49115 | 51.9% | 9.7%(+42.2)#1 | 11.2%(+40.7)#138 |
| 2. | 49430 | 50.0% | 9.7%(+40.3)#2 | 11.2%(+38.8)#166 |
| 3. | 49674 | 34.8% | 9.7%(+25.1)#3 | 11.2%(+23.6)#396 |
| 4. | 48143 | 34.5% | 9.7%(+24.8)#4 | 11.2%(+23.3)#403 |
| 5. | 49104 | 32.4% | 9.7%(+22.8)#5 | 11.2%(+21.2)#469 |
| 6. | 48105 | 29.9% | 9.7%(+20.2)#6 | 11.2%(+18.7)#591 |
| 7. | 48104 | 28.6% | 9.7%(+18.9)#7 | 11.2%(+17.4)#656 |
| 8. | 49931 | 27.9% | 9.7%(+18.2)#8 | 11.2%(+16.6)#701 |
| 9. | 48070 | 26.8% | 9.7%(+17.1)#9 | 11.2%(+15.6)#798 |
| 10. | 49283 | 23.8% | 9.7%(+14.2)#10 | 11.2%(+12.6)#1,132 |
| 11. | 48109 | 23.2% | 9.7%(+13.5)#11 | 11.2%(+12.0)#1,251 |
| 12. | 49808 | 23.0% | 9.7%(+13.3)#12 | 11.2%(+11.8)#1,282 |
| 13. | 48823 | 22.6% | 9.7%(+13.0)#13 | 11.2%(+11.4)#1,337 |
| 14. | 49052 | 22.3% | 9.7%(+12.7)#14 | 11.2%(+11.1)#1,393 |
| 15. | 48864 | 22.2% | 9.7%(+12.5)#15 | 11.2%(+11.0)#1,416 |
| 16. | 49930 | 22.1% | 9.7%(+12.4)#16 | 11.2%(+10.8)#1,472 |
| 17. | 49636 | 21.3% | 9.7%(+11.6)#17 | 11.2%(+10.1)#1,636 |
| 18. | 48216 | 20.7% | 9.7%(+11.0)#18 | 11.2%(+9.50)#1,808 |
| 19. | 48069 | 20.5% | 9.7%(+10.9)#19 | 11.2%(+9.33)#1,851 |
| 20. | 48236 | 20.3% | 9.7%(+10.6)#20 | 11.2%(+9.11)#1,924 |
| 21. | 48103 | 20.1% | 9.7%(+10.5)#21 | 11.2%(+8.93)#1,977 |
| 22. | 49117 | 20.1% | 9.7%(+10.4)#22 | 11.2%(+8.85)#1,993 |
| 23. | 48230 | 19.7% | 9.7%(+10.1)#23 | 11.2%(+8.53)#2,110 |
| 24. | 48302 | 19.6% | 9.7%(+9.89)#24 | 11.2%(+8.35)#2,173 |
| 25. | 49757 | 19.4% | 9.7%(+9.71)#25 | 11.2%(+8.18)#2,239 |
| 26. | 49891 | 19.3% | 9.7%(+9.63)#26 | 11.2%(+8.09)#2,269 |
| 27. | 48840 | 19.0% | 9.7%(+9.29)#27 | 11.2%(+7.76)#2,405 |
| 28. | 49654 | 18.7% | 9.7%(+9.02)#28 | 11.2%(+7.48)#2,511 |
| 29. | 49129 | 18.6% | 9.7%(+8.88)#29 | 11.2%(+7.35)#2,573 |
| 30. | 49617 | 18.1% | 9.7%(+8.42)#30 | 11.2%(+6.89)#2,767 |
| 31. | 49806 | 18.0% | 9.7%(+8.37)#31 | 11.2%(+6.83)#2,792 |
| 32. | 48323 | 17.7% | 9.7%(+8.01)#32 | 11.2%(+6.47)#2,980 |
| 33. | 49670 | 17.6% | 9.7%(+7.94)#33 | 11.2%(+6.40)#3,011 |
| 34. | 48636 | 17.4% | 9.7%(+7.68)#34 | 11.2%(+6.14)#3,151 |
| 35. | 49254 | 17.4% | 9.7%(+7.68)#35 | 11.2%(+6.14)#3,154 |
| 36. | 49103 | 17.4% | 9.7%(+7.68)#36 | 11.2%(+6.14)#3,156 |
| 37. | 49952 | 17.3% | 9.7%(+7.63)#37 | 11.2%(+6.09)#3,177 |
| 38. | 49793 | 17.1% | 9.7%(+7.40)#38 | 11.2%(+5.86)#3,331 |
| 39. | 48301 | 17.1% | 9.7%(+7.39)#39 | 11.2%(+5.85)#3,335 |
| 40. | 48025 | 16.9% | 9.7%(+7.18)#40 | 11.2%(+5.65)#3,472 |
| 41. | 48201 | 16.8% | 9.7%(+7.14)#41 | 11.2%(+5.60)#3,501 |
| 42. | 48502 | 16.8% | 9.7%(+7.10)#42 | 11.2%(+5.56)#3,531 |
| 43. | 48933 | 16.8% | 9.7%(+7.09)#43 | 11.2%(+5.56)#3,533 |
| 44. | 49506 | 16.7% | 9.7%(+6.99)#44 | 11.2%(+5.45)#3,582 |
| 45. | 49724 | 16.5% | 9.7%(+6.85)#45 | 11.2%(+5.31)#3,680 |
| 46. | 48202 | 16.5% | 9.7%(+6.83)#46 | 11.2%(+5.29)#3,692 |
| 47. | 49008 | 16.5% | 9.7%(+6.77)#47 | 11.2%(+5.24)#3,735 |
| 48. | 48807 | 16.4% | 9.7%(+6.72)#48 | 11.2%(+5.18)#3,767 |
| 49. | 49820 | 16.3% | 9.7%(+6.60)#49 | 11.2%(+5.06)#3,853 |
| 50. | 49546 | 16.2% | 9.7%(+6.56)#50 | 11.2%(+5.02)#3,884 |
| 51. | 48304 | 16.0% | 9.7%(+6.32)#51 | 11.2%(+4.79)#4,069 |
| 52. | 49970 | 16.0% | 9.7%(+6.28)#52 | 11.2%(+4.74)#4,102 |
| 53. | 48108 | 15.9% | 9.7%(+6.20)#53 | 11.2%(+4.66)#4,166 |
| 54. | 48009 | 15.9% | 9.7%(+6.19)#54 | 11.2%(+4.65)#4,177 |
| 55. | 49965 | 15.8% | 9.7%(+6.16)#55 | 11.2%(+4.63)#4,196 |
| 56. | 48072 | 15.7% | 9.7%(+6.04)#56 | 11.2%(+4.50)#4,320 |
| 57. | 49962 | 15.5% | 9.7%(+5.80)#57 | 11.2%(+4.26)#4,523 |
| 58. | 49728 | 15.5% | 9.7%(+5.79)#58 | 11.2%(+4.25)#4,540 |
| 59. | 49242 | 15.4% | 9.7%(+5.74)#59 | 11.2%(+4.20)#4,591 |
| 60. | 49643 | 15.4% | 9.7%(+5.72)#60 | 11.2%(+4.18)#4,601 |
| 61. | 49060 | 15.4% | 9.7%(+5.69)#61 | 11.2%(+4.15)#4,648 |
| 62. | 48852 | 15.3% | 9.7%(+5.58)#62 | 11.2%(+4.04)#4,748 |
| 63. | 48176 | 15.2% | 9.7%(+5.48)#63 | 11.2%(+3.94)#4,824 |
| 64. | 48873 | 15.1% | 9.7%(+5.39)#64 | 11.2%(+3.86)#4,900 |
| 65. | 49705 | 15.0% | 9.7%(+5.32)#65 | 11.2%(+3.79)#4,962 |
| 66. | 49261 | 14.9% | 9.7%(+5.19)#66 | 11.2%(+3.65)#5,097 |
| 67. | 49106 | 14.9% | 9.7%(+5.18)#67 | 11.2%(+3.65)#5,103 |
| 68. | 48208 | 14.6% | 9.7%(+4.93)#68 | 11.2%(+3.40)#5,351 |
| 69. | 49525 | 14.6% | 9.7%(+4.93)#69 | 11.2%(+3.39)#5,360 |
| 70. | 49835 | 14.6% | 9.7%(+4.88)#70 | 11.2%(+3.35)#5,413 |
| 71. | 48801 | 14.5% | 9.7%(+4.81)#71 | 11.2%(+3.27)#5,485 |
| 72. | 49302 | 14.5% | 9.7%(+4.79)#72 | 11.2%(+3.25)#5,504 |
| 73. | 48067 | 14.5% | 9.7%(+4.78)#73 | 11.2%(+3.24)#5,521 |
| 74. | 48912 | 14.4% | 9.7%(+4.75)#74 | 11.2%(+3.21)#5,560 |
| 75. | 49770 | 14.4% | 9.7%(+4.73)#75 | 11.2%(+3.19)#5,585 |
| 76. | 49627 | 14.3% | 9.7%(+4.61)#76 | 11.2%(+3.07)#5,724 |
| 77. | 49950 | 14.2% | 9.7%(+4.56)#77 | 11.2%(+3.03)#5,785 |
| 78. | 49880 | 14.2% | 9.7%(+4.47)#78 | 11.2%(+2.94)#5,895 |
| 79. | 48226 | 14.1% | 9.7%(+4.45)#79 | 11.2%(+2.91)#5,937 |
| 80. | 49269 | 14.1% | 9.7%(+4.38)#80 | 11.2%(+2.85)#6,019 |
| 81. | 49038 | 14.0% | 9.7%(+4.36)#81 | 11.2%(+2.83)#6,040 |
| 82. | 48120 | 14.0% | 9.7%(+4.32)#82 | 11.2%(+2.79)#6,084 |
| 83. | 48221 | 13.9% | 9.7%(+4.24)#83 | 11.2%(+2.71)#6,193 |
| 84. | 49436 | 13.9% | 9.7%(+4.24)#84 | 11.2%(+2.70)#6,199 |
| 85. | 48065 | 13.9% | 9.7%(+4.21)#85 | 11.2%(+2.67)#6,228 |
| 86. | 49817 | 13.8% | 9.7%(+4.17)#86 | 11.2%(+2.63)#6,277 |
| 87. | 48858 | 13.7% | 9.7%(+4.03)#87 | 11.2%(+2.50)#6,462 |
| 88. | 48073 | 13.7% | 9.7%(+4.01)#88 | 11.2%(+2.48)#6,485 |
| 89. | 48118 | 13.7% | 9.7%(+4.01)#89 | 11.2%(+2.47)#6,490 |
| 90. | 48237 | 13.6% | 9.7%(+3.97)#90 | 11.2%(+2.44)#6,547 |
| 91. | 49102 | 13.6% | 9.7%(+3.96)#91 | 11.2%(+2.42)#6,560 |
| 92. | 48207 | 13.6% | 9.7%(+3.96)#92 | 11.2%(+2.42)#6,568 |
| 93. | 48197 | 13.6% | 9.7%(+3.95)#93 | 11.2%(+2.42)#6,570 |
| 94. | 49450 | 13.6% | 9.7%(+3.95)#94 | 11.2%(+2.41)#6,584 |
| 95. | 49246 | 13.4% | 9.7%(+3.69)#95 | 11.2%(+2.15)#6,956 |
| 96. | 48825 | 13.3% | 9.7%(+3.67)#96 | 11.2%(+2.13)#6,977 |
| 97. | 49456 | 13.3% | 9.7%(+3.64)#97 | 11.2%(+2.10)#7,042 |
| 98. | 48124 | 13.3% | 9.7%(+3.64)#98 | 11.2%(+2.10)#7,048 |
| 99. | 49318 | 13.3% | 9.7%(+3.63)#99 | 11.2%(+2.10)#7,057 |
| 100. | 49664 | 13.3% | 9.7%(+3.62)#100 | 11.2%(+2.09)#7,077 |
Common Questions
What are the Top 10 Zip Codes with the Highest Percentage of Population Employed in Community & Social Service in Michigan?
Top 10 Zip Codes with the Highest Percentage of Population Employed in Community & Social Service in Michigan are:
What zip code has the Highest Percentage of Population Employed in Community & Social Service in Michigan?
49115 has the Highest Percentage of Population Employed in Community & Social Service in Michigan with 51.9%.
What is the Percentage of Population Employed in Community & Social Service in the State of Michigan?
Percentage of Population Employed in Community & Social Service in Michigan is 9.7%.
What is the Percentage of Population Employed in Community & Social Service in the United States?
Percentage of Population Employed in Community & Social Service in the United States is 11.2%.