Zip Codes with the Most Immigrants from Panama in Michigan
RELATED REPORTS & OPTIONS
Panama
Michigan
Compare Zip Codes
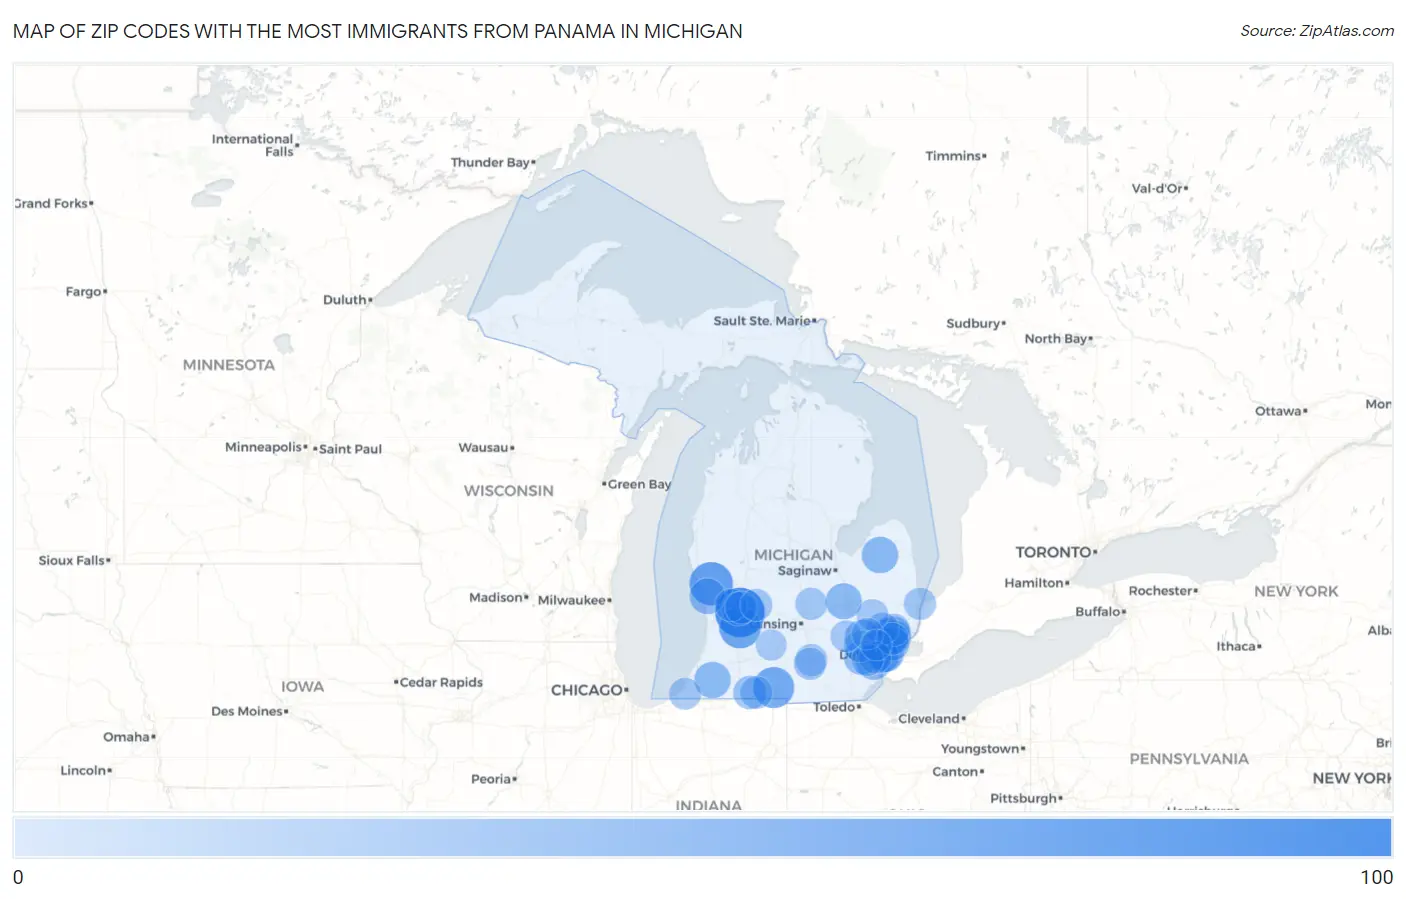
Map of Zip Codes with the Most Immigrants from Panama in Michigan
0
100
Zip Codes with the Most Immigrants from Panama in Michigan
| Zip Code | Panama | vs State | vs National | |
| 1. | 49508 | 99 | 833(11.88%)#1 | 105,274(0.09%)#206 |
| 2. | 49442 | 67 | 833(8.04%)#2 | 105,274(0.06%)#369 |
| 3. | 49348 | 58 | 833(6.96%)#3 | 105,274(0.06%)#476 |
| 4. | 49036 | 54 | 833(6.48%)#4 | 105,274(0.05%)#526 |
| 5. | 48220 | 33 | 833(3.96%)#5 | 105,274(0.03%)#901 |
| 6. | 48726 | 31 | 833(3.72%)#6 | 105,274(0.03%)#952 |
| 7. | 49047 | 30 | 833(3.60%)#7 | 105,274(0.03%)#981 |
| 8. | 48532 | 29 | 833(3.48%)#8 | 105,274(0.03%)#1,009 |
| 9. | 49456 | 27 | 833(3.24%)#9 | 105,274(0.03%)#1,082 |
| 10. | 48201 | 27 | 833(3.24%)#10 | 105,274(0.03%)#1,090 |
| 11. | 48390 | 26 | 833(3.12%)#11 | 105,274(0.02%)#1,128 |
| 12. | 48180 | 23 | 833(2.76%)#12 | 105,274(0.02%)#1,237 |
| 13. | 48310 | 23 | 833(2.76%)#13 | 105,274(0.02%)#1,245 |
| 14. | 48188 | 22 | 833(2.64%)#14 | 105,274(0.02%)#1,289 |
| 15. | 48038 | 21 | 833(2.52%)#15 | 105,274(0.02%)#1,335 |
| 16. | 48035 | 21 | 833(2.52%)#16 | 105,274(0.02%)#1,347 |
| 17. | 48216 | 19 | 833(2.28%)#17 | 105,274(0.02%)#1,478 |
| 18. | 49507 | 17 | 833(2.04%)#18 | 105,274(0.02%)#1,558 |
| 19. | 48021 | 16 | 833(1.92%)#19 | 105,274(0.02%)#1,633 |
| 20. | 49091 | 16 | 833(1.92%)#20 | 105,274(0.02%)#1,652 |
| 21. | 48209 | 14 | 833(1.68%)#21 | 105,274(0.01%)#1,766 |
| 22. | 49534 | 11 | 833(1.32%)#22 | 105,274(0.01%)#2,031 |
| 23. | 49030 | 11 | 833(1.32%)#23 | 105,274(0.01%)#2,065 |
| 24. | 48044 | 10 | 833(1.20%)#24 | 105,274(0.01%)#2,079 |
| 25. | 48307 | 10 | 833(1.20%)#25 | 105,274(0.01%)#2,095 |
| 26. | 49506 | 10 | 833(1.20%)#26 | 105,274(0.01%)#2,112 |
| 27. | 49201 | 9 | 833(1.08%)#27 | 105,274(0.01%)#2,190 |
| 28. | 48060 | 9 | 833(1.08%)#28 | 105,274(0.01%)#2,198 |
| 29. | 49203 | 9 | 833(1.08%)#29 | 105,274(0.01%)#2,202 |
| 30. | 49331 | 9 | 833(1.08%)#30 | 105,274(0.01%)#2,235 |
| 31. | 48026 | 9 | 833(1.08%)#31 | 105,274(0.01%)#2,241 |
| 32. | 48167 | 8 | 833(0.96%)#32 | 105,274(0.01%)#2,336 |
| 33. | 48125 | 8 | 833(0.96%)#33 | 105,274(0.01%)#2,339 |
| 34. | 48184 | 8 | 833(0.96%)#34 | 105,274(0.01%)#2,356 |
| 35. | 48866 | 8 | 833(0.96%)#35 | 105,274(0.01%)#2,370 |
| 36. | 49128 | 7 | 833(0.84%)#36 | 105,274(0.01%)#2,486 |
| 37. | 48371 | 6 | 833(0.72%)#37 | 105,274(0.01%)#2,533 |
| 38. | 48114 | 6 | 833(0.72%)#38 | 105,274(0.01%)#2,540 |
| 39. | 48324 | 6 | 833(0.72%)#39 | 105,274(0.01%)#2,544 |
| 40. | 48075 | 3 | 833(0.36%)#40 | 105,274(0.00%)#2,744 |
| 41. | 49021 | 3 | 833(0.36%)#41 | 105,274(0.00%)#2,764 |
Common Questions
What are the Top 10 Zip Codes with the Most Immigrants from Panama in Michigan?
Top 10 Zip Codes with the Most Immigrants from Panama in Michigan are:
What zip code has the Most Immigrants from Panama in Michigan?
49508 has the Most Immigrants from Panama in Michigan with 99.
What is the Total Immigrants from Panama in the State of Michigan?
Total Immigrants from Panama in Michigan is 833.
What is the Total Immigrants from Panama in the United States?
Total Immigrants from Panama in the United States is 105,274.