Zip Codes with the Highest Percentage of Population Employed in Security & Protection in Mission, KS
RELATED REPORTS & OPTIONS
Security & Protection
Mission
Compare Zip Codes
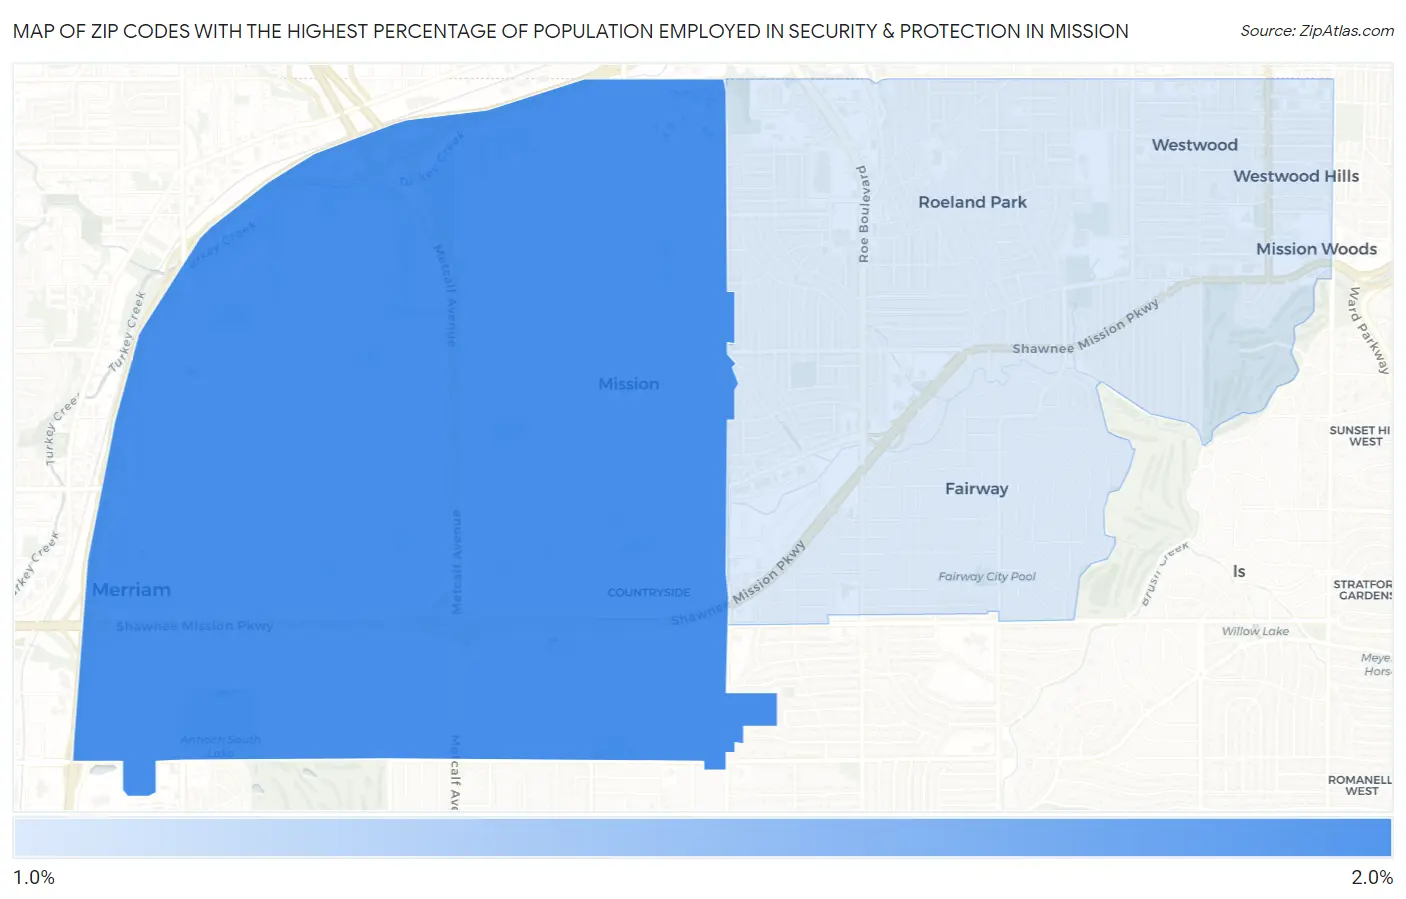
Map of Zip Codes with the Highest Percentage of Population Employed in Security & Protection in Mission
1.1%
1.8%
Zip Codes with the Highest Percentage of Population Employed in Security & Protection in Mission, KS
| Zip Code | % Employed | vs State | vs National | |
| 1. | 66202 | 1.8% | 1.8%(+0.033)#226 | 2.1%(-0.340)#13,876 |
| 2. | 66205 | 1.1% | 1.8%(-0.649)#327 | 2.1%(-1.02)#19,082 |
1
Common Questions
What are the Top Zip Codes with the Highest Percentage of Population Employed in Security & Protection in Mission, KS?
Top Zip Codes with the Highest Percentage of Population Employed in Security & Protection in Mission, KS are:
What zip code has the Highest Percentage of Population Employed in Security & Protection in Mission, KS?
66202 has the Highest Percentage of Population Employed in Security & Protection in Mission, KS with 1.8%.
What is the Percentage of Population Employed in Security & Protection in Mission, KS?
Percentage of Population Employed in Security & Protection in Mission is 1.7%.
What is the Percentage of Population Employed in Security & Protection in Kansas?
Percentage of Population Employed in Security & Protection in Kansas is 1.8%.
What is the Percentage of Population Employed in Security & Protection in the United States?
Percentage of Population Employed in Security & Protection in the United States is 2.1%.