Zip Codes with the Highest Percentage of Population Employed in Security & Protection in Kansas City, KS
RELATED REPORTS & OPTIONS
Security & Protection
Kansas City
Compare Zip Codes
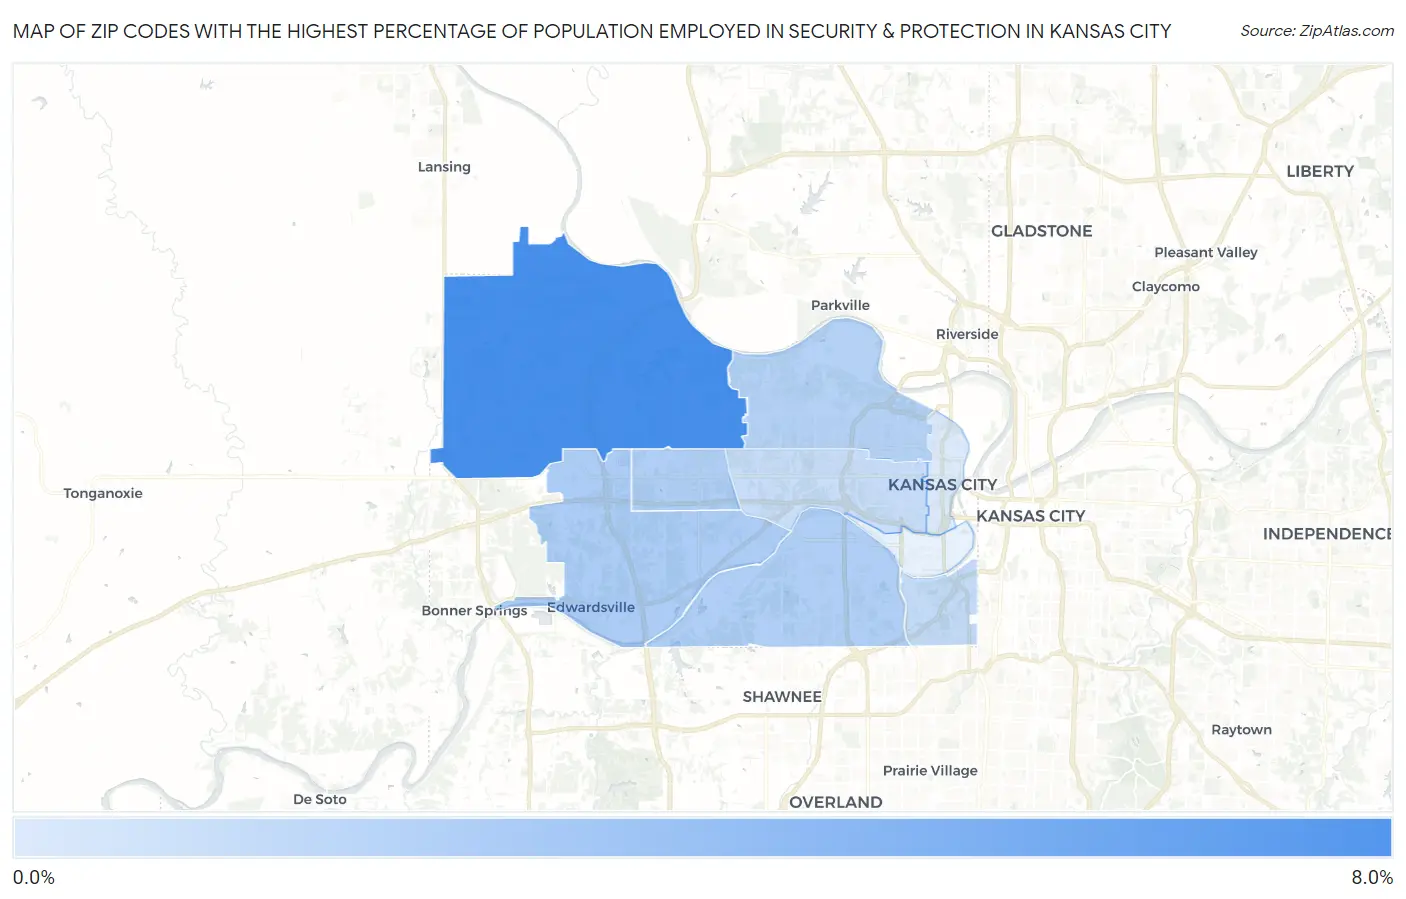
Map of Zip Codes with the Highest Percentage of Population Employed in Security & Protection in Kansas City
0.62%
6.3%
Zip Codes with the Highest Percentage of Population Employed in Security & Protection in Kansas City, KS
| Zip Code | % Employed | vs State | vs National | |
| 1. | 66109 | 6.3% | 1.8%(+4.48)#25 | 2.1%(+4.11)#1,917 |
| 2. | 66111 | 2.4% | 1.8%(+0.667)#155 | 2.1%(+0.294)#9,836 |
| 3. | 66112 | 2.3% | 1.8%(+0.485)#170 | 2.1%(+0.112)#10,882 |
| 4. | 66106 | 2.2% | 1.8%(+0.460)#179 | 2.1%(+0.087)#11,044 |
| 5. | 66104 | 2.1% | 1.8%(+0.289)#198 | 2.1%(-0.084)#12,157 |
| 6. | 66103 | 1.6% | 1.8%(-0.196)#256 | 2.1%(-0.569)#15,572 |
| 7. | 66102 | 1.4% | 1.8%(-0.387)#286 | 2.1%(-0.760)#17,044 |
| 8. | 66101 | 0.62% | 1.8%(-1.15)#409 | 2.1%(-1.53)#22,533 |
1
Common Questions
What are the Top 5 Zip Codes with the Highest Percentage of Population Employed in Security & Protection in Kansas City, KS?
Top 5 Zip Codes with the Highest Percentage of Population Employed in Security & Protection in Kansas City, KS are:
What zip code has the Highest Percentage of Population Employed in Security & Protection in Kansas City, KS?
66109 has the Highest Percentage of Population Employed in Security & Protection in Kansas City, KS with 6.3%.
What is the Percentage of Population Employed in Security & Protection in Kansas City, KS?
Percentage of Population Employed in Security & Protection in Kansas City is 2.6%.
What is the Percentage of Population Employed in Security & Protection in Kansas?
Percentage of Population Employed in Security & Protection in Kansas is 1.8%.
What is the Percentage of Population Employed in Security & Protection in the United States?
Percentage of Population Employed in Security & Protection in the United States is 2.1%.