Zip Codes with the Highest Percentage of Households With Three or more Vehicles in Mission, KS
RELATED REPORTS & OPTIONS
Households with 3 or more Cars
Mission
Compare Zip Codes
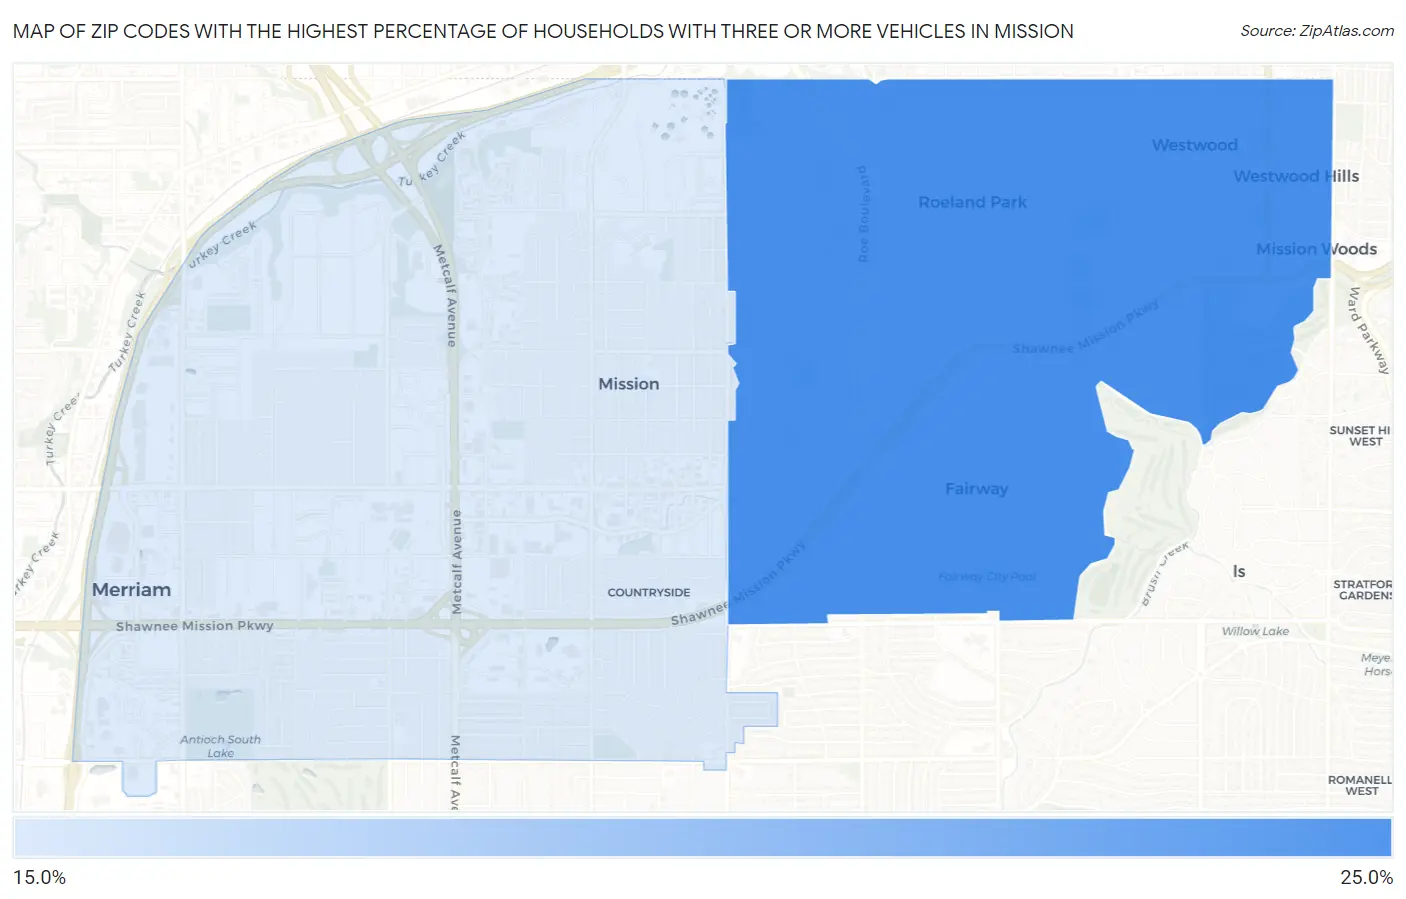
Map of Zip Codes with the Highest Percentage of Households With Three or more Vehicles in Mission
19.6%
20.4%
Zip Codes with the Highest Percentage of Households With Three or more Vehicles in Mission, KS
| Zip Code | Housholds With 3+ Cars | vs State | vs National | |
| 1. | 66205 | 20.4% | 34.5%(-14.1)#656 | 29.0%(-8.60)#26,386 |
| 2. | 66202 | 19.6% | 34.5%(-14.9)#661 | 29.0%(-9.40)#26,911 |
1
Common Questions
What are the Top Zip Codes with the Highest Percentage of Households With Three or more Vehicles in Mission, KS?
Top Zip Codes with the Highest Percentage of Households With Three or more Vehicles in Mission, KS are:
What zip code has the Highest Percentage of Households With Three or more Vehicles in Mission, KS?
66205 has the Highest Percentage of Households With Three or more Vehicles in Mission, KS with 20.4%.
What is the Percentage of Households With Three or more Vehicles in Mission, KS?
Percentage of Households With Three or more Vehicles in Mission is 26.1%.
What is the Percentage of Households With Three or more Vehicles in Kansas?
Percentage of Households With Three or more Vehicles in Kansas is 34.5%.
What is the Percentage of Households With Three or more Vehicles in the United States?
Percentage of Households With Three or more Vehicles in the United States is 29.0%.