Zip Codes with the Highest Percentage of Population with a Degree in Visual and Performing Arts in Mission, KS
RELATED REPORTS & OPTIONS
Visual and Performing Arts
Mission
Compare Zip Codes
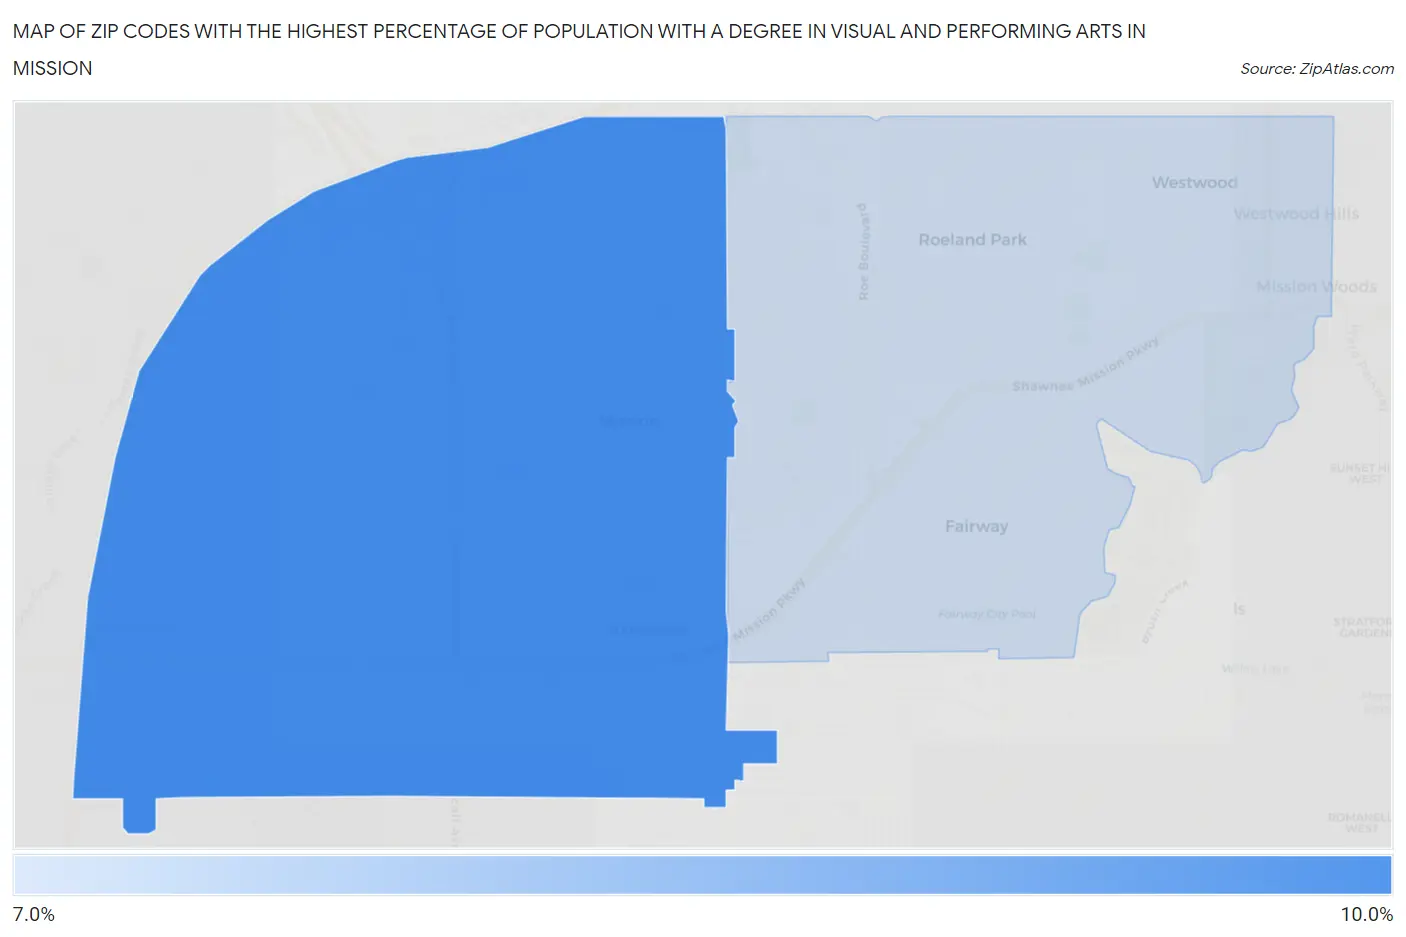
Map of Zip Codes with the Highest Percentage of Population with a Degree in Visual and Performing Arts in Mission
7.0%
8.7%
Zip Codes with the Highest Percentage of Population with a Degree in Visual and Performing Arts in Mission, KS
| Zip Code | % Graduates | vs State | vs National | |
| 1. | 66202 | 8.7% | 3.4%(+5.30)#34 | 4.3%(+4.46)#2,413 |
| 2. | 66205 | 7.0% | 3.4%(+3.62)#50 | 4.3%(+2.78)#3,629 |
1
Common Questions
What are the Top Zip Codes with the Highest Percentage of Population with a Degree in Visual and Performing Arts in Mission, KS?
Top Zip Codes with the Highest Percentage of Population with a Degree in Visual and Performing Arts in Mission, KS are:
What zip code has the Highest Percentage of Population with a Degree in Visual and Performing Arts in Mission, KS?
66202 has the Highest Percentage of Population with a Degree in Visual and Performing Arts in Mission, KS with 8.7%.
What is the Percentage of Population with a Degree in Visual and Performing Arts in Mission, KS?
Percentage of Population with a Degree in Visual and Performing Arts in Mission is 7.8%.
What is the Percentage of Population with a Degree in Visual and Performing Arts in Kansas?
Percentage of Population with a Degree in Visual and Performing Arts in Kansas is 3.4%.
What is the Percentage of Population with a Degree in Visual and Performing Arts in the United States?
Percentage of Population with a Degree in Visual and Performing Arts in the United States is 4.3%.