Zip Codes with the Highest Percentage of Population Employed in Architecture & Engineering in Mission, KS
RELATED REPORTS & OPTIONS
Architecture & Engineering
Mission
Compare Zip Codes
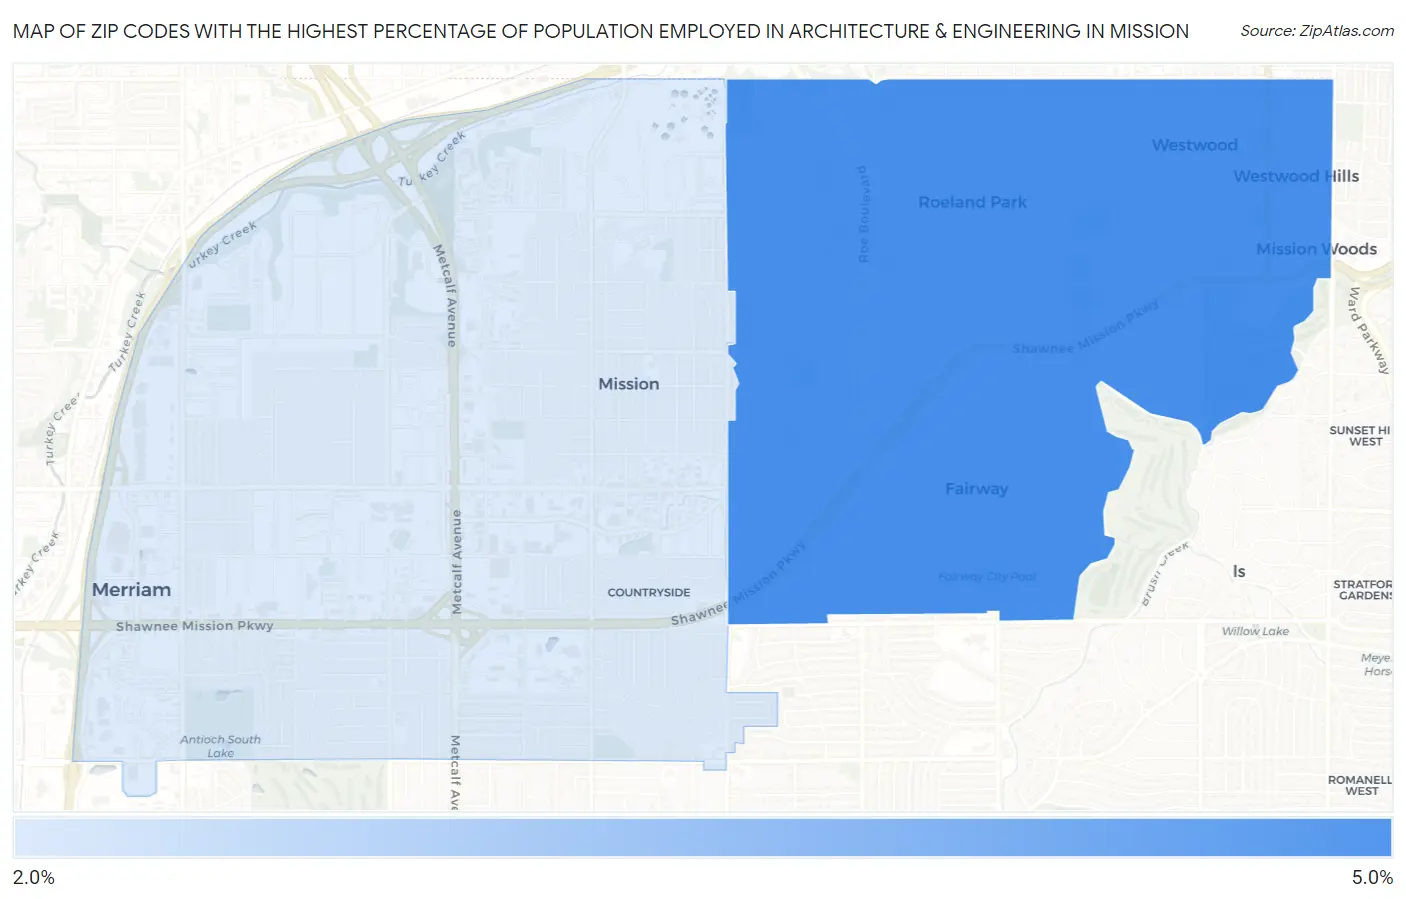
Map of Zip Codes with the Highest Percentage of Population Employed in Architecture & Engineering in Mission
3.0%
4.2%
Zip Codes with the Highest Percentage of Population Employed in Architecture & Engineering in Mission, KS
| Zip Code | % Employed | vs State | vs National | |
| 1. | 66205 | 4.2% | 2.0%(+2.13)#51 | 2.1%(+2.03)#2,518 |
| 2. | 66202 | 3.0% | 2.0%(+0.940)#84 | 2.1%(+0.832)#5,117 |
1
Common Questions
What are the Top Zip Codes with the Highest Percentage of Population Employed in Architecture & Engineering in Mission, KS?
Top Zip Codes with the Highest Percentage of Population Employed in Architecture & Engineering in Mission, KS are:
What zip code has the Highest Percentage of Population Employed in Architecture & Engineering in Mission, KS?
66205 has the Highest Percentage of Population Employed in Architecture & Engineering in Mission, KS with 4.2%.
What is the Percentage of Population Employed in Architecture & Engineering in Mission, KS?
Percentage of Population Employed in Architecture & Engineering in Mission is 2.3%.
What is the Percentage of Population Employed in Architecture & Engineering in Kansas?
Percentage of Population Employed in Architecture & Engineering in Kansas is 2.0%.
What is the Percentage of Population Employed in Architecture & Engineering in the United States?
Percentage of Population Employed in Architecture & Engineering in the United States is 2.1%.