Zip Codes with the Highest Percentage of Population Employed in Arts, Entertainment & Recreation in Mission, KS
RELATED REPORTS & OPTIONS
Arts, Entertainment & Recreation
Mission
Compare Zip Codes
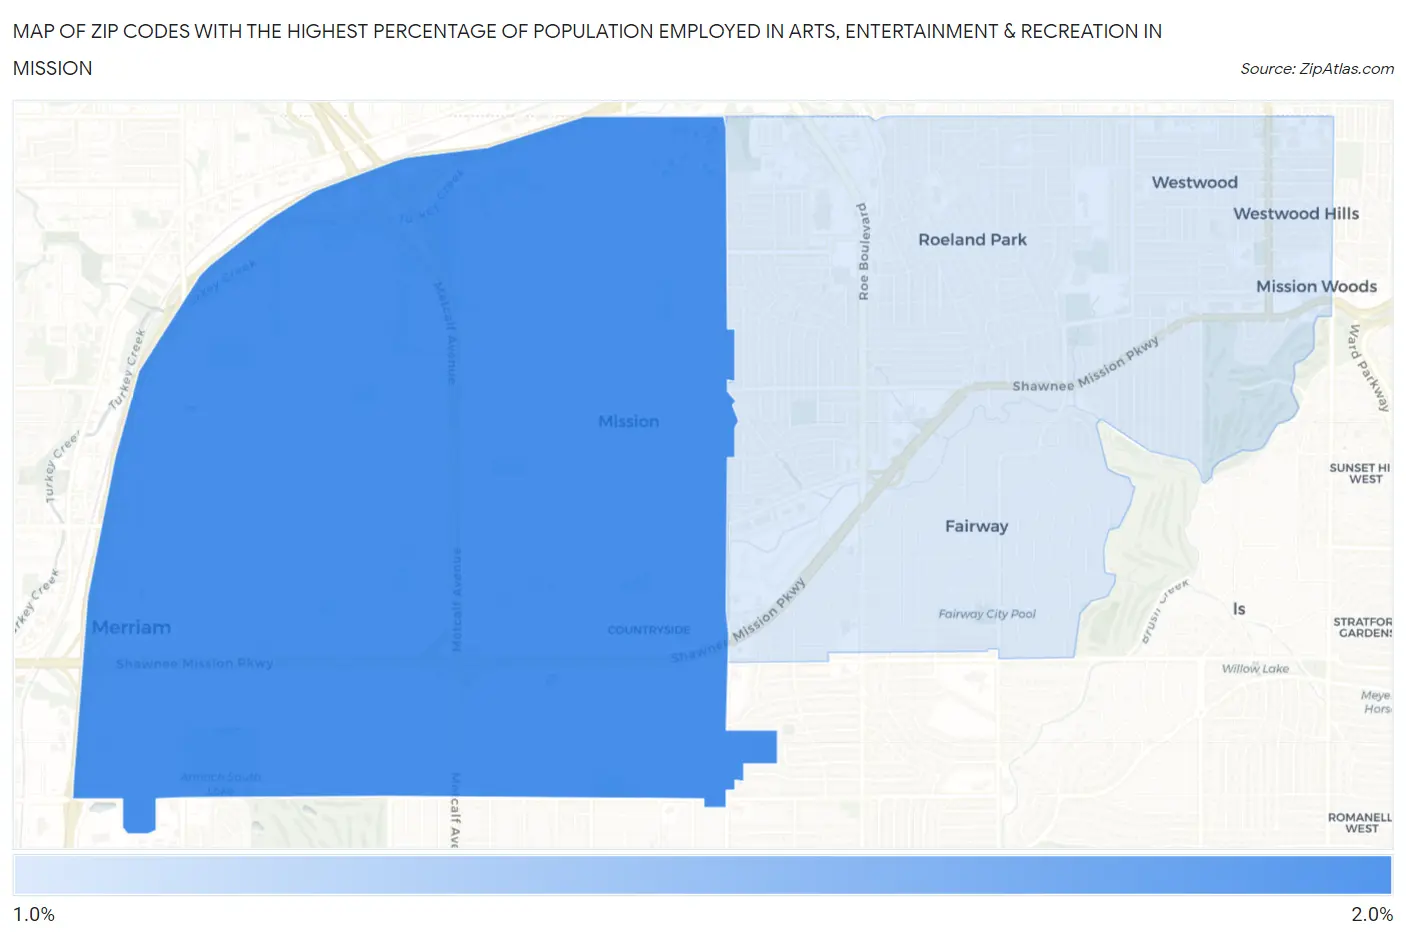
Map of Zip Codes with the Highest Percentage of Population Employed in Arts, Entertainment & Recreation in Mission
1.4%
2.0%
Zip Codes with the Highest Percentage of Population Employed in Arts, Entertainment & Recreation in Mission, KS
| Zip Code | % Employed | vs State | vs National | |
| 1. | 66202 | 2.0% | 1.7%(+0.208)#140 | 2.1%(-0.128)#10,039 |
| 2. | 66205 | 1.4% | 1.7%(-0.317)#222 | 2.1%(-0.653)#13,752 |
1
Common Questions
What are the Top Zip Codes with the Highest Percentage of Population Employed in Arts, Entertainment & Recreation in Mission, KS?
Top Zip Codes with the Highest Percentage of Population Employed in Arts, Entertainment & Recreation in Mission, KS are:
What zip code has the Highest Percentage of Population Employed in Arts, Entertainment & Recreation in Mission, KS?
66202 has the Highest Percentage of Population Employed in Arts, Entertainment & Recreation in Mission, KS with 2.0%.
What is the Percentage of Population Employed in Arts, Entertainment & Recreation in Mission, KS?
Percentage of Population Employed in Arts, Entertainment & Recreation in Mission is 2.5%.
What is the Percentage of Population Employed in Arts, Entertainment & Recreation in Kansas?
Percentage of Population Employed in Arts, Entertainment & Recreation in Kansas is 1.7%.
What is the Percentage of Population Employed in Arts, Entertainment & Recreation in the United States?
Percentage of Population Employed in Arts, Entertainment & Recreation in the United States is 2.1%.