Zip Codes with the Highest Percentage of Immigrants from Eastern Africa in Lenexa, KS
RELATED REPORTS & OPTIONS
Eastern Africa
Lenexa
Compare Zip Codes
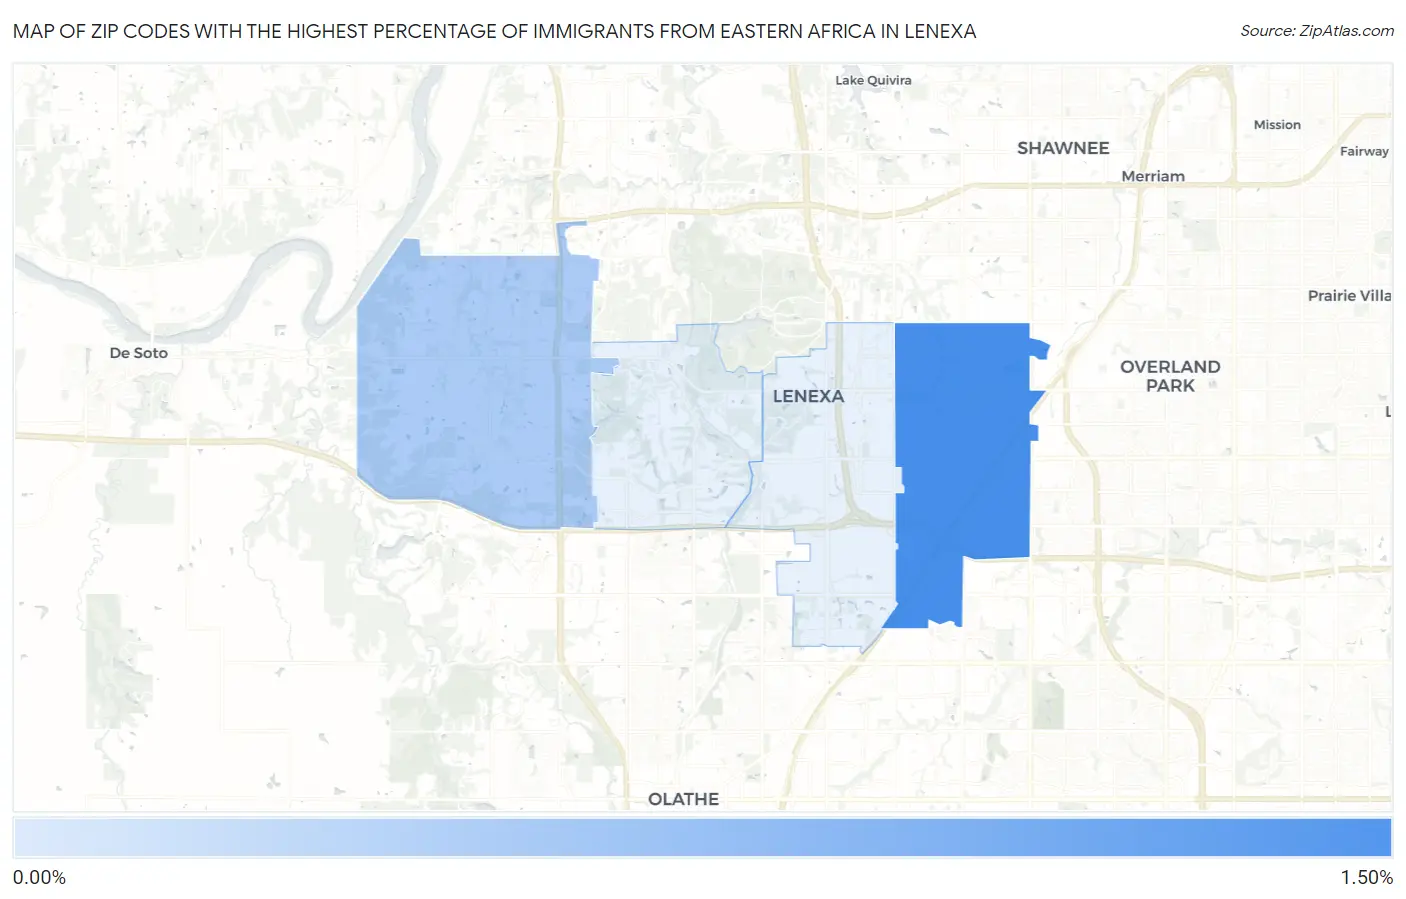
Map of Zip Codes with the Highest Percentage of Immigrants from Eastern Africa in Lenexa
0.34%
1.01%
Zip Codes with the Highest Percentage of Immigrants from Eastern Africa in Lenexa, KS
| Zip Code | Eastern Africa | vs State | vs National | |
| 1. | 66215 | 1.01% | 0.25%(+0.756)#-1 | 0.23%(+0.780)#0 |
| 2. | 66227 | 0.34% | 0.25%(+0.091)#0 | 0.23%(+0.115)#1 |
1
Common Questions
What are the Top 3 Zip Codes with the Highest Percentage of Immigrants from Eastern Africa in Lenexa, KS?
Top 3 Zip Codes with the Highest Percentage of Immigrants from Eastern Africa in Lenexa, KS are:
What zip code has the Highest Percentage of Immigrants from Eastern Africa in Lenexa, KS?
66215 has the Highest Percentage of Immigrants from Eastern Africa in Lenexa, KS with 1.01%.
What is the Percentage of Immigrants from Eastern Africa in Lenexa, KS?
Percentage of Immigrants from Eastern Africa in Lenexa is 0.72%.
What is the Percentage of Immigrants from Eastern Africa in Kansas?
Percentage of Immigrants from Eastern Africa in Kansas is 0.25%.
What is the Percentage of Immigrants from Eastern Africa in the United States?
Percentage of Immigrants from Eastern Africa in the United States is 0.23%.