Zip Codes with the Highest Percentage of Population Employed in Community & Social Service in Lenexa, KS
RELATED REPORTS & OPTIONS
Community & Social Service
Lenexa
Compare Zip Codes
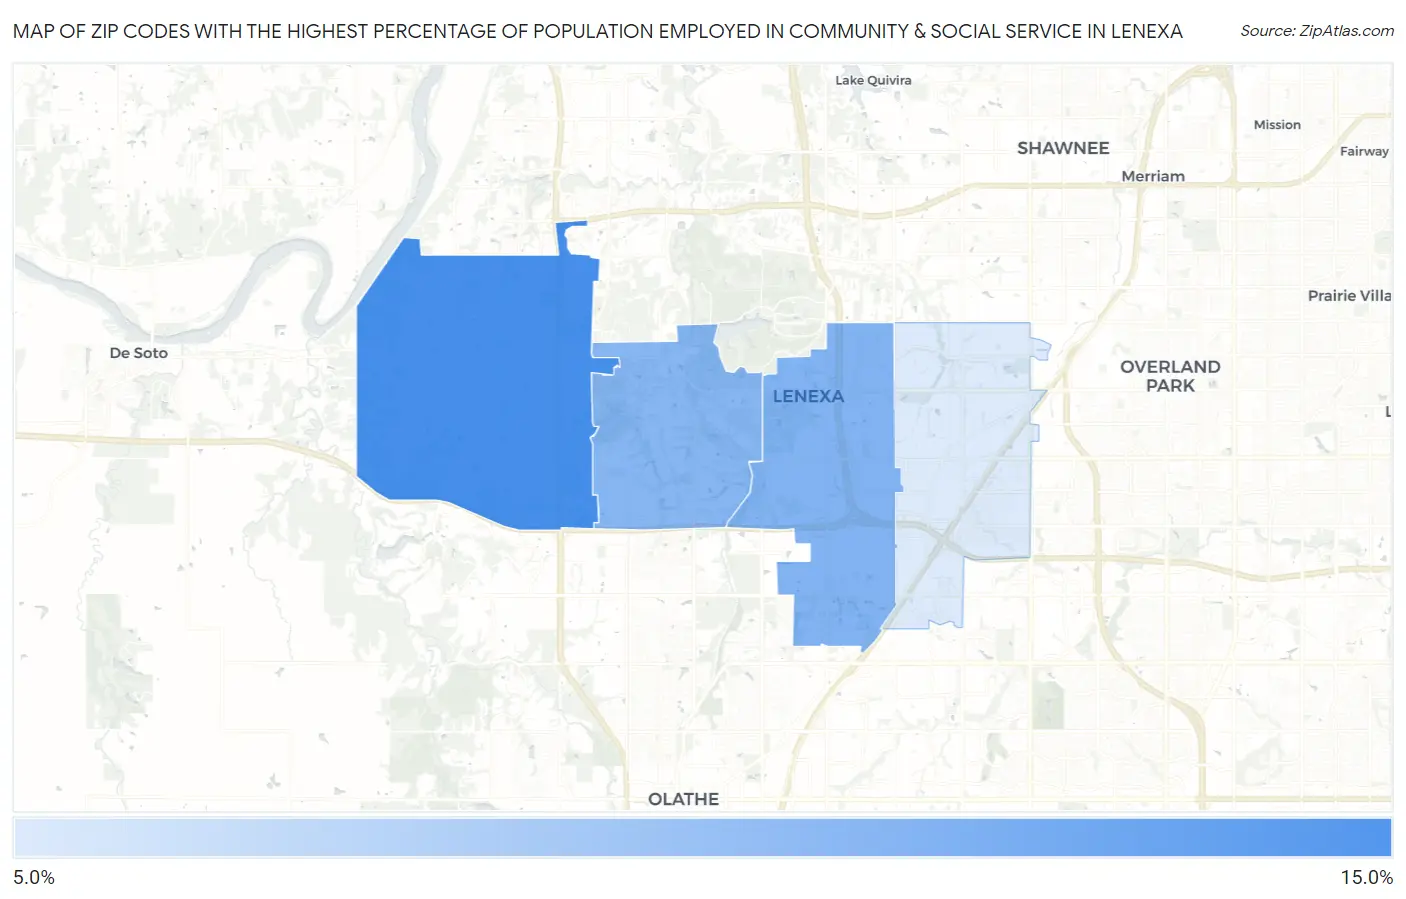
Map of Zip Codes with the Highest Percentage of Population Employed in Community & Social Service in Lenexa
8.9%
10.4%
Zip Codes with the Highest Percentage of Population Employed in Community & Social Service in Lenexa, KS
| Zip Code | % Employed | vs State | vs National | |
| 1. | 66227 | 10.4% | 11.3%(-0.849)#298 | 11.2%(-0.779)#13,025 |
| 2. | 66219 | 9.8% | 11.3%(-1.44)#329 | 11.2%(-1.37)#14,538 |
| 3. | 66220 | 9.8% | 11.3%(-1.51)#332 | 11.2%(-1.44)#14,688 |
| 4. | 66215 | 8.9% | 11.3%(-2.35)#379 | 11.2%(-2.28)#17,004 |
1
Common Questions
What are the Top 3 Zip Codes with the Highest Percentage of Population Employed in Community & Social Service in Lenexa, KS?
Top 3 Zip Codes with the Highest Percentage of Population Employed in Community & Social Service in Lenexa, KS are:
What zip code has the Highest Percentage of Population Employed in Community & Social Service in Lenexa, KS?
66227 has the Highest Percentage of Population Employed in Community & Social Service in Lenexa, KS with 10.4%.
What is the Percentage of Population Employed in Community & Social Service in Lenexa, KS?
Percentage of Population Employed in Community & Social Service in Lenexa is 9.2%.
What is the Percentage of Population Employed in Community & Social Service in Kansas?
Percentage of Population Employed in Community & Social Service in Kansas is 11.3%.
What is the Percentage of Population Employed in Community & Social Service in the United States?
Percentage of Population Employed in Community & Social Service in the United States is 11.2%.