Zip Codes with the Highest Percentage of Population Employed in Architecture & Engineering in Lenexa, KS
RELATED REPORTS & OPTIONS
Architecture & Engineering
Lenexa
Compare Zip Codes
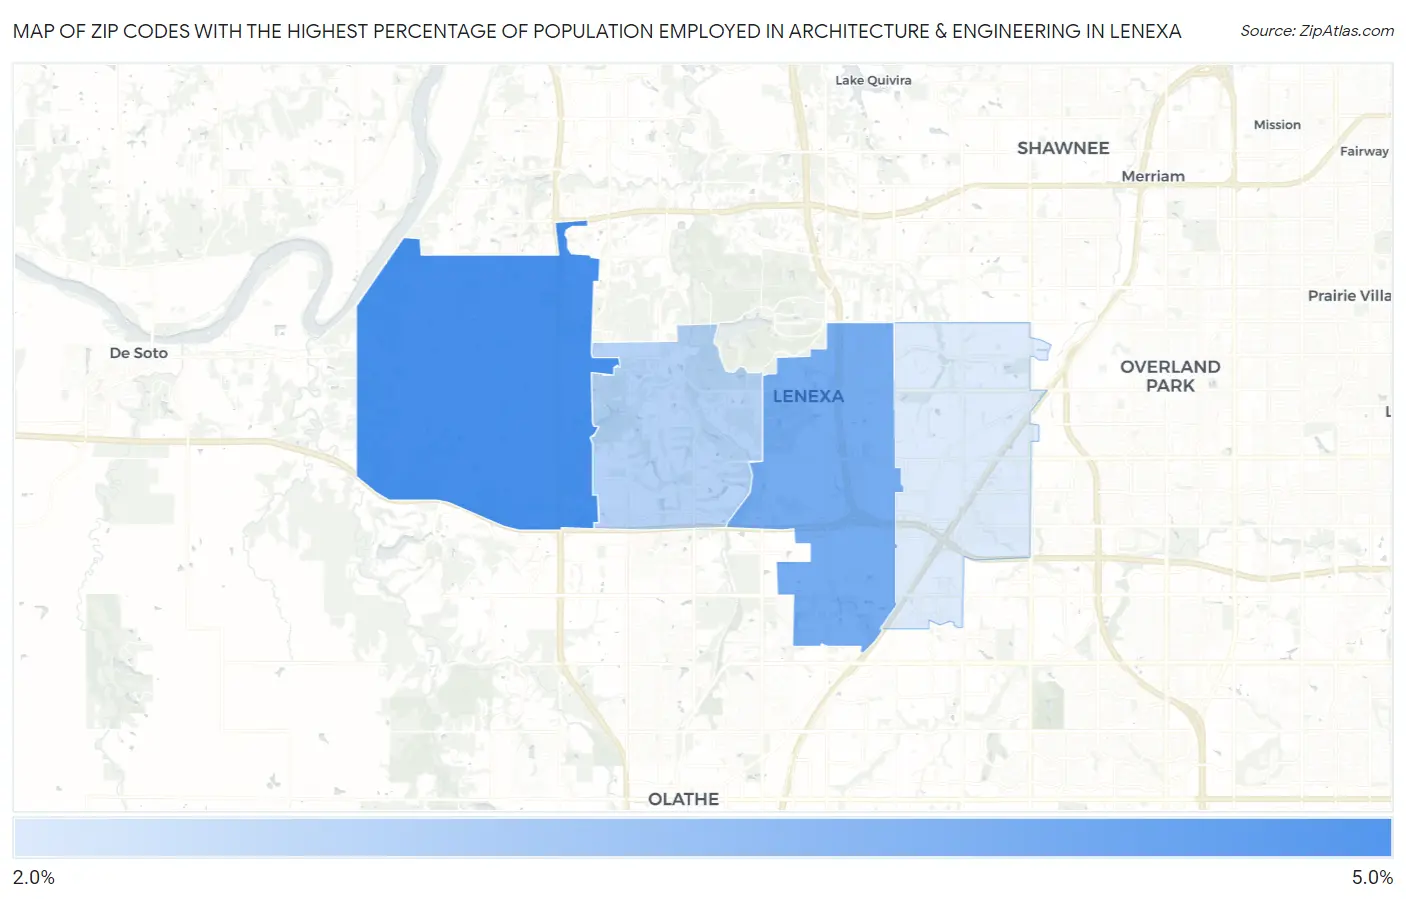
Map of Zip Codes with the Highest Percentage of Population Employed in Architecture & Engineering in Lenexa
2.2%
4.1%
Zip Codes with the Highest Percentage of Population Employed in Architecture & Engineering in Lenexa, KS
| Zip Code | % Employed | vs State | vs National | |
| 1. | 66227 | 4.1% | 2.0%(+2.08)#53 | 2.1%(+1.97)#2,597 |
| 2. | 66219 | 3.5% | 2.0%(+1.48)#67 | 2.1%(+1.37)#3,677 |
| 3. | 66220 | 2.7% | 2.0%(+0.668)#104 | 2.1%(+0.560)#6,116 |
| 4. | 66215 | 2.2% | 2.0%(+0.185)#139 | 2.1%(+0.077)#8,335 |
1
Common Questions
What are the Top 3 Zip Codes with the Highest Percentage of Population Employed in Architecture & Engineering in Lenexa, KS?
Top 3 Zip Codes with the Highest Percentage of Population Employed in Architecture & Engineering in Lenexa, KS are:
What zip code has the Highest Percentage of Population Employed in Architecture & Engineering in Lenexa, KS?
66227 has the Highest Percentage of Population Employed in Architecture & Engineering in Lenexa, KS with 4.1%.
What is the Percentage of Population Employed in Architecture & Engineering in Lenexa, KS?
Percentage of Population Employed in Architecture & Engineering in Lenexa is 3.1%.
What is the Percentage of Population Employed in Architecture & Engineering in Kansas?
Percentage of Population Employed in Architecture & Engineering in Kansas is 2.0%.
What is the Percentage of Population Employed in Architecture & Engineering in the United States?
Percentage of Population Employed in Architecture & Engineering in the United States is 2.1%.