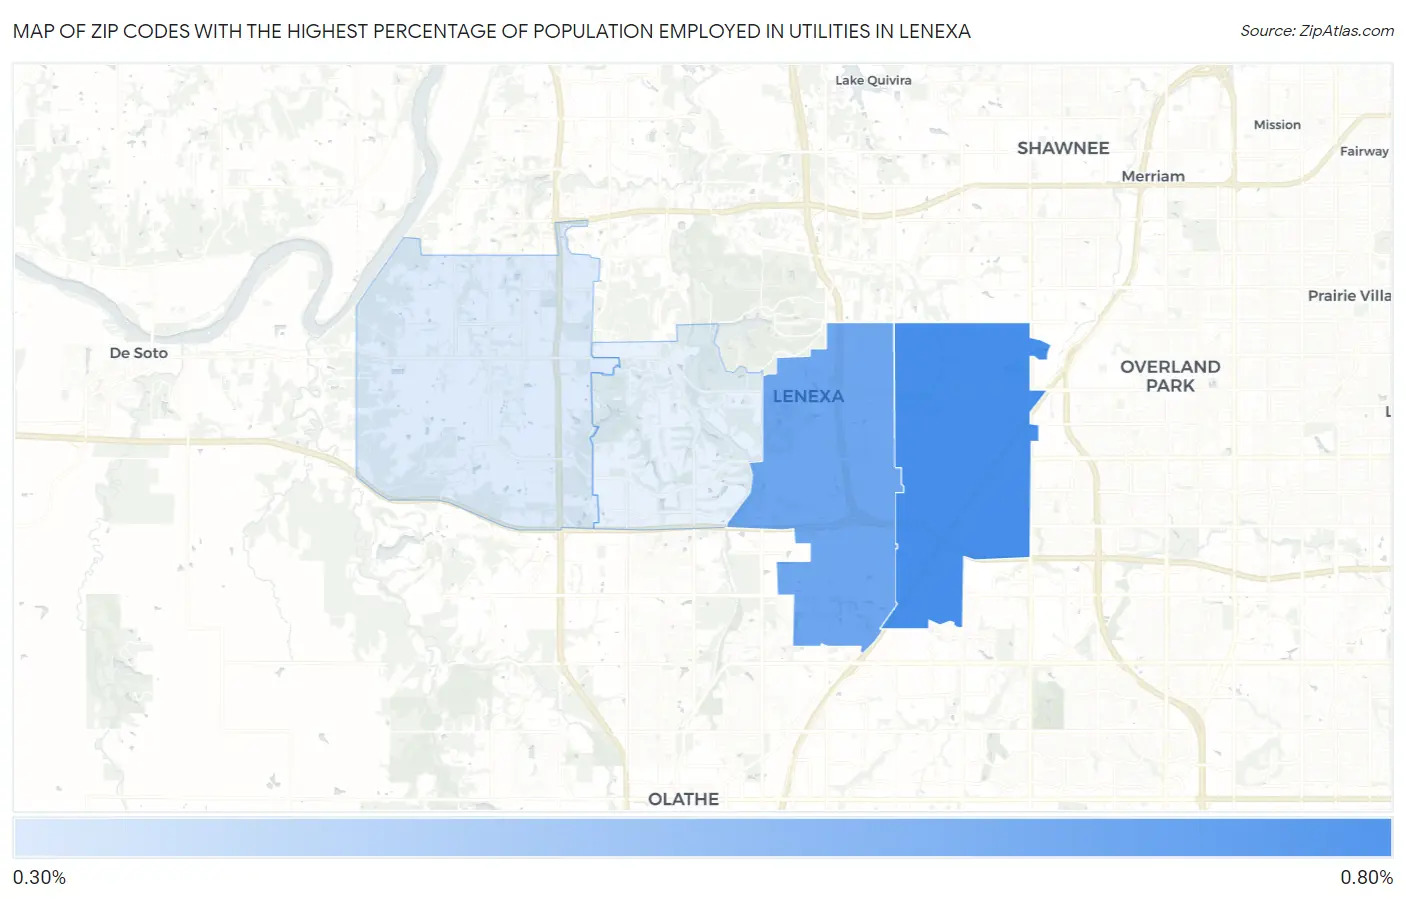
Zip Codes with the Highest Percentage of Population Employed in Utilities in Lenexa, KS
RELATED REPORTS & OPTIONS
Utilities
Lenexa
Compare Zip Codes
Map of Zip Codes with the Highest Percentage of Population Employed in Utilities in Lenexa
0.36%
0.70%
Zip Codes with the Highest Percentage of Population Employed in Utilities in Lenexa, KS
| Zip Code | % Employed | vs State | vs National | |
| 1. | 66215 | 0.70% | 0.97%(-0.270)#300 | 0.84%(-0.136)#13,489 |
| 2. | 66219 | 0.61% | 0.97%(-0.361)#317 | 0.84%(-0.228)#14,640 |
| 3. | 66227 | 0.36% | 0.97%(-0.611)#373 | 0.84%(-0.478)#18,152 |
1
Common Questions
What are the Top 3 Zip Codes with the Highest Percentage of Population Employed in Utilities in Lenexa, KS?
Top 3 Zip Codes with the Highest Percentage of Population Employed in Utilities in Lenexa, KS are:
What zip code has the Highest Percentage of Population Employed in Utilities in Lenexa, KS?
66215 has the Highest Percentage of Population Employed in Utilities in Lenexa, KS with 0.70%.
What is the Percentage of Population Employed in Utilities in Lenexa, KS?
Percentage of Population Employed in Utilities in Lenexa is 0.51%.
What is the Percentage of Population Employed in Utilities in Kansas?
Percentage of Population Employed in Utilities in Kansas is 0.97%.
What is the Percentage of Population Employed in Utilities in the United States?
Percentage of Population Employed in Utilities in the United States is 0.84%.