Zip Codes with the Highest Percentage of Population Employed in Office & Administration in Lenexa, KS
RELATED REPORTS & OPTIONS
Office & Administration
Lenexa
Compare Zip Codes
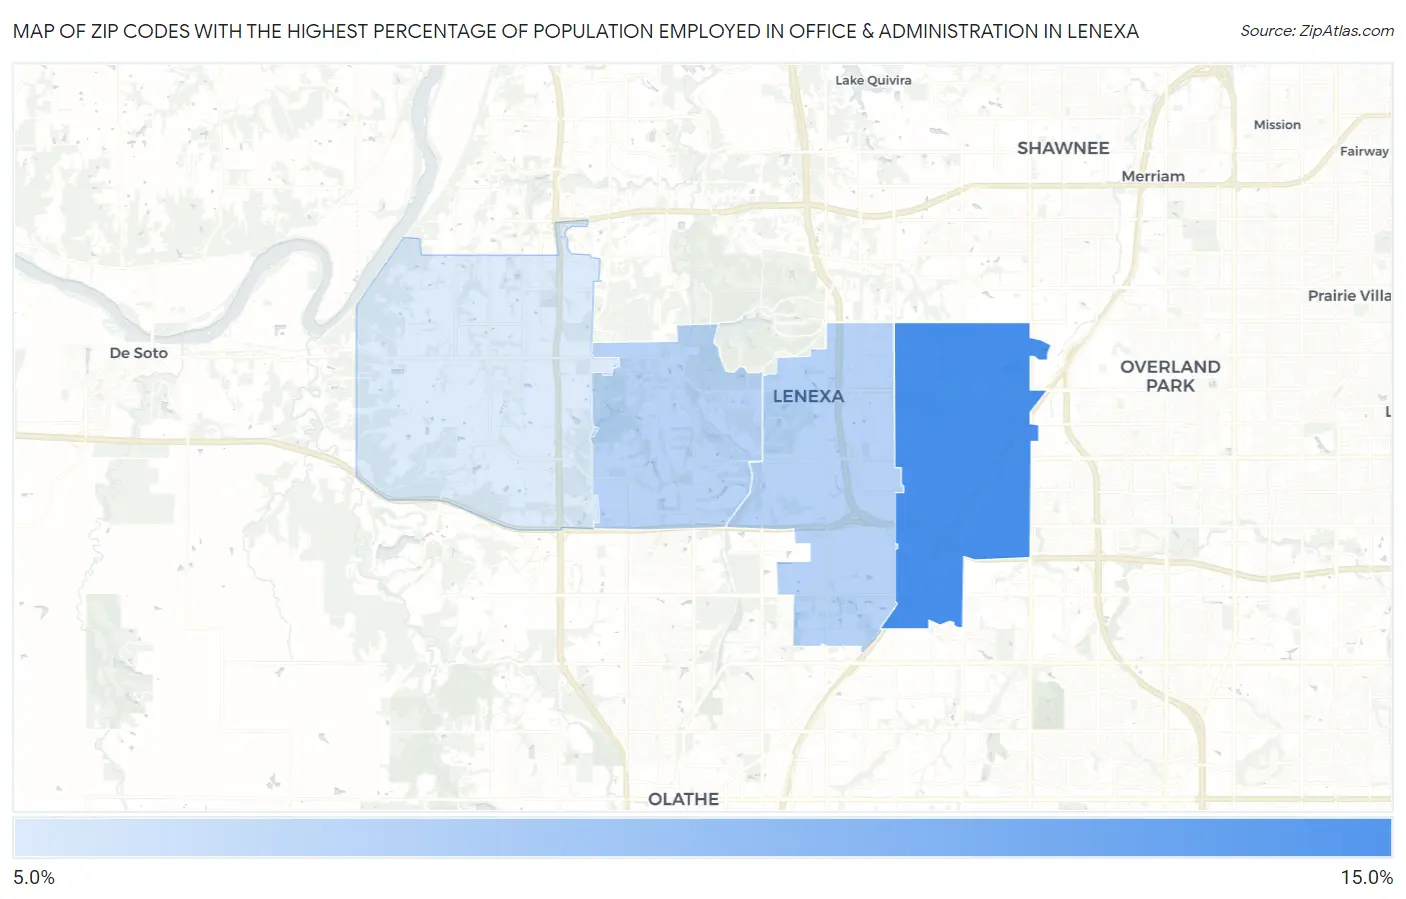
Map of Zip Codes with the Highest Percentage of Population Employed in Office & Administration in Lenexa
8.1%
13.9%
Zip Codes with the Highest Percentage of Population Employed in Office & Administration in Lenexa, KS
| Zip Code | % Employed | vs State | vs National | |
| 1. | 66215 | 13.9% | 10.6%(+3.29)#133 | 10.9%(+3.07)#6,141 |
| 2. | 66219 | 9.6% | 10.6%(-1.04)#373 | 10.9%(-1.27)#18,443 |
| 3. | 66220 | 9.5% | 10.6%(-1.09)#378 | 10.9%(-1.31)#18,596 |
| 4. | 66227 | 8.1% | 10.6%(-2.50)#463 | 10.9%(-2.72)#22,698 |
1
Common Questions
What are the Top 3 Zip Codes with the Highest Percentage of Population Employed in Office & Administration in Lenexa, KS?
Top 3 Zip Codes with the Highest Percentage of Population Employed in Office & Administration in Lenexa, KS are:
What zip code has the Highest Percentage of Population Employed in Office & Administration in Lenexa, KS?
66215 has the Highest Percentage of Population Employed in Office & Administration in Lenexa, KS with 13.9%.
What is the Percentage of Population Employed in Office & Administration in Lenexa, KS?
Percentage of Population Employed in Office & Administration in Lenexa is 11.5%.
What is the Percentage of Population Employed in Office & Administration in Kansas?
Percentage of Population Employed in Office & Administration in Kansas is 10.6%.
What is the Percentage of Population Employed in Office & Administration in the United States?
Percentage of Population Employed in Office & Administration in the United States is 10.9%.