Zip Codes with the Highest Percentage of Private Company Employees in Lenexa, KS
RELATED REPORTS & OPTIONS
Private Company Employees
Lenexa
Compare Zip Codes
Map of Zip Codes with the Highest Percentage of Private Company Employees in Lenexa
63.3%
74.8%
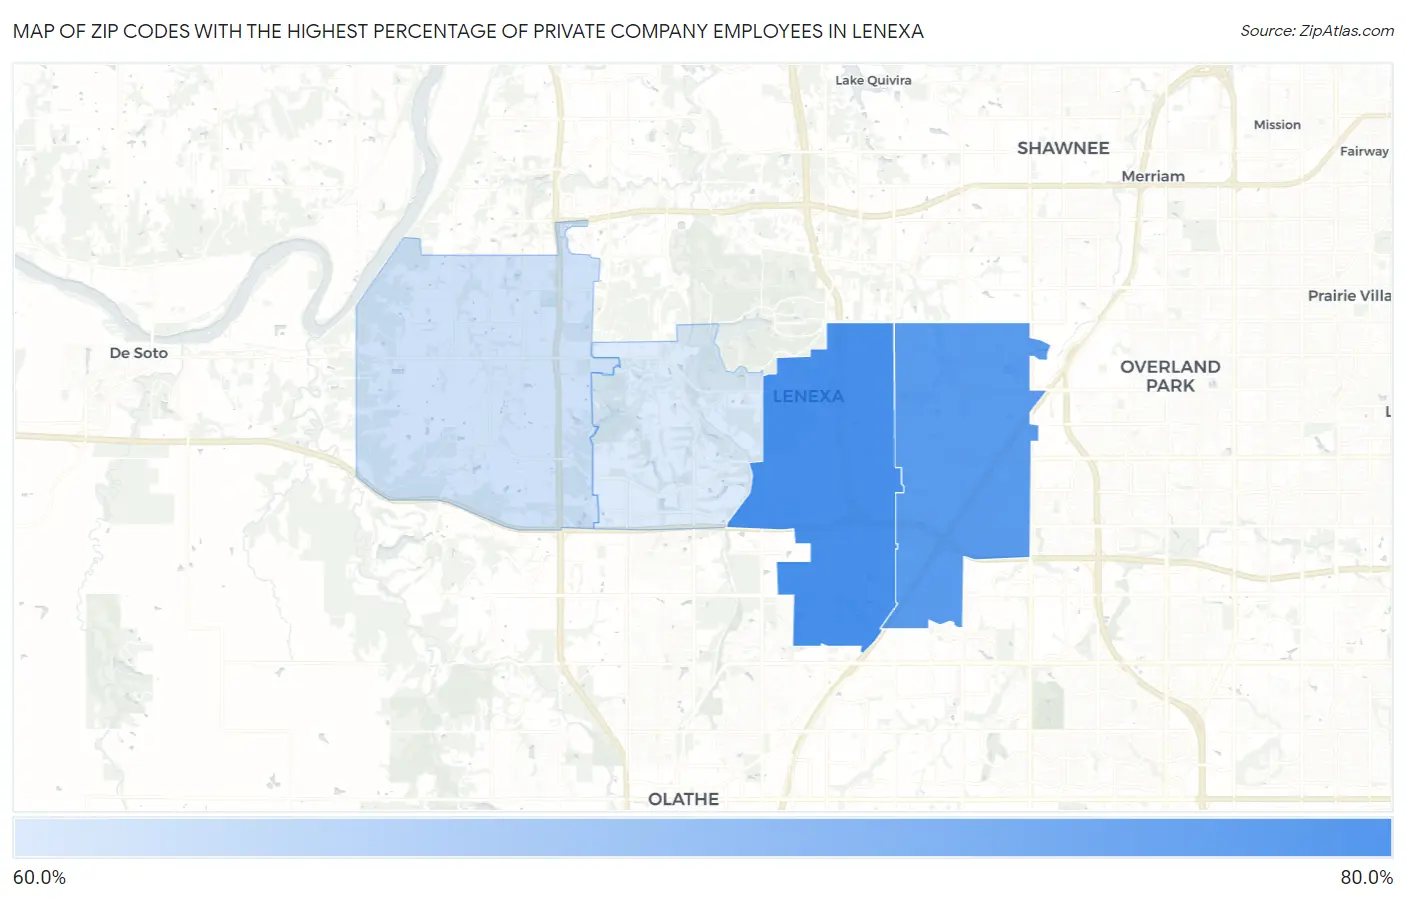
Zip Codes with the Highest Percentage of Private Company Employees in Lenexa, KS
| Zip Code | % Private Company Employees | vs State | vs National | |
| 1. | 66219 | 74.8% | 65.2%(+9.65)#62 | 66.9%(+7.95)#5,039 |
| 2. | 66215 | 73.6% | 65.2%(+8.38)#74 | 66.9%(+6.68)#6,167 |
| 3. | 66227 | 64.3% | 65.2%(-0.863)#231 | 66.9%(-2.57)#17,792 |
| 4. | 66220 | 63.3% | 65.2%(-1.87)#256 | 66.9%(-3.58)#18,995 |
1
Common Questions
What are the Top 3 Zip Codes with the Highest Percentage of Private Company Employees in Lenexa, KS?
Top 3 Zip Codes with the Highest Percentage of Private Company Employees in Lenexa, KS are:
What zip code has the Highest Percentage of Private Company Employees in Lenexa, KS?
66219 has the Highest Percentage of Private Company Employees in Lenexa, KS with 74.8%.
What is the Percentage of Private Company Employees in Lenexa, KS?
Percentage of Private Company Employees in Lenexa is 72.2%.
What is the Percentage of Private Company Employees in Kansas?
Percentage of Private Company Employees in Kansas is 65.2%.
What is the Percentage of Private Company Employees in the United States?
Percentage of Private Company Employees in the United States is 66.9%.