Zip Codes with the Highest Percentage of Population with a Degree in Arts and Humanities in Lenexa, KS
RELATED REPORTS & OPTIONS
Arts and Humanities
Lenexa
Compare Zip Codes
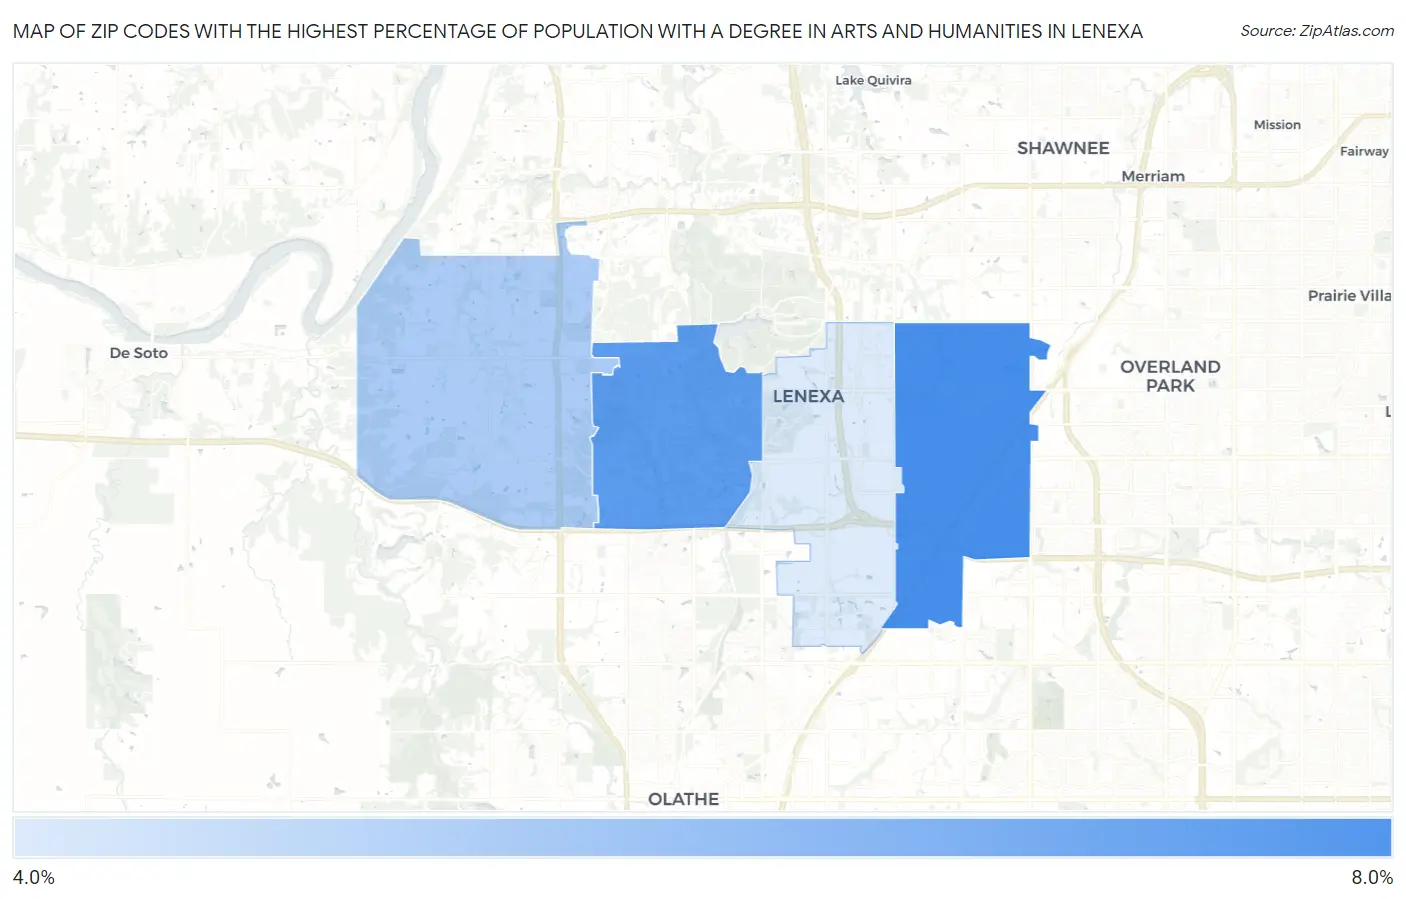
Map of Zip Codes with the Highest Percentage of Population with a Degree in Arts and Humanities in Lenexa
4.3%
7.2%
Zip Codes with the Highest Percentage of Population with a Degree in Arts and Humanities in Lenexa, KS
| Zip Code | % Graduates | vs State | vs National | |
| 1. | 66215 | 7.2% | 6.6%(+0.631)#243 | 6.0%(+1.21)#11,463 |
| 2. | 66220 | 6.8% | 6.6%(+0.266)#262 | 6.0%(+0.841)#12,387 |
| 3. | 66227 | 5.3% | 6.6%(-1.28)#329 | 6.0%(-0.704)#16,738 |
| 4. | 66219 | 4.3% | 6.6%(-2.27)#397 | 6.0%(-1.70)#19,558 |
1
Common Questions
What are the Top 3 Zip Codes with the Highest Percentage of Population with a Degree in Arts and Humanities in Lenexa, KS?
Top 3 Zip Codes with the Highest Percentage of Population with a Degree in Arts and Humanities in Lenexa, KS are:
What zip code has the Highest Percentage of Population with a Degree in Arts and Humanities in Lenexa, KS?
66215 has the Highest Percentage of Population with a Degree in Arts and Humanities in Lenexa, KS with 7.2%.
What is the Percentage of Population with a Degree in Arts and Humanities in Lenexa, KS?
Percentage of Population with a Degree in Arts and Humanities in Lenexa is 6.1%.
What is the Percentage of Population with a Degree in Arts and Humanities in Kansas?
Percentage of Population with a Degree in Arts and Humanities in Kansas is 6.6%.
What is the Percentage of Population with a Degree in Arts and Humanities in the United States?
Percentage of Population with a Degree in Arts and Humanities in the United States is 6.0%.