Zip Codes with the Highest Percentage of Households Without a Vehicle in Lenexa, KS
RELATED REPORTS & OPTIONS
Households without a Cars
Lenexa
Compare Zip Codes
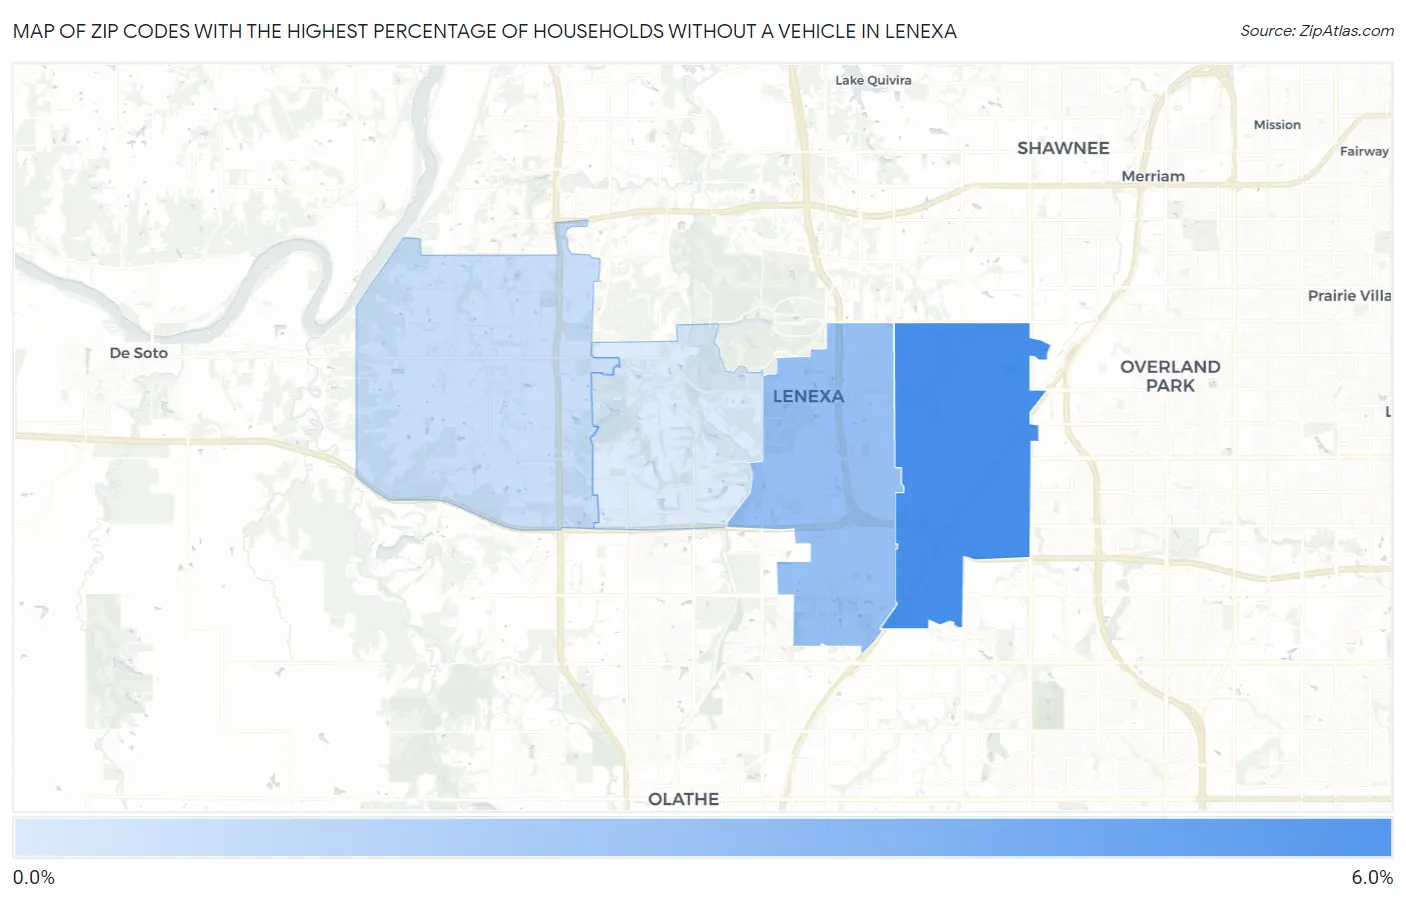
Map of Zip Codes with the Highest Percentage of Households Without a Vehicle in Lenexa
0.40%
5.3%
Zip Codes with the Highest Percentage of Households Without a Vehicle in Lenexa, KS
| Zip Code | Housholds Without a Car | vs State | vs National | |
| 1. | 66215 | 5.3% | 5.1%(+0.200)#173 | 8.3%(-3.00)#12,107 |
| 2. | 66219 | 2.7% | 5.1%(-2.40)#328 | 8.3%(-5.60)#20,144 |
| 3. | 66227 | 1.1% | 5.1%(-4.00)#475 | 8.3%(-7.20)#25,384 |
| 4. | 66220 | 0.40% | 5.1%(-4.70)#534 | 8.3%(-7.90)#27,009 |
1
Common Questions
What are the Top 3 Zip Codes with the Highest Percentage of Households Without a Vehicle in Lenexa, KS?
Top 3 Zip Codes with the Highest Percentage of Households Without a Vehicle in Lenexa, KS are:
What zip code has the Highest Percentage of Households Without a Vehicle in Lenexa, KS?
66215 has the Highest Percentage of Households Without a Vehicle in Lenexa, KS with 5.3%.
What is the Percentage of Households Without a Vehicle in Lenexa, KS?
Percentage of Households Without a Vehicle in Lenexa is 3.7%.
What is the Percentage of Households Without a Vehicle in Kansas?
Percentage of Households Without a Vehicle in Kansas is 5.1%.
What is the Percentage of Households Without a Vehicle in the United States?
Percentage of Households Without a Vehicle in the United States is 8.3%.