Zip Codes with the Highest Percentage of Indian (Asian) Population in Lenexa, KS
RELATED REPORTS & OPTIONS
Indian (Asian)
Lenexa
Compare Zip Codes
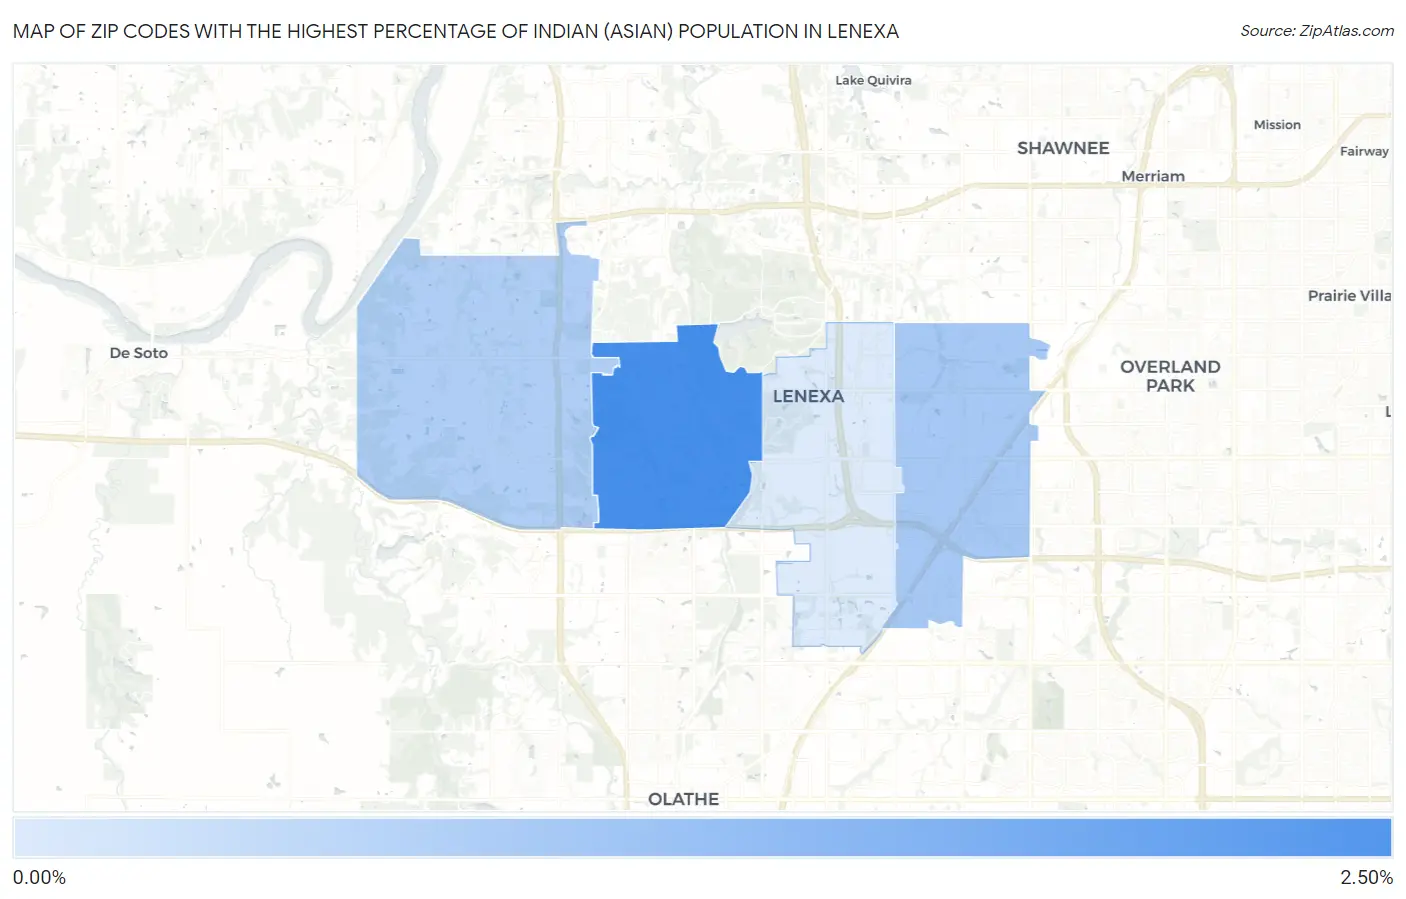
Map of Zip Codes with the Highest Percentage of Indian (Asian) Population in Lenexa
0.12%
2.11%
Zip Codes with the Highest Percentage of Indian (Asian) Population in Lenexa, KS
| Zip Code | Indian (Asian) | vs State | vs National | |
| 1. | 66220 | 2.11% | 0.61%(+1.51)#24 | 1.61%(+0.506)#2,387 |
| 2. | 66215 | 0.84% | 0.61%(+0.231)#53 | 1.61%(-0.770)#5,266 |
| 3. | 66227 | 0.73% | 0.61%(+0.123)#61 | 1.61%(-0.878)#5,775 |
| 4. | 66219 | 0.12% | 0.61%(-0.485)#145 | 1.61%(-1.49)#11,491 |
1
Common Questions
What are the Top 3 Zip Codes with the Highest Percentage of Indian (Asian) Population in Lenexa, KS?
Top 3 Zip Codes with the Highest Percentage of Indian (Asian) Population in Lenexa, KS are:
What zip code has the Highest Percentage of Indian (Asian) Population in Lenexa, KS?
66220 has the Highest Percentage of Indian (Asian) Population in Lenexa, KS with 2.11%.
What is the Percentage of Indian (Asian) Population in Lenexa, KS?
Percentage of Indian (Asian) Population in Lenexa is 1.35%.
What is the Percentage of Indian (Asian) Population in Kansas?
Percentage of Indian (Asian) Population in Kansas is 0.61%.
What is the Percentage of Indian (Asian) Population in the United States?
Percentage of Indian (Asian) Population in the United States is 1.61%.