Zip Codes with the Highest Percentage of Population Carpooling to Work in Lenexa, KS
RELATED REPORTS & OPTIONS
Drive | Carpool
Lenexa
Compare Zip Codes
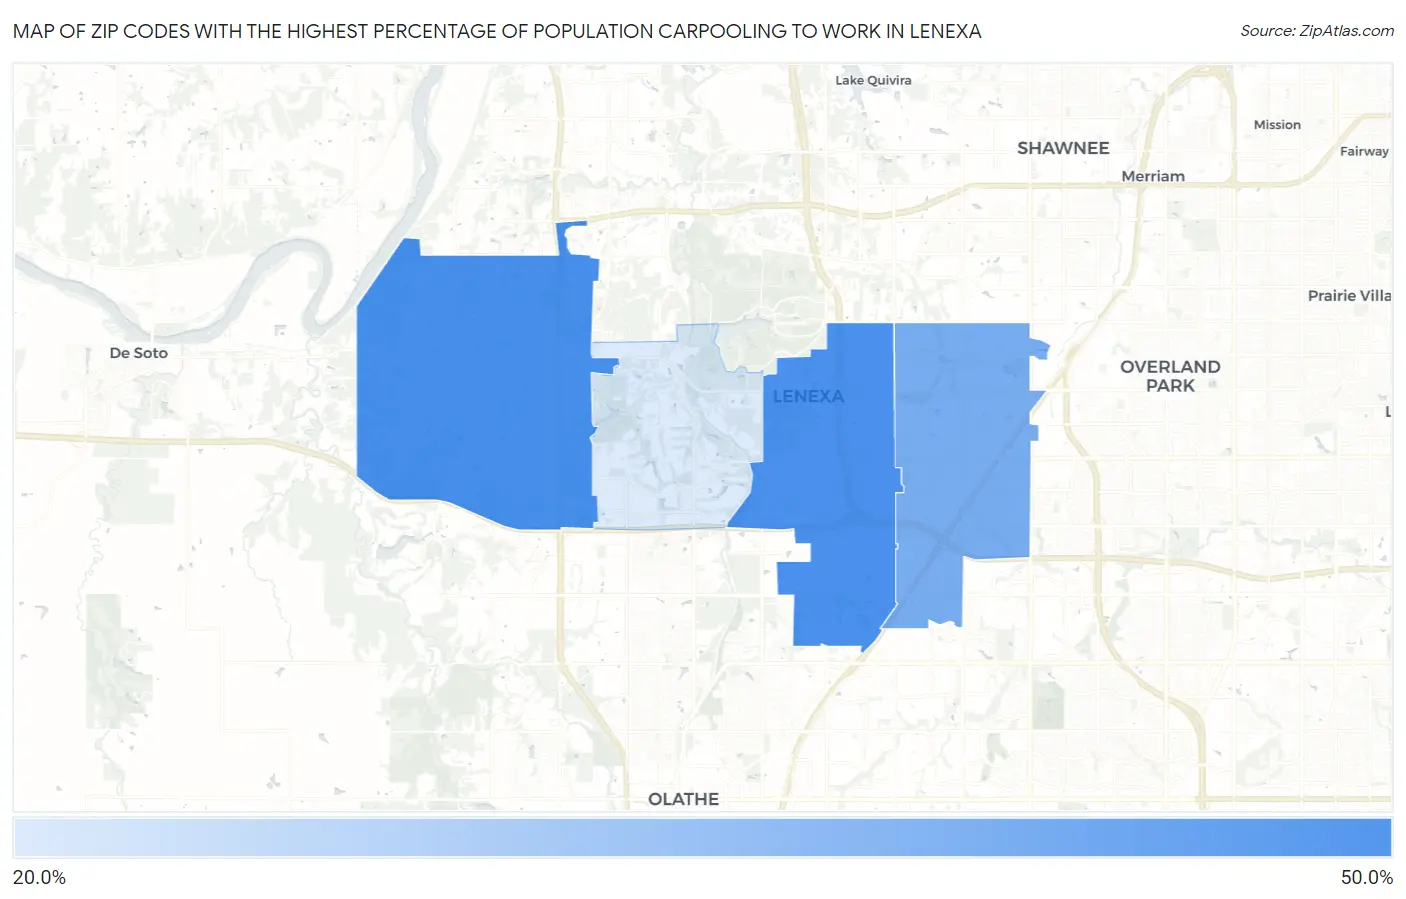
Map of Zip Codes with the Highest Percentage of Population Carpooling to Work in Lenexa
24.5%
42.3%
Zip Codes with the Highest Percentage of Population Carpooling to Work in Lenexa, KS
| Zip Code | % Carpool | vs State | vs National | |
| 1. | 66227 | 42.3% | 37.0%(+5.30)#181 | 38.2%(+4.10)#8,476 |
| 2. | 66219 | 42.1% | 37.0%(+5.10)#189 | 38.2%(+3.90)#8,721 |
| 3. | 66215 | 36.4% | 37.0%(-0.600)#342 | 38.2%(-1.80)#16,602 |
| 4. | 66220 | 24.5% | 37.0%(-12.5)#518 | 38.2%(-13.7)#24,655 |
1
Common Questions
What are the Top 3 Zip Codes with the Highest Percentage of Population Carpooling to Work in Lenexa, KS?
Top 3 Zip Codes with the Highest Percentage of Population Carpooling to Work in Lenexa, KS are:
What zip code has the Highest Percentage of Population Carpooling to Work in Lenexa, KS?
66227 has the Highest Percentage of Population Carpooling to Work in Lenexa, KS with 42.3%.
What is the Percentage of Population Carpooling to Work in Lenexa, KS?
Percentage of Population Carpooling to Work in Lenexa is 35.5%.
What is the Percentage of Population Carpooling to Work in Kansas?
Percentage of Population Carpooling to Work in Kansas is 37.0%.
What is the Percentage of Population Carpooling to Work in the United States?
Percentage of Population Carpooling to Work in the United States is 38.2%.