Zip Codes with the Highest Percentage of Immigrants from Philippines in Lenexa, KS
RELATED REPORTS & OPTIONS
Philippines
Lenexa
Compare Zip Codes
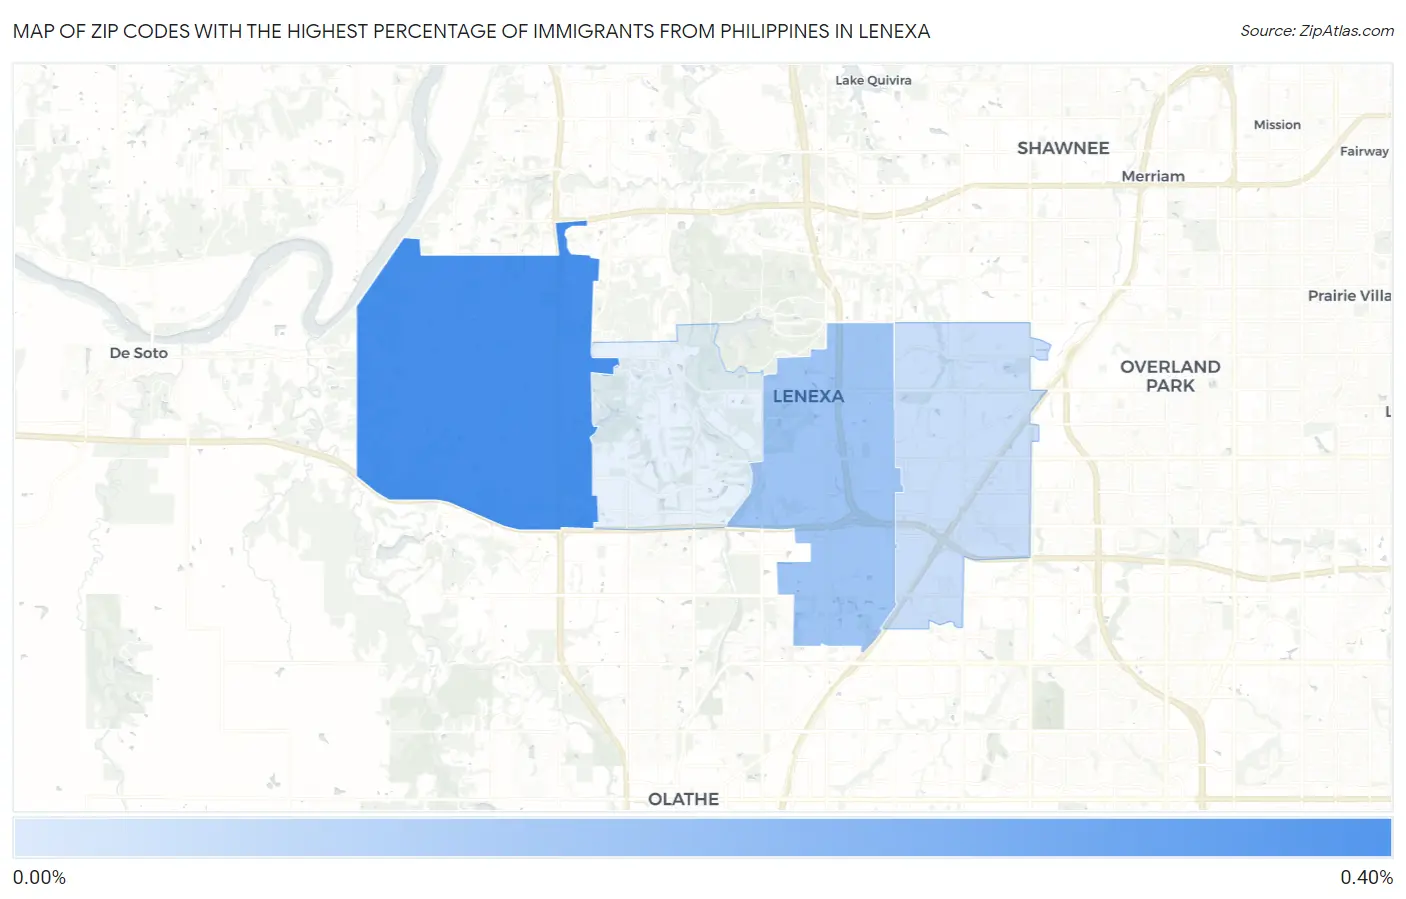
Map of Zip Codes with the Highest Percentage of Immigrants from Philippines in Lenexa
0.054%
0.38%
Zip Codes with the Highest Percentage of Immigrants from Philippines in Lenexa, KS
| Zip Code | Philippines | vs State | vs National | |
| 1. | 66227 | 0.38% | 0.19%(+0.190)#-1 | 0.60%(-0.223)#0 |
| 2. | 66219 | 0.16% | 0.19%(-0.028)#0 | 0.60%(-0.441)#1 |
| 3. | 66215 | 0.054% | 0.19%(-0.133)#1 | 0.60%(-0.546)#2 |
1
Common Questions
What are the Top 3 Zip Codes with the Highest Percentage of Immigrants from Philippines in Lenexa, KS?
Top 3 Zip Codes with the Highest Percentage of Immigrants from Philippines in Lenexa, KS are:
What zip code has the Highest Percentage of Immigrants from Philippines in Lenexa, KS?
66227 has the Highest Percentage of Immigrants from Philippines in Lenexa, KS with 0.38%.
What is the Percentage of Immigrants from Philippines in Lenexa, KS?
Percentage of Immigrants from Philippines in Lenexa is 0.12%.
What is the Percentage of Immigrants from Philippines in Kansas?
Percentage of Immigrants from Philippines in Kansas is 0.19%.
What is the Percentage of Immigrants from Philippines in the United States?
Percentage of Immigrants from Philippines in the United States is 0.60%.