Zip Codes with the Highest Percentage of Population Employed in Health Diagnosing & Treating in Lenexa, KS
RELATED REPORTS & OPTIONS
Health Diagnosing & Treating
Lenexa
Compare Zip Codes
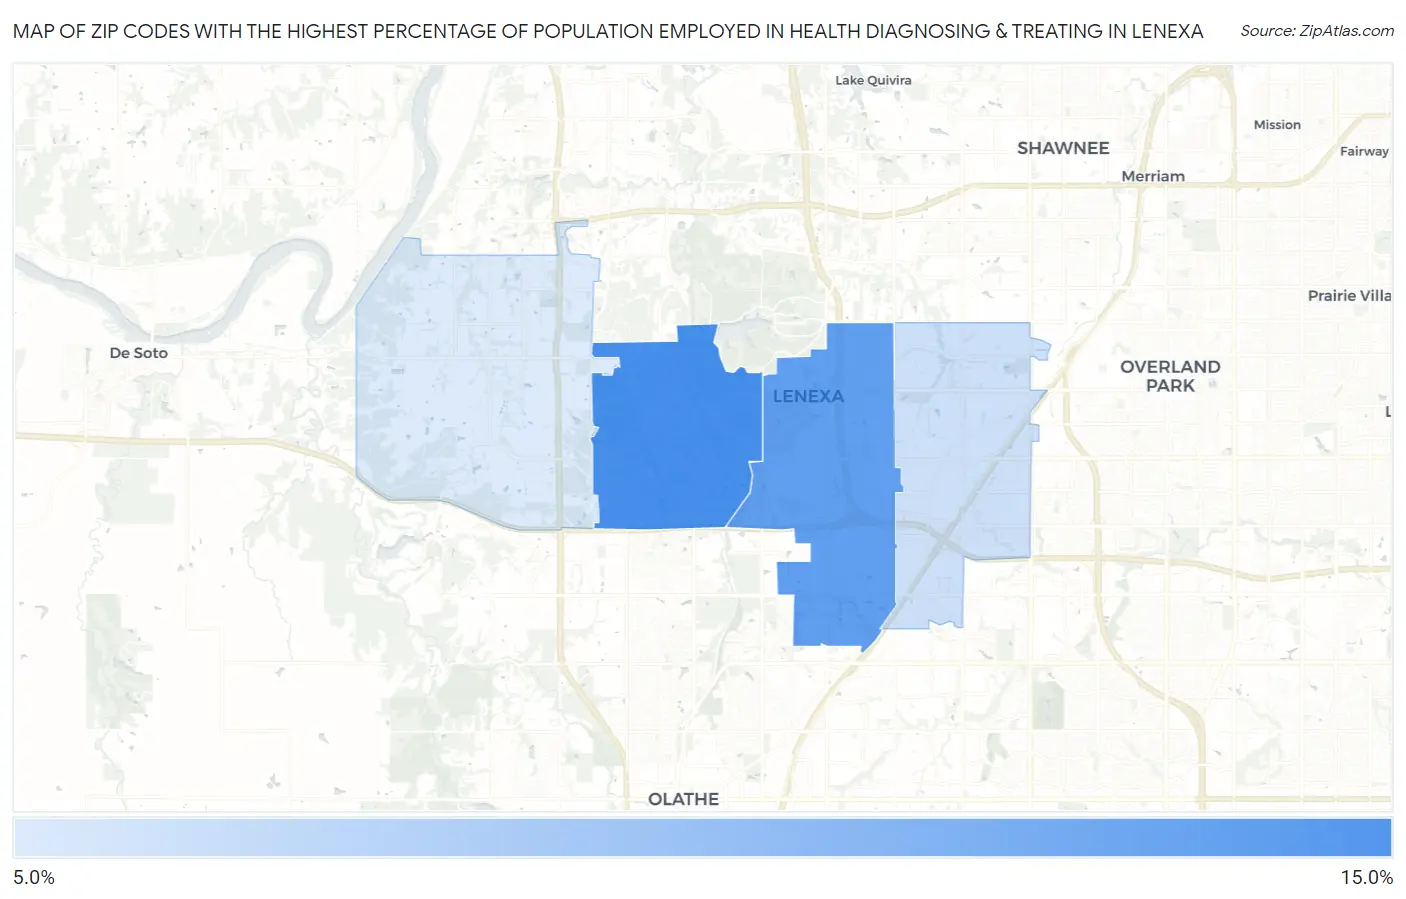
Map of Zip Codes with the Highest Percentage of Population Employed in Health Diagnosing & Treating in Lenexa
7.5%
10.2%
Zip Codes with the Highest Percentage of Population Employed in Health Diagnosing & Treating in Lenexa, KS
| Zip Code | % Employed | vs State | vs National | |
| 1. | 66220 | 10.2% | 6.6%(+3.65)#87 | 6.2%(+4.00)#3,587 |
| 2. | 66219 | 9.8% | 6.6%(+3.16)#105 | 6.2%(+3.51)#4,166 |
| 3. | 66215 | 7.8% | 6.6%(+1.21)#182 | 6.2%(+1.56)#7,982 |
| 4. | 66227 | 7.5% | 6.6%(+0.896)#195 | 6.2%(+1.25)#8,851 |
1
Common Questions
What are the Top 3 Zip Codes with the Highest Percentage of Population Employed in Health Diagnosing & Treating in Lenexa, KS?
Top 3 Zip Codes with the Highest Percentage of Population Employed in Health Diagnosing & Treating in Lenexa, KS are:
What zip code has the Highest Percentage of Population Employed in Health Diagnosing & Treating in Lenexa, KS?
66220 has the Highest Percentage of Population Employed in Health Diagnosing & Treating in Lenexa, KS with 10.2%.
What is the Percentage of Population Employed in Health Diagnosing & Treating in Lenexa, KS?
Percentage of Population Employed in Health Diagnosing & Treating in Lenexa is 8.1%.
What is the Percentage of Population Employed in Health Diagnosing & Treating in Kansas?
Percentage of Population Employed in Health Diagnosing & Treating in Kansas is 6.6%.
What is the Percentage of Population Employed in Health Diagnosing & Treating in the United States?
Percentage of Population Employed in Health Diagnosing & Treating in the United States is 6.2%.