Zip Codes with the Highest Percentage of Population Employed in Food Preparation & Serving in Lenexa, KS
RELATED REPORTS & OPTIONS
Food Preparation & Serving
Lenexa
Compare Zip Codes
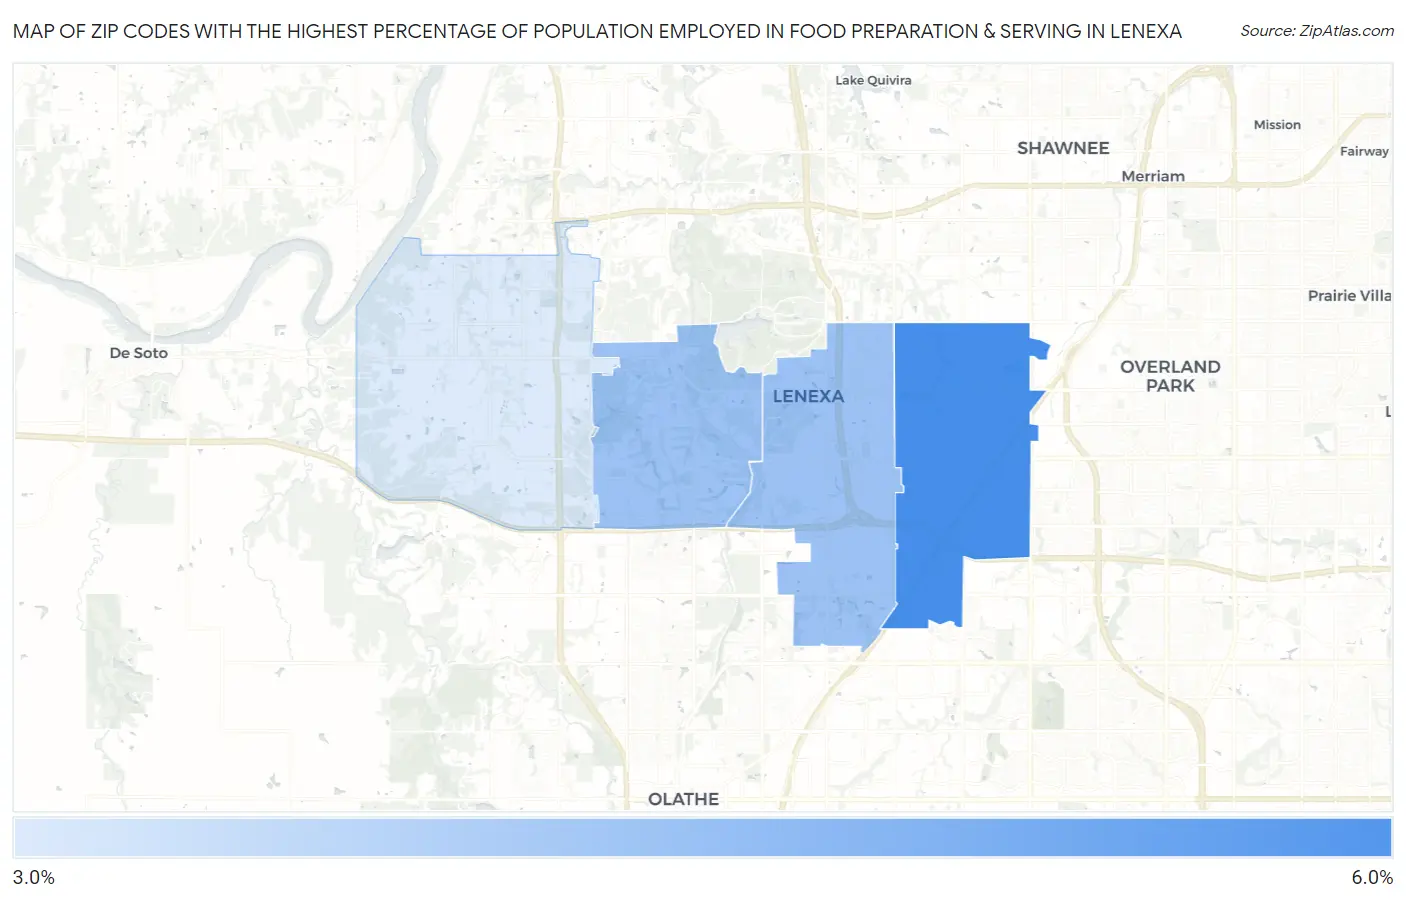
Map of Zip Codes with the Highest Percentage of Population Employed in Food Preparation & Serving in Lenexa
4.0%
5.7%
Zip Codes with the Highest Percentage of Population Employed in Food Preparation & Serving in Lenexa, KS
| Zip Code | % Employed | vs State | vs National | |
| 1. | 66215 | 5.7% | 5.2%(+0.543)#168 | 5.3%(+0.451)#10,220 |
| 2. | 66219 | 4.7% | 5.2%(-0.454)#239 | 5.3%(-0.546)#13,990 |
| 3. | 66220 | 4.7% | 5.2%(-0.458)#241 | 5.3%(-0.550)#14,010 |
| 4. | 66227 | 4.0% | 5.2%(-1.20)#301 | 5.3%(-1.29)#17,151 |
1
Common Questions
What are the Top 3 Zip Codes with the Highest Percentage of Population Employed in Food Preparation & Serving in Lenexa, KS?
Top 3 Zip Codes with the Highest Percentage of Population Employed in Food Preparation & Serving in Lenexa, KS are:
What zip code has the Highest Percentage of Population Employed in Food Preparation & Serving in Lenexa, KS?
66215 has the Highest Percentage of Population Employed in Food Preparation & Serving in Lenexa, KS with 5.7%.
What is the Percentage of Population Employed in Food Preparation & Serving in Lenexa, KS?
Percentage of Population Employed in Food Preparation & Serving in Lenexa is 5.6%.
What is the Percentage of Population Employed in Food Preparation & Serving in Kansas?
Percentage of Population Employed in Food Preparation & Serving in Kansas is 5.2%.
What is the Percentage of Population Employed in Food Preparation & Serving in the United States?
Percentage of Population Employed in Food Preparation & Serving in the United States is 5.3%.