Zip Codes with the Highest Percentage of Population Employed in Arts, Media & Entertainment in Lenexa, KS
RELATED REPORTS & OPTIONS
Arts, Media & Entertainment
Lenexa
Compare Zip Codes
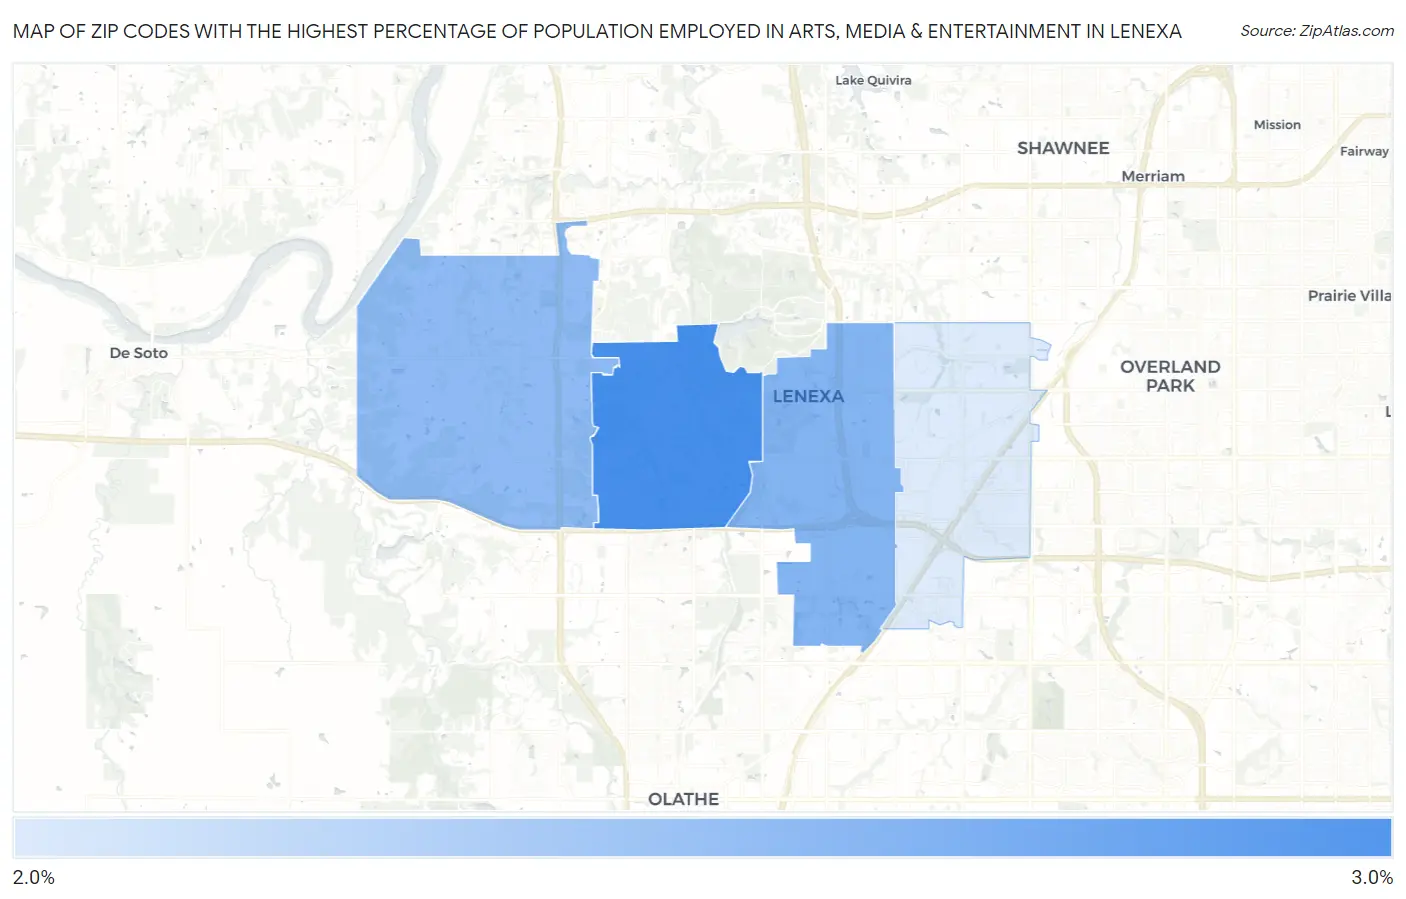
Map of Zip Codes with the Highest Percentage of Population Employed in Arts, Media & Entertainment in Lenexa
2.1%
2.5%
Zip Codes with the Highest Percentage of Population Employed in Arts, Media & Entertainment in Lenexa, KS
| Zip Code | % Employed | vs State | vs National | |
| 1. | 66220 | 2.5% | 1.6%(+0.949)#74 | 2.1%(+0.460)#5,487 |
| 2. | 66219 | 2.4% | 1.6%(+0.787)#81 | 2.1%(+0.298)#6,090 |
| 3. | 66227 | 2.3% | 1.6%(+0.750)#83 | 2.1%(+0.261)#6,287 |
| 4. | 66215 | 2.1% | 1.6%(+0.537)#95 | 2.1%(+0.048)#7,222 |
1
Common Questions
What are the Top 3 Zip Codes with the Highest Percentage of Population Employed in Arts, Media & Entertainment in Lenexa, KS?
Top 3 Zip Codes with the Highest Percentage of Population Employed in Arts, Media & Entertainment in Lenexa, KS are:
What zip code has the Highest Percentage of Population Employed in Arts, Media & Entertainment in Lenexa, KS?
66220 has the Highest Percentage of Population Employed in Arts, Media & Entertainment in Lenexa, KS with 2.5%.
What is the Percentage of Population Employed in Arts, Media & Entertainment in Lenexa, KS?
Percentage of Population Employed in Arts, Media & Entertainment in Lenexa is 2.2%.
What is the Percentage of Population Employed in Arts, Media & Entertainment in Kansas?
Percentage of Population Employed in Arts, Media & Entertainment in Kansas is 1.6%.
What is the Percentage of Population Employed in Arts, Media & Entertainment in the United States?
Percentage of Population Employed in Arts, Media & Entertainment in the United States is 2.1%.