Zip Codes with the Highest Percentage of Population Employed in Legal Services & Support in Lenexa, KS
RELATED REPORTS & OPTIONS
Legal Services & Support
Lenexa
Compare Zip Codes
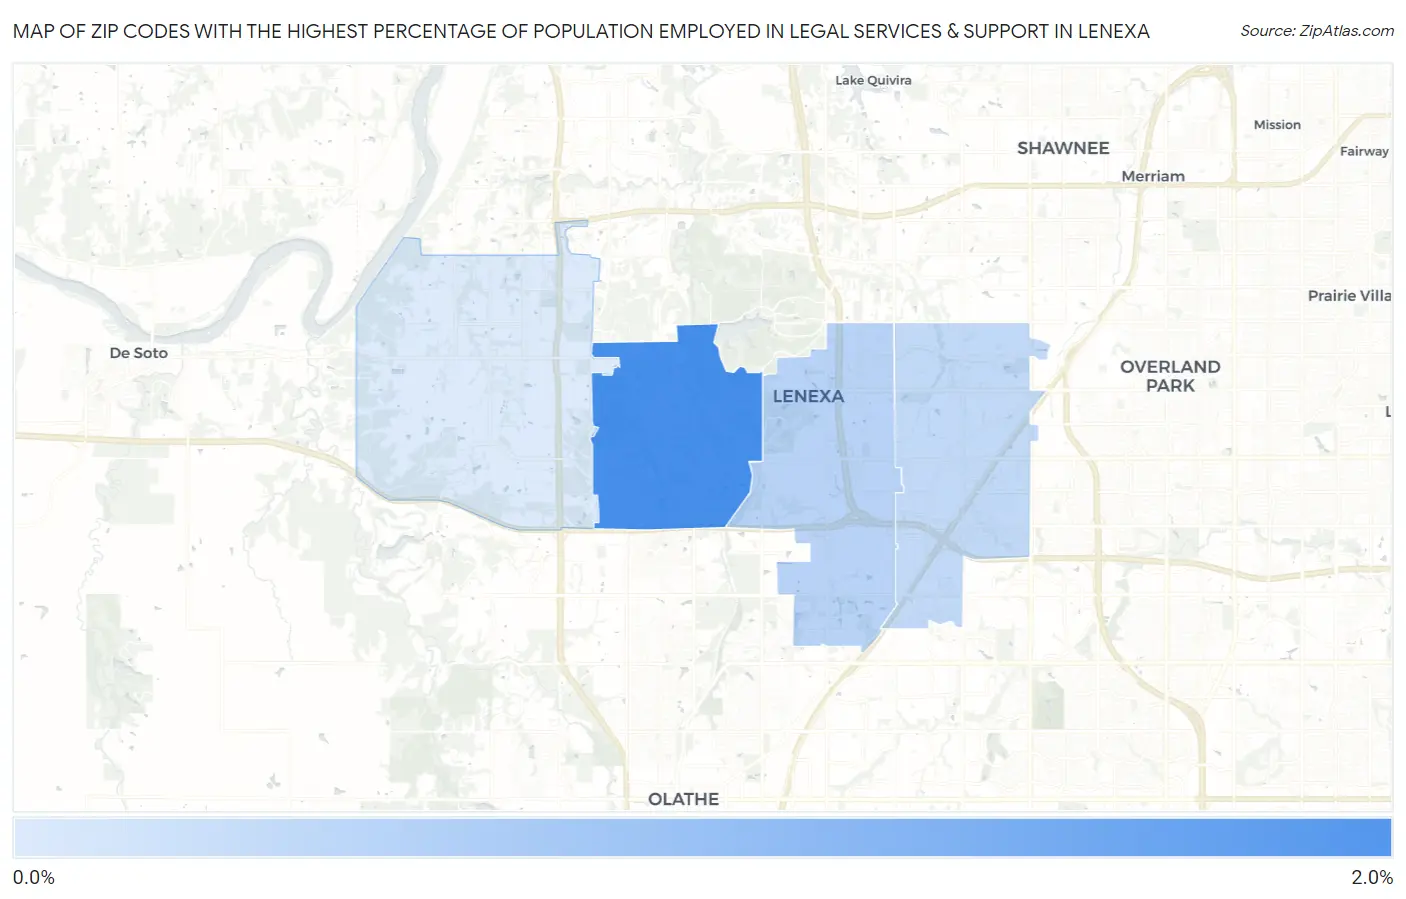
Map of Zip Codes with the Highest Percentage of Population Employed in Legal Services & Support in Lenexa
0.24%
1.6%
Zip Codes with the Highest Percentage of Population Employed in Legal Services & Support in Lenexa, KS
| Zip Code | % Employed | vs State | vs National | |
| 1. | 66220 | 1.6% | 0.90%(+0.701)#54 | 1.2%(+0.418)#4,667 |
| 2. | 66219 | 0.58% | 0.90%(-0.325)#147 | 1.2%(-0.608)#11,747 |
| 3. | 66215 | 0.49% | 0.90%(-0.406)#167 | 1.2%(-0.689)#12,696 |
| 4. | 66227 | 0.24% | 0.90%(-0.661)#219 | 1.2%(-0.944)#15,760 |
1
Common Questions
What are the Top 3 Zip Codes with the Highest Percentage of Population Employed in Legal Services & Support in Lenexa, KS?
Top 3 Zip Codes with the Highest Percentage of Population Employed in Legal Services & Support in Lenexa, KS are:
What zip code has the Highest Percentage of Population Employed in Legal Services & Support in Lenexa, KS?
66220 has the Highest Percentage of Population Employed in Legal Services & Support in Lenexa, KS with 1.6%.
What is the Percentage of Population Employed in Legal Services & Support in Lenexa, KS?
Percentage of Population Employed in Legal Services & Support in Lenexa is 0.82%.
What is the Percentage of Population Employed in Legal Services & Support in Kansas?
Percentage of Population Employed in Legal Services & Support in Kansas is 0.90%.
What is the Percentage of Population Employed in Legal Services & Support in the United States?
Percentage of Population Employed in Legal Services & Support in the United States is 1.2%.