Zip Codes with the Highest Percentage of Population Employed in Installation, Maintenance & Repair in Lenexa, KS
RELATED REPORTS & OPTIONS
Installation, Maintenance & Repair
Lenexa
Compare Zip Codes
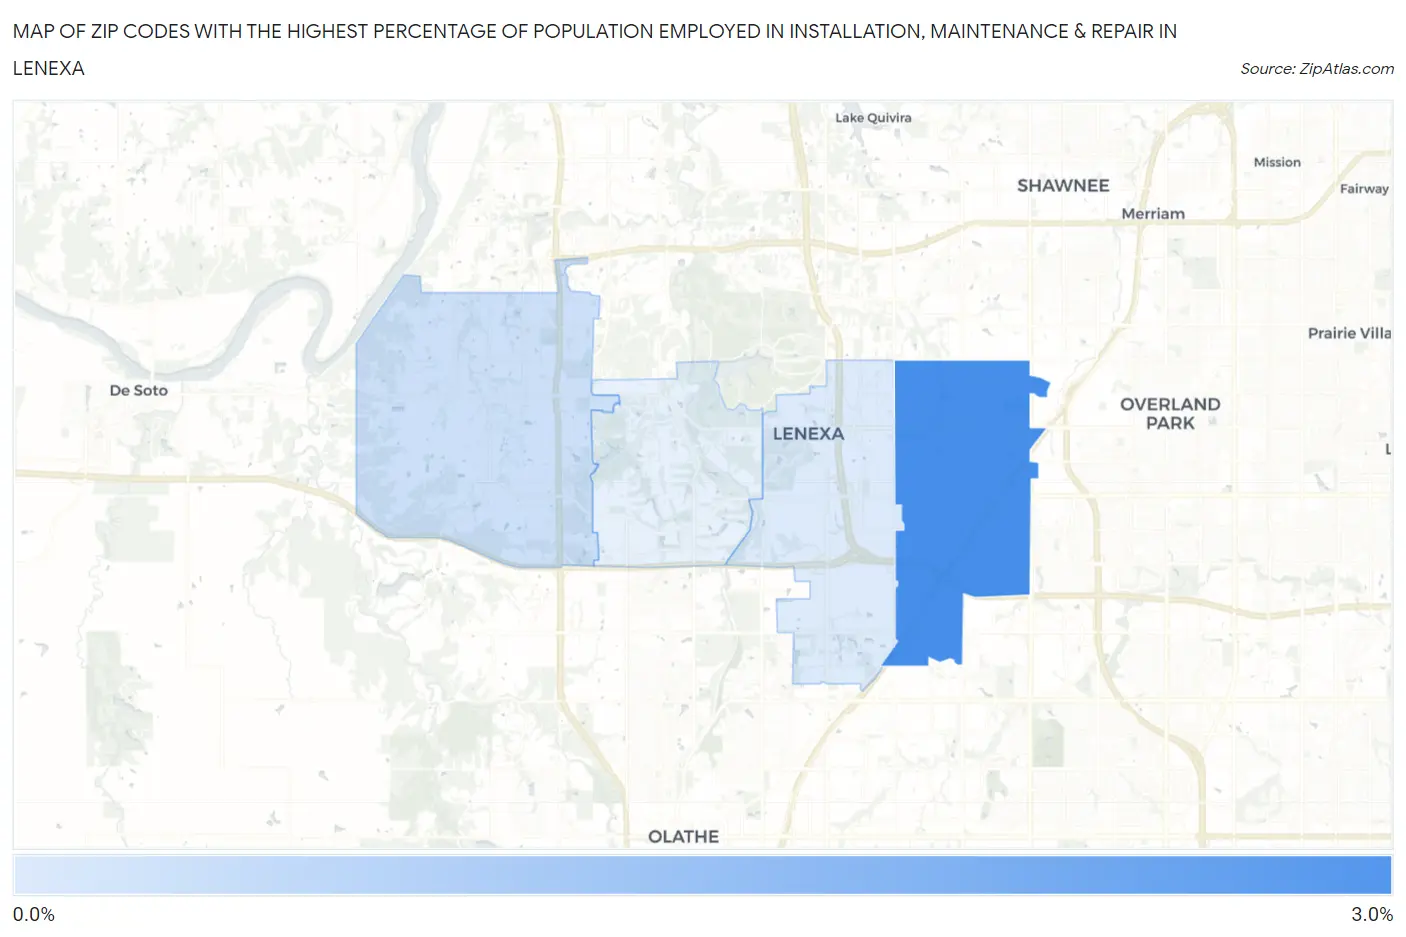
Map of Zip Codes with the Highest Percentage of Population Employed in Installation, Maintenance & Repair in Lenexa
0.97%
2.7%
Zip Codes with the Highest Percentage of Population Employed in Installation, Maintenance & Repair in Lenexa, KS
| Zip Code | % Employed | vs State | vs National | |
| 1. | 66215 | 2.7% | 3.6%(-0.920)#432 | 3.1%(-0.367)#18,552 |
| 2. | 66227 | 1.1% | 3.6%(-2.47)#551 | 3.1%(-1.92)#25,440 |
| 3. | 66219 | 0.97% | 3.6%(-2.65)#561 | 3.1%(-2.09)#25,995 |
1
Common Questions
What are the Top 3 Zip Codes with the Highest Percentage of Population Employed in Installation, Maintenance & Repair in Lenexa, KS?
Top 3 Zip Codes with the Highest Percentage of Population Employed in Installation, Maintenance & Repair in Lenexa, KS are:
What zip code has the Highest Percentage of Population Employed in Installation, Maintenance & Repair in Lenexa, KS?
66215 has the Highest Percentage of Population Employed in Installation, Maintenance & Repair in Lenexa, KS with 2.7%.
What is the Percentage of Population Employed in Installation, Maintenance & Repair in Lenexa, KS?
Percentage of Population Employed in Installation, Maintenance & Repair in Lenexa is 1.7%.
What is the Percentage of Population Employed in Installation, Maintenance & Repair in Kansas?
Percentage of Population Employed in Installation, Maintenance & Repair in Kansas is 3.6%.
What is the Percentage of Population Employed in Installation, Maintenance & Repair in the United States?
Percentage of Population Employed in Installation, Maintenance & Repair in the United States is 3.1%.