Zip Codes with the Highest Percentage of Households with Income Below $10,000 in Chicago, IL
RELATED REPORTS & OPTIONS
Household Income | $0-10k
Chicago
Compare Zip Codes
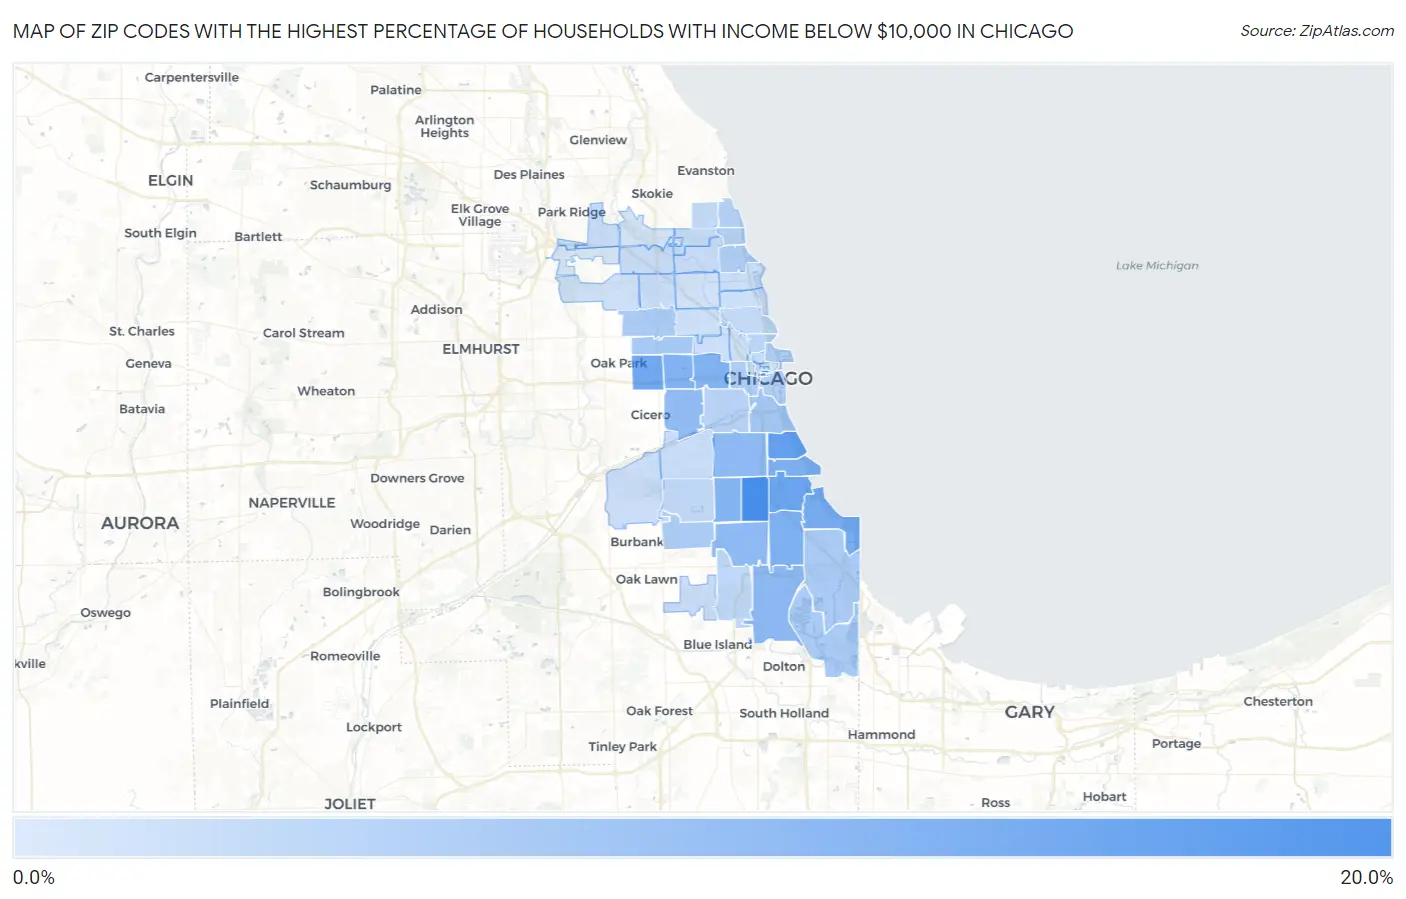
Map of Zip Codes with the Highest Percentage of Households with Income Below $10,000 in Chicago
2.1%
19.7%
Zip Codes with the Highest Percentage of Households with Income Below $10,000 in Chicago, IL
| Zip Code | Households with Income < $10k | vs State | vs National | |
| 1. | 60621 | 19.7% | 5.3%(+14.4)#14 | 4.9%(+14.8)#819 |
| 2. | 60604 | 17.3% | 5.3%(+12.0)#21 | 4.9%(+12.4)#1,119 |
| 3. | 60653 | 16.3% | 5.3%(+11.0)#24 | 4.9%(+11.4)#1,279 |
| 4. | 60637 | 15.1% | 5.3%(+9.80)#29 | 4.9%(+10.2)#1,498 |
| 5. | 60644 | 14.5% | 5.3%(+9.20)#33 | 4.9%(+9.60)#1,642 |
| 6. | 60649 | 13.6% | 5.3%(+8.30)#43 | 4.9%(+8.70)#1,870 |
| 7. | 60615 | 13.0% | 5.3%(+7.70)#50 | 4.9%(+8.10)#2,061 |
| 8. | 60619 | 12.9% | 5.3%(+7.60)#52 | 4.9%(+8.00)#2,105 |
| 9. | 60624 | 12.7% | 5.3%(+7.40)#56 | 4.9%(+7.80)#2,189 |
| 10. | 60612 | 12.7% | 5.3%(+7.40)#57 | 4.9%(+7.80)#2,190 |
| 11. | 60636 | 12.3% | 5.3%(+7.00)#63 | 4.9%(+7.40)#2,327 |
| 12. | 60603 | 12.3% | 5.3%(+7.00)#64 | 4.9%(+7.40)#2,350 |
| 13. | 60628 | 11.2% | 5.3%(+5.90)#76 | 4.9%(+6.30)#2,835 |
| 14. | 60620 | 10.9% | 5.3%(+5.60)#85 | 4.9%(+6.00)#2,994 |
| 15. | 60609 | 10.9% | 5.3%(+5.60)#86 | 4.9%(+6.00)#2,995 |
| 16. | 60623 | 10.8% | 5.3%(+5.50)#88 | 4.9%(+5.90)#3,052 |
| 17. | 60616 | 8.5% | 5.3%(+3.20)#156 | 4.9%(+3.60)#4,912 |
| 18. | 60651 | 8.3% | 5.3%(+3.00)#168 | 4.9%(+3.40)#5,149 |
| 19. | 60639 | 7.8% | 5.3%(+2.50)#190 | 4.9%(+2.90)#5,791 |
| 20. | 60617 | 7.8% | 5.3%(+2.50)#191 | 4.9%(+2.90)#5,792 |
| 21. | 60633 | 7.7% | 5.3%(+2.40)#197 | 4.9%(+2.80)#5,953 |
| 22. | 60652 | 7.6% | 5.3%(+2.30)#201 | 4.9%(+2.70)#6,054 |
| 23. | 60611 | 7.3% | 5.3%(+2.00)#229 | 4.9%(+2.40)#6,483 |
| 24. | 60607 | 7.3% | 5.3%(+2.00)#230 | 4.9%(+2.40)#6,486 |
| 25. | 60640 | 7.2% | 5.3%(+1.90)#237 | 4.9%(+2.30)#6,611 |
| 26. | 60660 | 6.8% | 5.3%(+1.50)#264 | 4.9%(+1.90)#7,300 |
| 27. | 60605 | 6.7% | 5.3%(+1.40)#272 | 4.9%(+1.80)#7,530 |
| 28. | 60626 | 6.5% | 5.3%(+1.20)#282 | 4.9%(+1.60)#7,885 |
| 29. | 60608 | 6.3% | 5.3%(+1.00)#306 | 4.9%(+1.40)#8,288 |
| 30. | 60610 | 6.0% | 5.3%(+0.700)#333 | 4.9%(+1.10)#8,969 |
| 31. | 60643 | 5.4% | 5.3%(+0.100)#403 | 4.9%(+0.500)#10,440 |
| 32. | 60629 | 5.1% | 5.3%(-0.200)#432 | 4.9%(+0.200)#11,316 |
| 33. | 60614 | 4.9% | 5.3%(-0.400)#462 | 4.9%(=0.000)#11,960 |
| 34. | 60645 | 4.9% | 5.3%(-0.400)#464 | 4.9%(=0.000)#11,971 |
| 35. | 60661 | 4.9% | 5.3%(-0.400)#469 | 4.9%(=0.000)#12,092 |
| 36. | 60659 | 4.7% | 5.3%(-0.600)#498 | 4.9%(-0.200)#12,629 |
| 37. | 60631 | 4.5% | 5.3%(-0.800)#526 | 4.9%(-0.400)#13,367 |
| 38. | 60632 | 4.3% | 5.3%(-1.00)#551 | 4.9%(-0.600)#14,014 |
| 39. | 60641 | 4.3% | 5.3%(-1.00)#552 | 4.9%(-0.600)#14,020 |
| 40. | 60654 | 4.3% | 5.3%(-1.00)#555 | 4.9%(-0.600)#14,104 |
| 41. | 60638 | 4.1% | 5.3%(-1.20)#590 | 4.9%(-0.800)#14,789 |
| 42. | 60625 | 4.0% | 5.3%(-1.30)#614 | 4.9%(-0.900)#15,184 |
| 43. | 60630 | 4.0% | 5.3%(-1.30)#615 | 4.9%(-0.900)#15,196 |
| 44. | 60613 | 4.0% | 5.3%(-1.30)#616 | 4.9%(-0.900)#15,201 |
| 45. | 60655 | 4.0% | 5.3%(-1.30)#622 | 4.9%(-0.900)#15,259 |
| 46. | 60622 | 3.9% | 5.3%(-1.40)#640 | 4.9%(-1.00)#15,585 |
| 47. | 60634 | 3.7% | 5.3%(-1.60)#675 | 4.9%(-1.20)#16,367 |
| 48. | 60657 | 3.7% | 5.3%(-1.60)#676 | 4.9%(-1.20)#16,368 |
| 49. | 60647 | 3.5% | 5.3%(-1.80)#718 | 4.9%(-1.40)#17,177 |
| 50. | 60642 | 3.5% | 5.3%(-1.80)#723 | 4.9%(-1.40)#17,289 |
| 51. | 60618 | 3.4% | 5.3%(-1.90)#732 | 4.9%(-1.50)#17,594 |
| 52. | 60601 | 3.4% | 5.3%(-1.90)#734 | 4.9%(-1.50)#17,738 |
| 53. | 60646 | 2.9% | 5.3%(-2.40)#834 | 4.9%(-2.00)#19,839 |
| 54. | 60656 | 2.5% | 5.3%(-2.80)#911 | 4.9%(-2.40)#21,575 |
| 55. | 60606 | 2.1% | 5.3%(-3.20)#995 | 4.9%(-2.80)#23,396 |
1
Common Questions
What are the Top 10 Zip Codes with the Highest Percentage of Households with Income Below $10,000 in Chicago, IL?
Top 10 Zip Codes with the Highest Percentage of Households with Income Below $10,000 in Chicago, IL are:
What zip code has the Highest Percentage of Households with Income Below $10,000 in Chicago, IL?
60621 has the Highest Percentage of Households with Income Below $10,000 in Chicago, IL with 19.7%.
What is the Percentage of Households with Income Below $10,000 in Chicago, IL?
Percentage of Households with Income Below $10,000 in Chicago is 7.3%.
What is the Percentage of Households with Income Below $10,000 in Illinois?
Percentage of Households with Income Below $10,000 in Illinois is 5.3%.
What is the Percentage of Households with Income Below $10,000 in the United States?
Percentage of Households with Income Below $10,000 in the United States is 4.9%.